Transcription
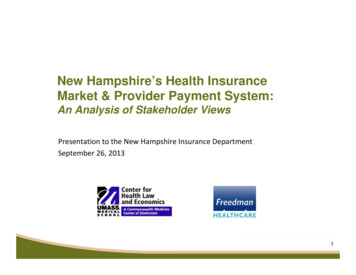
New Hampshire’s Health InsuranceMarket & Provider Payment System:An Analysis of Stakeholder ViewsPresentation to the New Hampshire Insurance DepartmentSeptember 26, 20131
Project Overview Goal: Gain better understanding of the NewHampshire insurance market What is the current contracting environment?What level of payment innovation is occurring?How does the contracting and payment system impact costsand premiums?What recommendations do stakeholders have for NHID?2
Presentation Outline1. Interview processA.B.C.D.CostsCompetitionPlan DesignDelivery & Payment Reform2. Key data findings3. Stakeholder recommendations3
Stakeholder Interviews Freedman Healthcare staff conducted 26 interviews withstakeholders from three major categories of stakeholders: Purchasers/consumersCarriersProviders Interviewees received questions and briefing paper in advanceof interviews Questions focused on: Contracting environmentDelivery system re-designNew payment and delivery modelsAsked for stakeholder recommendations for NHID and state4
Costs5
Stakeholder CommentsCostsComments Across Groups General consensus that premium and out-of-pocket costsare too high Some cited premium costs as second highest in nationA carrier and a hospital executive stated that having a singlegeographic rating area results in southern NH subsidizing northernNHComments From Carriers Several carriers noted that consolidation is driving costshigher Example: Billing for physician services as hospital outpatientservices, charging facility fees One carrier noted that hospital administrative costs arenot scrutinized in the same manner as carrieradministrative costs6
Stakeholder CommentsCostsComments From Providers Providers widely cited Medicaid underfunding as acontributor to rising premiums, due to cost-shifting 5/6 hospitals interviewed Many providers, both hospital and non-hospital,expressed concern that higher cost-sharing wasdeterring patients to seek care Result is higher costs down the road7
Stakeholder CommentsCostsComments From Employers & Purchasers Employers expressed concerns about financialsustainability Some are evaluating costs vs. benefits of droppingcoverage and allowing employees to purchase through theExchangeBoth employers interviewed developed on-site access toprimary careMunicipal employers are likely to be affected byAffordable Care Act’s “Cadillac Tax”8
Competition9
Stakeholder CommentsInsurer CompetitionCarrier Comments Carriers generally felt that the insurance market iscompetitive, specifically on service and costs Carriers noted that purchasers are very price-sensitiveand will switch carriers for a small cost-savings Particularly true for self-insured/TPA accountsProvider Comments Most providers interviewed did not believe the insurancemarket was competitive Several providers, including FQHCs and hospitals, citedAnthem as a dominant force and believed that carriershave the upper hand in contracting HPHC followed Anthem with site-of-service product10
Stakeholder CommentsProvider CompetitionComments Across Groups Stakeholders generally agreed that the hospital and physicianmarkets are not very competitive Consolidation was cited as a key challenge Exceptions of Manchester and NashuaHospitals purchasing physician practices, rising costs andincreasing provider leverageCarriers noted the particular challenge of negotiating rates withphysicians in rural areas, particularly specialistsProviders cited the effect of Massachusetts hospitals on the NHmarket11
Plan Design12
Stakeholder CommentsPlan DesignComments Across Groups Most stakeholders were not in favor of providertiering as a strategy Cited consumer loyalty, the few providers in NewHampshire, and the geographic distribution of providers Most hospitals and some carriers opposed site-ofservice plans, citing the drains on resources fromhospitals and fragmentation of care13
Stakeholder CommentsPlan DesignProvider comments Some providers expressed concern about the increaseduse of self-insured plans Shrinks fully-insured risk poolAdverse down-stream impact on premiums for fully-insured plansPurchaser comments Purchasers stated that the site-of-service model andincreased cost sharing have been the only successfullevers to mitigate costs Employers also stated that moving to self-funded plansgives them greater flexibility in plan design Both employers interviewed emphasized the importanceof wellness programs14
Delivery and Payment Reform15
Stakeholder CommentsDelivery and Payment Reform:Comments Across Groups Most participants overall noted that coordination of care andaccountability for populations is the right approach Stakeholders across groups cited the Certificate of Needprocess as flawed Some stated that the board “rubberstamps” new facilitiesOne provider questioned whether constructing new sites willlower costsMultiple interviewees said that more mental health andsubstance abuse services are needed More than one stakeholder referred to the inadequate number ofinpatient beds as a “crisis”16
Stakeholder CommentsDelivery and Payment Reform:Provider Comments Providers cited the many efforts currently underway CMS Shared Savings, Accountable Care Organizations (Dartmouthand North Country), and the Granite State Network Providers said that they are interested in assuming more risk One hospital stated that they were not interested because they donot have the required infrastructure Providers said they needed greater funding for technology and agreater capacity to act on population and performance data17
Key Data Findings18
Key Data FindingsPremium Costs Commonwealth Fund study supports stakeholder views that NHhas the second highest costs in the nation. The top five areaswere:State Average Annual FamilyPremium, 2011Massachusetts 16,953New Hampshire 16,902District of Columbia 16,606New York 16,572Vermont 16,273National Average 15,022Notably, NH family premiums are lower as a percent of medianfamily income than nationally: NH 17.9% vs. 21.5% nationallySource: Schoen, et al., Commonwealth Fund, State Trends in Premiums and Deductibles, 2003–2010: The Need for Actionto Address Rising Costs, November 201119
Key Data Findings:Patient Cost-Sharing New Hampshire’s average deductible for a familyplan is 25% higher than the Massachusettsdeductible of 2,1771; NH’s deductibles are thirdhighest in the nation High deductible health plans increased their marketshare in New Hampshire from 2010 (11% ofmembers) to 2011 (18% of members)2.1 Schoen, et al., Commonwealth Fund, State Trends in Premiums and Deductibles, 2003–2010: The Need forAction to Address Rising Costs, November 2011,2 New Hampshire Insurance Department, Supplemental Report of the 2011 Health Insurance Market in NewHampshire, February 201320
Key Data FindingsCompetition: Herfindahl-Hirschman Index UMass calculated Herfindahl-Hirschman Indices (HHI) for thecarrier and hospital markets in New Hampshire.HHI ScoreIndication 1,500Competitive1,500 – 2,500Moderate concentration 2,500Highly concentratedFor carriers, the market share in this study was defined as thepercent of total members.For hospitals, the market share was defined as percent of totalpayments.See Report appendix for further description of HHI calculation21
Key Data FindingsCarrier Competition Using the HHI data, each market in NH is highly concentratedMarketHHI Score(Based on members)Large Group2,541Small Group4,015Non Group6,054 The Kaiser Family Foundation calculated HHI scores nationally forsmall and non-groups and found that over 45 states in 2010 had marketscores greater than 2,500, indicating markets that are not competitive* NH was above national HHI scores for both small and non-groupmarkets.*Kaiser Family Foundation, Focus on Health Reform: How Competitive areState Insurance Markets?, October 2011.22
Key Data FindingsHospital HHI AnalysisMarketAcute CareHospitalsHHI Score(Based onpayments)Mid-State I93Concord, Franklin,Lakes, Speare4,783CoastalExeter, nchesterCatholic, Elliot,Parkland, St. Joseph,SNH2,39623
Data AnalysisSurvey Results: Payment Arrangements UMMS sent a survey to five of the largest carriers inNew Hampshire, obtaining 3 responses CY2011 data regarding current paymentarrangements & tiering The carrier survey indicated that, in 2011: Only 12% of total payments reported were paid using globalpayment methods (with downside risk), paid to ACOs Only 0.1% of all payments were paid in bundled paymentarrangements, used for acute (vs. chronic) conditions Of the fee schedule and charge-based payments, 20% used payfor-reporting incentives24
Data AnalysisSurvey Results: Plan Design The use of tiering and limited networks comprise less thanhalf of the total marketPercent of members by network type,3 large carriers (CY2011)100%0.6%4%Limited Network - Tiered36%Unlimited Network - Tiered90%80%70%Limited Network - Not Tiered60%50%Unlimited Network - Not Tiered40%30%59%20%10%0%% of membersSource: UMMS Carrier Survey25
StakeholderRecommendations26
Stakeholder Recommendations1.Create a shared long term vision on the health of the NH populationand align policies and regulations to support the vision.2.Continue to support transparency and the development of tools thatmake information, utilization and cost data more accessible toproviders, payers and consumers.4.NHID should play a convening role in the development of newpayment models, developing guidelines for new models, andsupporting developmental pilots.5.NHID and other state agencies should address provider payments, byencouraging greater use of alternative payment methods andaddressing public payer shortfalls.6.Increase investment in primary care7.Reform the Certificate of Need process27
Discussion Reactions Feedback28
One provider questioned whether constructing new sites will lower costs Multiple interviewees said that more mental health and . 2 New Hampshire Insurance Department, Supplemental Report of the 2011 Health Insurance Market in New Hampshire, February 2013. Key Data Findings
