Transcription
Reported Uses of CropScape and the National Cropland DataLayer ProgramRick MuellerMark HarrisUSDA/National Agricultural Statistics Service/Research and Development Division3251 Old Lee Hwy, Room 305Fairfax, VA da.govABSTRACTThis paper will highlight the unique cropland area monitoring program which was developedwithin the United States Department of Agriculture’s (USDA) National Agricultural StatisticsService (NASS). The report will also focus on the remote sensing based land cover products whichare delivered via an interactive web portal known as CropScape. CropScape provides openaccessibility, visualization, and geospatial analytics to the user community. CropScape alsosupports the ethos of data democracy, providing free and open access to digital geospatial datalayers. CropScape utilizes open web standards, thereby supporting transparent and collaborativegovernment initiatives. This paper discusses documented uses and applications of NASS’ CroplandData Layer (CDL) products, and how CropScape, a web-based program, delivered across theinternet to connect USDA researchers with a previously unreachable audience. CropScape userscan now interact, visualize, and query CDL products to determine planted agricultural cropland areaat the field level for any given year across the landscape of our nation.Keywords: Cropland Data Layer, CropScape, land cover, geospatial1. BackgroundSince 1997, NASS has produced an annual crop-specific land cover product called the CroplandData Layer (CDL). The CDL depicts more than 100 unique crop categories across the UnitedStates, and is delivered at 30 meters, or .09 hectare pixel resolution. Today, a national CDL productis available for the years 2008 through 2012, with the entire historical CDL dataset disseminated viaCropScape at http://nassgeodata.gmu.edu/CropScape. The CDL is a national land cover productdelivered just a few months after the growing season concludes. Combined, the CDL and
CropScape, are unique land cover products and dissemination methods that are not duplicatedanywhere in the world on a national scale and are performed annually.The CDL is derived using a supervised land cover classification approach. It combines thesatellite imagery collected during the growing season from such sensors as Landsat, Resourcesat,and the Disaster Monitoring Constellation. It also combines agricultural-specific ground truth datafrom USDA’s Farm Service Agency (FSA) program known as the Common Land Unit (CLU).And, it combines ancillary, non-agricultural ground truth data through the United States GeologicalSurvey’s (USGS) National Land Cover Dataset (NLCD). The process integration of these satelliteresources with highly accurate and abundant ground truth provides for this one-of-a-kind, annualnational land cover data product.In January 2011, NASS, in cooperation with George Mason University’s Center for SpatialInformation Science and Systems (CSISS), released CropScape, a new data visualization portal,thus enabling open access to NASS’s CDL geospatial data. CropScape was designed to provideusers with free and open access to interactively visualize, query, and disseminate the CDL by usinga standard browser interface to extract cropland area statistics, derive charts and graphs, andperform change analysis between years. Additionally, CropScape delivers online geoprocessingservices such as dynamic, mashable, on-demand data delivery which effectively links directly toother geospatial applications such as Google Earth.2. MethodsThe CDL program relies on synergistic partnerships with the USDA’s FSA who provides updatedreported field level data on an annual basis from the CLU data set. This effectuates a robust groundtruthing set of the agricultural domain. USDA’s Foreign Agricultural Service (FAS) providessubscription-based access to their Satellite Image Archive, thus providing independent collectionsof satellite-based data (i.e., Resourcesat or Disaster Monitoring Constellation). The USGS, whichproduces the NLCD (Xian 2009), was utilized to derive the CDL’s non-agricultural domain, alongwith the Percent Tree Canopy, Percent Imperviousness and National Elevation Dataset products.The USGS’s Earth Resources Observation Systems (EROS) Data Center has been providing freeaccess to Landsat imagery since 2008, and is also used as an image input. The CDL program andprocess to derive the CDL were described in detail (Boryan et al. 2011 and Johnson and Mueller2010), utilizing a supervised decision tree classification approach with the aforementioned datastreams.The CDL was initially disseminated via CD-ROM and DVD media in the early 2000’s, andsubsequently select states became available for download via File Transfer Protocol (FTP) from theNASS website (NASS 2013). In the mid-2000’s, USDA’s National Resources ConservationService (NRCS) began serving the entire inventory of CDL products through their Geospatial DataGateway (NRCS 2013). It became apparent that better dissemination methods were needed to meetthe growing end-users’ need to interact and query this content-rich dataset.Hence, a new interactive web-based CDL visualization method was developed to provide accesslike never before to users via web mapping services, while also offering open, geospatial protocolsfor data sharing. CropScape’s primary function (Han 2012) was to offer an interactive, visual, andanalytical experience that would enable users to download crop area statistics, examine quantitativechanges on maps between crop years, perform a visual swipe function between years, and print mapproducts. This could all be accomplished on a national level, within a state, an agricultural statisticsdistrict, or even within a county. One could also draw their own ad-hoc areas. Since CropScapewas launched in January 2011, more than 81,000 users have interacted with the site, leveraging its
comprehensive capabilities with continued demand for enhanced functionality or systemimprovement. CropScape facilitates a dynamic user experience in an open framework for decisionsupport, while also upholding numerous agricultural-specific research projects. The remainder ofthis paper focuses on published uses of CDL datasets from peer-reviewed journals and documentedwebsites that have ingested CDL data via CropScape mash-ups.3. Uses of CDLThe CDL product has matured since its creation in 1997, with methods (Boryan et al. 2011),ground truth data, and accuracies of cropland identification making vast improvements, while theCropScape portal expanded product usage from mostly power Geographic Information Systems(GIS) users to those who had little or no GIS-related experience, but had extensive agriculturalindustry knowledge. CropScape has empowered the masses to perform area change and rotationalcrop analysis with a queryable, interactive interface. CDL end-users are now documenting theiruses in peer-reviewed literature, with uses of the CDL product ranging from research on agriculturalsustainability studies, to environmental issues, land conversion assessments, crop rotations, decisionsupport, disasters, farmer surveys, carbon, bioenergy, ecology, and biodiversity. However, there isa segment of our user community who is using it for agribusiness decision support, as well as forinsurance and financial purposes. These users cannot be quantified and will not publish their usesof the CDL dataset, as their uses are considered confidential or trade secrets. Additionally, otherweb portals are developing protocols that either host the CDL data or deliver it as part of webmapping services.The research communities documented uses of CDL range from local food studies in GreenbrierValley, West Virginia, where they are identifying agricultural production areas (Hartz et al. 2011),to Montana’s Tongue River Basin, where scientists are studying water resources and availability toprovide a detailed picture of land use versus agricultural statistics (Fitzgerald and Zimmerman2013). And, users at the University of Idaho Extension (Painter et al. 2013) are leveragingCropScape to design an oilseed survey that will help producers and processors who were interestedin trying oilseed production. In another study, the CDL was utilized to identify wheat area, maskwheat fields, and then derive an empirical regression yield model for Kansas, which was then scaledto a wheat-producing region in the Ukraine (Becker-Reshef et al. 2010). Finally, the CDL wasutilized to characterize crop distributions and changes in crop rotations across the Great LakesBasin (Lunetta et al. 2010).The following studies focused on land conversions and transitions, where wetlands weretransitioning to row crops (Johnston 2013), and where western corn belt grassland was beingconverted to corn/soybean production (Wright and Wimberly 2013). Users access the CDL toscreen results with an agricultural mask and examine the agricultural rotational patterns and fallowland for wetland change monitoring in the Northern California marshlands (Potter 2013). Users inIllinois and Indiana accessed the CDL to study county level rates of conversion from farmland toevaluate developed farmland preservation policies (Thompson and Prokopy 2009). And,researchers examining the Northern Great Plains grassland conversions noted the need foradditional statistical research of such large datasets, and cited CDL accuracy assessments as acritical means for deriving parameter estimates in empirical land-use models (Rashford et al. 2013).The following studies focused on crop rotations, crop area expansion, tilled and cultivationstudies, and statistical sampling. A study (Plourde et al. 2013) focused on crop rotational patterns,with trends moving towards monoculture cropping practices, and examined rotation sequences,which reflected the increasing intensification of corn production. The CDL served as a regressiontree training model for agricultural production trends and crop rotation practices in the Great Platte
River Basin (Howard et al. 2012). Research on Iowa crop rotation patterns indicated cornexpansion into land not under recent cultivation, which impacted the amount of soil carbonsequestration (Stern et al. 2012). Four years of CDL data were assimilated to create a consistentnational level annual tilled cropland dataset, and another approach derived a cultivated rule-baseddataset modeling (Boryan et al. 2012). And, yet another study used the CDL to characterizestatistical sampling units into strata, to classify land into different types at the field level, and thenas a proxy to estimate variances for crops of interest (Zimmer 2012).The following chemical/environmental studies have used the CDL for project input: sampling siteselection for pesticide contaminants in High Plains wetlands (Belden et al. 2012); estimating totalpesticide usage and intensity in the Chincoteague Bay subbasin; characterizing agricultural,environmental, and other scientific parameters (Kutz et al. 2010); estimating the watershed scaleenvironmental impacts of corn stover removal using the Soil Water Assessment Tool (SWAT) fordetermining that stover removal was sensitive to watershed characteristics and management inputs,including slope and fertilization applications (Cibin et al. 2012), and estimating field level nitrogenlosses in another study that merged SWAT predictions with CDL data, thereby tying the changes incorn and soybean prices based on the US ethanol mandate to the expansion of the hypoxic zone inthe Gulf of Mexico (Hendricks et al. 2013).The CDL has also demonstrated uses in the carbon, bioenergy, ecology, and disaster domains. Ithas been utilized to derive net annual soil carbon changes, calculate the fossil fuel emissions fromcrop production, compute the cropland net primary production, which is used for estimating andspatial distributions, and to provide improved estimates of crop carbon dynamics in a spatiallyexplicit manner (West et al. 2009). Another study used the CDL to evaluate the potential ofmarginal lands for biomass production and mitigation efforts on greenhouse gas emissions (Gelfandet al. 2012), and a bioenergy production study (Muth et al. 2013) of comprehensive spatialassessments of residue removal across the United States. A unique application was used in a NorthDakota sunflower field study, which focused on (Schaaf et al. 2009) the foraging use of fallmigrating non-blackbirds. Finally, scientists utilized CropScape to analyze the crop damage andloss following the devastating tornadoes that devoured sections of Alabama in April 2011. UsingCropScape with tornado swath, along with National Aeronautics Space Administration resources,scientists were able to accurately describe crop damage and loss (Herdy 2012).CropScape provides for a dynamic user experience with wide-ranging capabilities in an open,geospatial context, and facilitates the delivery and analysis of geospatial cropland information to theuser community. Currently no other entity provides an annual national crop specific land coverproduct in an interactive, accessible manner, via a visually immersive experience. CropScape’sOpen Geospatial Consortium compliant architecture and web mapping services have createdopportunities from within the geospatial community to develop data sharing through the wire,encapsulating one website’s geospatial data within another, using a technique called mash-up (Hanet al. 2012).Many sites utilize web-based tools for the United States cropland, bioenergy, and soils dataexploration, including the demonstration of linking CDL spatial functionality to detailed croprotation management for agroecosystem modeling (Kipka et. al 2013) using web service requests.The Billion Ton Study (US Dept. of Energy 2011) hosts a mashable site called the KnowledgeDiscovery Framework at https://bioenergykdf.net/ where varying scales of data i.e., national,regional, and local can be queried, analyzed, uploaded, and visualized for decision-support withregard to economic and environmental impacts of development options for biomass feedstockproduction and biorefinery infrastructure. Another site where the CDL can be queried againstbioenergy datasets for acreage planted information (Yang et al. 2011) was developed in anotherapplication called integrated Agricultural Information and Management System (iAIMS), and it
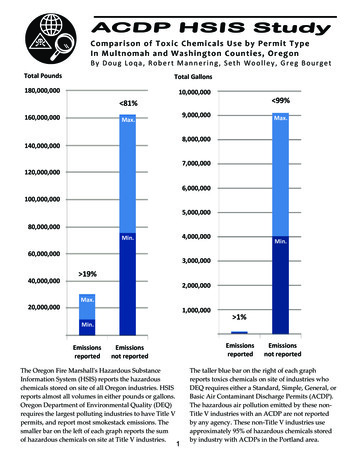
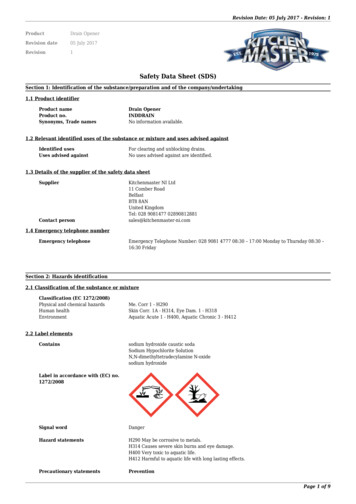
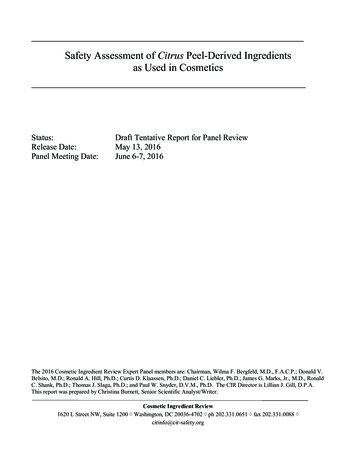
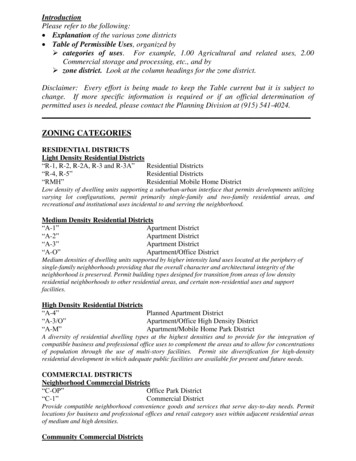
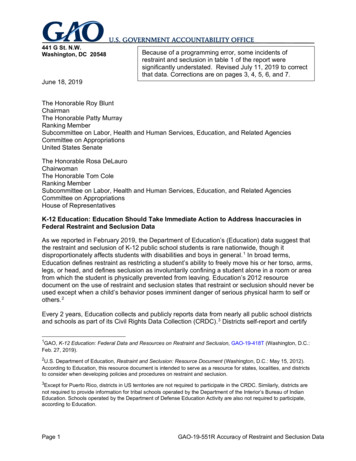
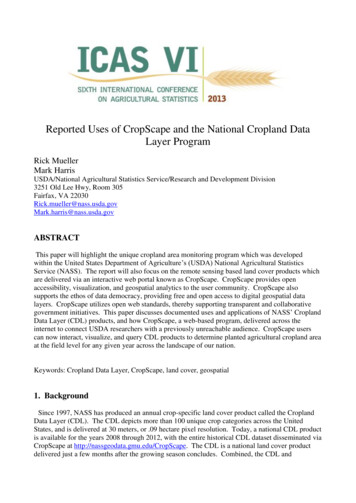
delivers dynamic and interactive climate, soil, CDLs, and road infrastructure databases athttps://beaumont.tamu.edu/CroplandData/.4. DiscussionIn preparation for this paper, Google Analytics were run against CropScape’s user base, and thefollowing information was tabulated. Figure 1a depicts CropScape’s global user base, with themajority of users coming from the United States. However, the reach of CropScape was global withusers reporting from every continent except Antarctica. Table 1 shows the number of top tencountry unique visitors in descending order using CropScape with the United States, Canada, China,Germany, United Kingdom, Argentina, France, Brazil, Spain, and Mexico. Figure 1b shows theUnited States locations of CropScape users; California, Illinois, Minnesota, Virginia, and Iowa werethe top five reported state users, in descending order. Note that both the CSISS and NASS SpatialAnalysis Research Section were located in the state of Virginia, which could account for higherthan expected numbers. The total number of unique reported visitors was 81,650 as of June 2013.Figure 2 shows the reported number of CropScape visitors since CropScape became operational inJanuary 2011. Note the sharp user access increase during both January 2012 and 2013, when thenewest CDL products were released. However, there was an intense user spike for unforeseenreasons during the end of June 2011, when users visited CropScape coincident with the release ofthe NASS June Acreage Report. It is believed that the public thought that the CDL was going to beupdated and released coincident with the June Acreage Report. However, it is impossible to releasea completed, final CDL product at this time, as it is necessary to wait until the growing season hascompleted, all crops have emerged, matured, and senesced. Once that is complete, the metadata isfinalized, and all products are checked for quality assurance and quality control.Figure 3a shows the CropScape website and interface at http://nassgeodata.gmu.edu/CropScape.CropScape provides additional ancillary data layers for purposes of navigation and dissemination,including a crop mask to shade-out all non-agricultural areas, and political, water, and roadboundary layers to facilitate orientation purposes. Figure 3b shows an enlarged depiction ofCraighead County, Arkansas in 2012, with the crop legend appearing on the left side of the graphic.Note there was much discussion and many decisions to be made to properly represent each cropcategory cartographically. When making these decisions, we considered each crop category colorand its geographic distance to similar crop colors. Mapping the more than 100 crop categories wasextremely challenging (Ebinger 2012).1a. Global CropScape users.1b. US CropScape users.Figure 1a: The darker blue color indicates higher incidence of reported CropScape users globally.Figure 1b: The darker blue color indicates higher incidence of reported CropScape users in theUS.CountryUnique Visitors
US73,303Canada1,100China913Germany502United xico291Table 1: List of the top ten unique national country visitors to CropScape, note n 81,650.Figure 2: Lists the unique number of unique visits since January 2011 when CropScape becameoperational.Figure 3a: CropScape website interface, note the CDL years of data available.
Figure 3b: A zoom enlargement of Craighead County, Arkansas 2012. The crop legend appearson the left side of the graphic.5. ConclusionThe combinations of the CDL product disseminated with CropScape provide a unique one-of-akind, interactive, visual, and analytical experience. The ethos of data democracy were upheld,providing free and open access to digital geospatial data layers in an open standard web format,supporting a transparent and collaborative government initiative. Users can query, computestatistics, perform change analysis, map, and visualize the entire inventory of CDL data derived at30m or .09 hectares resolution and show field level accuracy. The CDL is now a national levelproduct, reproduced annually and publically disseminated just a few months upon completion of thegrowing season. The reported uses of CDL and CropScape in published peer-reviewed journals andliterature were discussed.The uses of CDL data have grown, where users leverage it for agricultural decision support andscientific research. And finally, perhaps the most successful use of CropScape and the CDL wererelated websites that have developed protocols whereby they either host CDL data or deliver it aspart of web mapping services. That is the ultimate mash-up of technology and product success.REFERENCESBecker-Reshef, Inbal, Vermote, E., Lindeman, M., and Justice, C., (2010). A generalizedregression-based model for forecasting winter wheat yields in Kansas and Ukraine using MODISdata. Remote Sensing of Environment, 114(6): pp. 1312-1323.Belden, Jason, Hanson, B., McMurry, S., Smith, L., and Haukos, D., (2012). Assessment of theeffects of farming and conservation programs on pesticide deposition in High Plains wetlands.Environmental Science & Technology 46(6): pp. 3424-3432.
Boryan, Claire, Yang, Z., and Di, L., (2012). Deriving 2011 Cultivated Land Cover Data SetsUsing USDA National Agricultural Statistics Service Historic Cropland Data Layers. Proc.IGARSS 2012 Conf., Munich, Germany, July 23-26, 2012.Boryan, Claire, Yang, Z., Mueller, R., and Craig, M., (2011). “Monitoring US Agriculture: The USDepartment of Agriculture, National Agricultural Statistics Service Cropland Data LayerProgram” Geocarto International 26(5): pp. 341 – 358.Cibin, R., Chaubey, I., and Engel, B., (2012). Simulated watershed scale impacts of corn stoverremoval for biofuel on hydrology and water quality. Hydrological Processes 26 pp. 1629 – 1641.Ebinger, Lee, (2012). 133 map categories! How the US Department of Agriculture solved acomplex cartographic design problem. Wisconsin State Cartographers Office. Available plex-cartographic-design-problem.html. (Accessed 30 June 2013).Fitzgerald, Timothy, and Zimmerman, G., (2013). Agriculture in the Tongue River Basin: Output,Water Quality, and Implications. Agricultural Marketing Policy Paper No. 39, pp. 1 – 41.Gelfand, Ilya, Sahajpal, R., Zhang, X., Izaurralde, R., Gross, K., and Robertson, G., 2013.Sustainable bioenergy production from marginal lands in the US Midwest. Nature 493, pp. 514 517.Han, W., Yang, Z., Di, L., and Mueller, R., (2012). CropScape: A Web service based applicationfor exploring and disseminating US conterminous geospatial cropland data products for decisionsupport. Computers and Electronics in Agriculture Vol. 84, June, pp. 111– 123.Hartz, Laura, Boettner, F., and Clingerman, J., 2011. Greenbrier Valley Local Food: ThePossibilities and Potential. Greenbrier Valley Economic Development Corp. pp. 1 – 34.Hendricks, Nathan, Sinnathamby, S., Douglas-Mankin, K., Sumner, D., and Earnhart, D., (2013).The Environmental Effects of Crop Price Increases: Nitrogen Losses in the U.S. Corn Belt. Inpress.Herdy, Claire, Luvall, J., Cooksey, K., Brenton, J., Barrick, B., Padgett-Vasquesz, S., (2012).Alabama Disasters: Leveraging NASA EOS to explore the environmental and economic impactof the April 27 tornado outbreak. 5th Wernher von Braun Memorial Symposium; Huntsville,AL. pp. 1-9.Howard, Daniel, Wylie, B. and Tieszen, L., (2013). Crop classification modelling using remotesensing and environmental data in the Greater Platte River Basin, USA. International Journal ofRemote Sensing, 33(19): pp. 6094-6108.Johnson, David, (2013). A 2010 map estimate of annually tilled cropland within the conterminousUnited States. Agricultural Systems 114: pp. 95–105.Johnson David and Mueller R. 2010. The 2009 cropland data layer. Photogrammetric Engineering& Remote Sensing 76(11): pp. 1201 – 1205.Johnston, Carol, (2013). Wetland Losses Due to Row Crop Expansion in the Dakota PrairiePothole Region. Wetlands, 33: pp.175-182.Kipka, Holm, David, O., Lyon J., Garcia, L., Green T., Ascough II, J., and Rojas, K., (2013). Aweb-service based tool to generate crop rotation management input files for spatially distributedagroecosystem models. Hydrology Days pp. 38 – 46.Kutz, Frederick, Morgan, J., Monn, J., and Petrey, C., (2012). Geospatial approaches tocharacterizing agriculture in the Chincoteague Bay Subbasin. Environmental Monitoring andAssessment, 184(2): pp. 679-692.Lunetta, Ross, Shao, Y., Ediriwickrema, J., and Lyon J., (2010). Monitoring Agricultural CroppingPatterns across the Laurentian Great Lakes Basin Using MODIS-NDVI Data. InternationalJournal of Applied Earth Observation and Geoinformation, 12: pp. 81-88.Muth Jr., D.J., Bryden, K., and Nelson, R., (2013). Sustainable agricultural residue removal forbioenergy: A spatially comprehensive US national assessment. Applied Energy 102, pp. 403-417.NASS (2013). US Department of Agriculture, National Agricultural Statistics Service, SpatialAnalysis Research Section. Available RS1a.htm, (accessed June 27, 2013).
NRCS (2013). US Department of Agriculture, National Resources Conservation Service.Geospatial Data Gateway. Available from http://datagateway.nrcs.usda.gov, (accessed 27 June2013).Painter, Kathleen, Donlon, H., and Kane, S., (2013). Results of a 2012 survey of Idaho oilseedproducers. Agricultural Economics Extension Series. No 13-01.Plourde, James, Pijanowski, B., and Pekin, B., (2013). Evidence for increased monoculturecropping in the Central United States. Agriculture, Ecosystems & Environment, 165(15): pp 5059.Potter, Christopher, (2013). Ten years of vegetation change in Northern California marshlandsdetected using Landsat satellite image analysis. Journal of Water Resource and Protection, 5:pp. 485-494.Rashford, Benjamin, Albeke, S., and Lewis, D., (2013). Modeling Grassland Conversion:Challenges of Using Satellite Imagery Data. American Journal Agricultural Econonomics,95(2): pp. 404-411.Schaaf, Dionn, Linz, G., Doetkott, C., Lutman, M., and Bleier, W., (2008). Non-blackbird AvianOccurrence and Abundance in North Dakota Sunflower Fields, The Prairie Naturalist 40(3/4):September/December.Stern, Alan, Doraiswamy, P., and Hunt, R., (2012). Changes of crop rotation in Iowa determinedfrom the United States Department of Agriculture, National Agricultural Statistics Servicecropland data layer product. Journal of Applied Remote Sensing, 6(1): pp. 1- 16.Thompson, Aaron and Prokopy, L., (2009). Tracking urban sprawl: Using spatial data to informfarmland preservation policy. Land Use Policy, 26(2): pp. 194-202.U.S. Department of Energy. (2011). U.S. Billion-Ton Update: Biomass Supply for a Bioenergy andBioproducts Industry. R.D. Perlack and B.J. Stokes (Leads), ORNL/TM-2011/224. Oak RidgeNational Laboratory, Oak Ridge, TN. 227p.West, Tristram, Brandt, C., Baskaran, L., Hellwinckel, C., Mueller, R., Bernacchi, C., Bandaru, V.,Yang, B., Wilson, B., Marland, G., Nelson, R., De La Torre Ugarte, D., and Post, W., (2010).Cropland carbon fluxes in the United States: increasing geospatial resolution of inventory-basedcarbon accounting. Ecological Applications 20(4): pp. 1074–1086.Wright, Christopher, and Wimberly, W., (2013). Recent land use change in the Western Corn Beltthreatens grasslands and wetlands. Proceedings of the National Academy of Sciences (USA),110(10): pp. 4134-4139.Xian, G., Homer, C., Fry, J., (2009). Updating the 2001 National Land Cover Database land coverclassification to 2006 by using Landsat imagery change detection methods. Remote Sensing ofEnvironment, 113(6), 1133-1147.Yang, Yubin, Wilson, L., Wang, J., and Li, X., (2011). Development of an Integrated Cropland andSoil Data Management System for Cropping System Applications. Computers and Electronics inAgriculture, 76: 105-118.Zimmer, Stephanie, Kim, J., Nusser, S., (2012). A hierarchical clustering algorithm for multivariatestratification in stratified sampling. Joint Statistical Meetings, San Diego, CA pp. 1-11.
USDA/National Agricultural Statistics Service/Research and Development Division 3251 Old Lee Hwy, Room 305 Fairfax, VA 22030 Rick.mueller@nass.usda.gov . Service (NRCS) began serving the entire inventory of CDL products through their Geospatial Data Gateway (NRCS 2013). It became apparent that better dissemination methods were needed to meet