Transcription
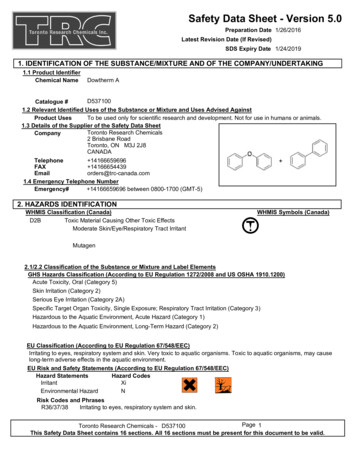
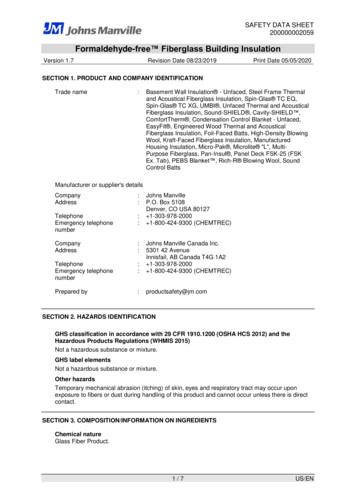
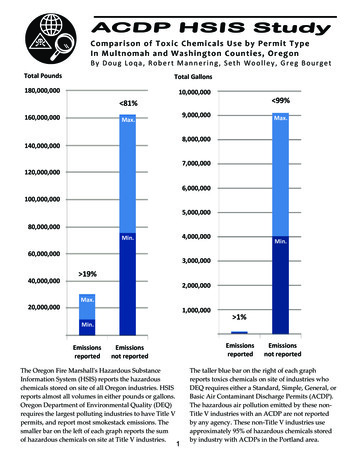
Comparison of Toxic Chemicals Use by Permit TypeIn Multnomah and Washington Counties, OregonBy Doug Loqa, Robert Mannering, Seth Woolley, Greg BourgetTotal PoundsTotal Gallons180,000,00010,000,000 99% 000Min.3,000,000 sionsreportedEmissionsnot reportedThe Oregon Fire Marshall's Hazardous SubstanceInformation System (HSIS) reports the hazardouschemicals stored on site of all Oregon industries. HSISreports almost all volumes in either pounds or gallons.Oregon Department of Environmental Quality (DEQ)requires the largest polluting industries to have Title Vpermits, and report most smokestack emissions. Thesmaller bar on the left of each graph reports the sumof hazardous chemicals on site at Title V industries. 1%1Emissionsnot reportedThe taller blue bar on the right of each graphreports toxics chemicals on site of industries whoDEQ requires either a Standard, Simple, General, orBasic Air Contaminant Discharge Permits (ACDP).The hazardous air pollution emitted by these nonTitle V industries with an ACDP are not reportedby any agency. These non-Title V industries useapproximately 95% of hazardous chemicals storedby industry with ACDPs in the Portland area.
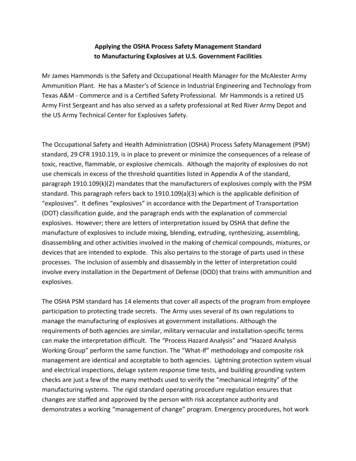
For this study we included chemicals thatcomprise hazardous industrial air pollution.We excluded chemicals that HSIS includesdue to fire danger and other hazards thatprimarily concern firefighters. The excludedHSIS Hazard Classes listed in red areexcluded by the Fire Marshall from publicdisclosure due to the threat of terrorism.HSIS Hazard Classes includedin this study6.1 Poisonous Defined by theamount that is a lethal dose.examples:ARSENICCADMIUMCHROMIC ACIDCOPPER CYANIDECOPPER CYANIDEHYDROFLUORIC ACIDHYDROGEN FLUORIDEISOCYANATESPHENOLPOTASSIUM CYANIDEZINC CYANIDE6.3 Acute Health HazardsDefined by immediate adversehealth effect from exposureexamples:ASPHALTS (PETROLEUM)COPPERDIBUTYL PHTHALATEFORMALDEHYDELEADMERCURYMONOBUTYL ETHERNAPHTHASNICKELPERCHLOROETHYLENEPETROLEUM DISTILLATESSODIUM HYPOCHLORITESTYRENE6.4 Chronic Health HazardsDefined by adverse health effectfrom long term exposureexamples:ASPHALTBISPHENOL THALENENICKELHSIS Hazard Classes excludedfrom this study1.1 CLASS A EXPLOSIVES1.2 CLASS B EXPLOSIVES1.3 CLASS C EXPLOSIVES1.4 BLASTING AGENTS1.5 INSENTITIVE EXPLOSIVES1.6 EXTREMELY INSENSITIVEDETONATING SUBSTANCES2.1 FLAMMABLE GASES2.2 NONFLAMMABLE GASES2.3 POISON GASES3.0 FLAMMABLE ANDCOMBUSTIBLE LIQUID4.1 FLAMMABLE SOLIDS4.2 SPONTANEOUSLY COMBUSTIBLEMATERIAL4.3 DANGEROUS WHEN WET4.4 REACTIVE MATERIAL4.5 COMBUSTIBLE MATERIALS5.1 OXIDIZERS5.2 ORGANIC PEROXIDES6.2 ETIOLOGIC MATERIALS6.5 PESTICIDE7.0 RADIOACTIVE MATERIALS8.0 CORROSIVES9.0 MISC.HAZ. MATERIALSFor a complete list of chemicals weremoved from Haz Class 6.1, 6.3, and 6.4for this study, see page 6 of this report.2
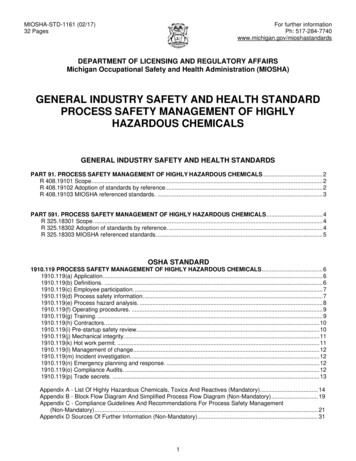
Where do hazardous chemicals go when they leave the industry?StoredHazardouschemicalsUsed byIndustryReleased tothe airWastewater sent totreatment center,stream, or riverSolid/ hazardous waste sent torecycling, incinerated/pyrolysis,hazardous waste landfill, ormade into cement3Made into aproduct
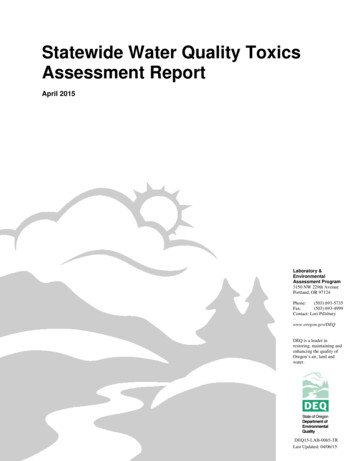
The sum of HSIS listings by ACDPThese graphs show that pollutingindustries with ACDPs that are notTitle V, those that are not requiredto report emissions, use themajority of hazardous chemicals ineach HSIS hazard class.In Multnomah and Washington CountiesPounds6,000,0005,000,0004,000,000Maximum totalMinimum total3,000,000Maximum total 6.1 PoisonousMinimum total 6.1 PoisonousMaximum total 6.3 Acute HHMinimum total 6.3 Acute HH2,000,000Maximum total 6.4 Chronic HHMinimum total 6.4 Chronic HH1,000,0000HH Health HazardTitle V Standard SimpleBasicGeneralGallons6,000,000HSIS Listings include bothpounds and gallons. A few minorHSIS listings are in cubic feetwhich we omitted. For thesegraphs we didn't convert so bothare shown here separately.5,000,000Maximum totalMinimum total4,000,000Maximum total 6.1 PoisonousMinimum total 6.1 Poisonous3,000,000Maximum total 6.3 Acute HHMinimum total 6.3 Acute HH2,000,000Maximum total 6.4 Chronic HHMinimum total 6.4 Chronic HH1,000,0000HH Health HazardTitle V Standard SimpleBasic4General
Comparing HSIS with/without an ACDPIn Multnomah and Washington Counties Pounds60,000,000Presumably most industrieswithout an ACDP do not pollutethe air. However, they store themajority of onsite hazardouschemicals. Some are air polluters;Uroboros Glass was a majorPortland air polluter without anACDP from 1973 - 2016.50,000,00040,000,000Maximum totalMinimum total30,000,000Maximum total 6.1 PoisonousMinimum total 6.1 Poisonous20,000,000Maximum total 6.3 Acute HHMinimum total 6.3 Acute HH10,000,000Maximum total 6.4 Chronic HHMinimum total 6.4 Chronic HHHH Health Hazard0Industries without an ACDP arebarely regulated. Even if allindustries without ACDPsweren't air polluters, storage ofdangerous chemicals can lead toaccidents and so still requirebetter reporting and imum totalMinimum total25,000,000Maximum total 6.1 PoisonousMinimum total 6.1 Poisonous20,000,00015,000,000Maximum total 6.3 Acute HHMinimum total 6.3 Acute HH10,000,000Maximum total 6.4 Chronic HHMinimum total 6.4 Chronic HH5,000,000HH Health Hazard05
What percentage of chemical usage is by Title V industries?HSIS chemical listings are in either pounds,gallons, or cubic feet. The only HSIS listingsin cubic feet, which we omitted, include atotal of 500-999 cubic feet of chemicals onsite at some industries with StandardACDPs and a total of 16,000 - 43,990 cubicfeet of chemicals on site at industrieswithout ACDPs.Pounds (Gallons converted to pounds):Minimum:1,411,000Title V39,636,2283.6%All other Permit types % Title VMaximum:3,786,899Title V89,072,3114.3%All other Permit types % Title VTOTAL POUNDS Multnomah County HSIS:Answer: 5% of hazardous chemical usage inMultnomah and Washington Countyis by Title V industriesMinimum:1,203,000Title V7,561,79615.9%All other Permit types % Title VMaximum:3,034,987Title V16,241,41518.7%All other Permit types % Title VHow many 55 gallon drums is that?TOTAL GALLONS Multnomah County HSIS:Divide totals by 8:Minimum:26,000Title VMaximum:Minimum:4,009,304.6%All other Permit types % Title V176,375Title VMaximum:93,9899,103,8621%Title VAll other Permit types % Title V473,362Title VWe converted gallons to pounds to report thepercentage of chemicals on site at Title Vindustries.CONVERT GALLONS TO POUNDS:1 gallon water 8.36 pounds1 gallon soap powder 8 poundsGallons x 8:Minimum gallons converted to Approximate pounds:208,000Title V32,074,432All other ACDP typesMaximum gallons converted to Approximate pounds:751,912Title V4,954,528All other Permit types72,830,896All other ACDP types611,134,038All other Permit typesAnswer:Title V industries in MultnomahCounty have 176,375 - 473,36255 gallon drums of hazardouschemicals on site.All other ACDP types have a total of4,954,528 - 11,134,03855 gallon drums of hazardouschemicals on site.
Portland Clean AirEsco's releases, along with all other Title Vindustries, are compiled by the DEQ TechnicalServices Division. This Division, required by theClean Air Act, provides data to the EnvironmentalProtection Agency National Emissions Inventory.Portland Clean Air asked a Director at DEQ'sTechnical Services Division if they knew an estimateof how much lead, chromium, mercury, cadmium,or other hazardous chemicals were released byindustry in Oregon. They replied that they did not.Oregon DEQ has no inventory, no spreadsheet, orother compiled data, other than for Title Vindustries. Yet Title V industries use less than 5% ofhazardous chemicals as demonstrated in this study.HSIS comparison byACDP by Loqa, Mannering,Bourget, and WoolleyWhy is this study important?This study demonstrates that up to 95% ofhazardous chemical usage in Multnomah andWashington Counties is by industries that do notreport hazardous air pollution. Less than 5% ofhazardous chemicals stored on site in Portland areused by industries subjected to the enhancedreporting required of Title V industries. Industriesrequire Title V permits only when they have thepotential to emit "10 tons of any single hazardousair pollutant or 25 tons of any combination ofhazardous air pollutants."This study did not access individual chemicals. Forexample HSIS in Multnomah and WashingtonCounties lists more than 20 companies using lead.For 42 years, Bullseye Glass was putting 100 poundsof lead a day into its unfiltered furnace whenmaking white glass. 85% of that lead was volatilizedup their stacks and went airborne into thesurrounding neighborhoods.In Multnomah and Washington County, the extentof this study, only 20 out of 443 industries with anACDP have a Title V Permits. These totals excludeall gas stations which require a General ACDP.It is the DEQ's job to know how much lead ormercury, or other dangerous chemicals are goinginto the air. HSIS only collects chemical storagedata. Data on how chemicals are used, and howmuch are used, has been collected in the ACDPReviews but the DEQ never typed that informationinto a spreadsheet. A knowledge of industrialprocesses is required to know how much of thechemicals used go airborne, and how much ends upin the product, or another waste stream.For Title V industries, a citizen can go online andknow what is being emitted. For example the ESCOsteel mill Title V Review is online 68esco rr.pdfOn page 24 the DEQ reports the following estimatedannual releases from the plant - here is an excerptfrom 37 hazardous air pollutants released annuallyby Esco smokestacks:Lead 207 poundsNickel 191.3 poundsChromium 132.7 poundsCadmium 56.6 poundsIt would not cost much for the DEQ to compile theresults of their onsite investigations reported inACDP Review. Many industries already know whatpercentage of the chemicals they use go airborne.Bullseye knew.For Bullseye Glass, which has not had a Title VPermit, their DEQ Permit Review reported a total of6,000 pounds a year of arsenic trioxide, cadmium,selenium, chromium, and lead being used annually- incinerated in their unfiltered furnace. This ACDPReview reporting was only to note these combinedHazardous Air Pollutants would be under 50,000pounds annually and so would not trigger arequirement for a Title V permit.This lack of interest from the DEQ in chemicalsemissions from factories has caused MultnomahCounty serious problems. The latest EPA NationalAir Toxics Assessment released December of 2015found Portland was the worst American city forrespiratory distress from air pollution. Exposure tohazardous industrial chemicals causes asthma,organ damage, birth defects, and cancer.7
Portland Clean AirHSIS comparison byACDP by Loqa, Mannering,Bourget, and WoolleyHow complete is HSIS data?If these were the only substances on site then weremoved the industry entirely. This left 1025facilities in Washington and Multnomah Counties.The Oregon Office of State Fire Marshall's HSIS hasthree auditors making random inspections offacilities, and they have a hotline for industry tohelp them report correctly. HSIS has a chemicalspecialist available for industry. There are penaltiesfor noncompliance.Multnomah County has 285 facilities with ACDPsexcluding gas stations. Washington County has 158facilities with ACDPs excluding gas stations. TotalACDPs in Washington and Multnomah Counties is443 excluding gas stations. Some air pollutingindustries do not have an ACDP at all. UroborosGlass in Portland, in the news for significantemissions of cadmium, has never been required toobtain an ACDP. New rule making in 2016 requiredUroboros to obtain an ACDP for the first time.Uroboros has always had an HSIS listing.Fire Marshalls have an interest to know whatchemicals are onsite for the safety of fire fighters.Fire Marshalls are aware of compliance and reportnew businesses to HSIS.New businesses must obtain licenses at OregonLicense Directory operated by the Secretary of -statelicense-requirements.aspxThis system reports back to HSIS so they can sendinventory forms of onsite chemical storage.Chemical storage not included in PCA's versionof HSIS dataSome HSIS data is removed as confidential. PCAdid not include any confidential data. There are tworeasons a chemical is listed as confidential:In many ways, HSIS data appears to be far morecomplete than Department of EnvironmentalQuality Air Contaminant Discharge Permit data.Trade secrets:If an industry is allowed to protect chemical storagefrom being public information because this wouldjeopardize an industrial trade secret, then thechemical is listed instead as:"tradesecret haz class" and a number such as 6.3So for example, if an industry does not list hexanebecause doing so would reveal a trade secret, thenthe Fire Marshall would see it listed as hexanebecause the Fire Marshall has a copy of theconfidential HSIS. The public would see thechemical listed as "tradesecret haz class" and anumberThere are 12,515 facilities in HSIS statewide.In Multnomah and Washington County there are2,955 HSIS facilities.For this study we removed the following chemicalnames from our geographical search:gas, diesel, batteries, battery, or propane, hydrogen- helium mix, oxygen, nitrogen, nitrous oxide,argon, methane, helium, carbon dioxide, acetylene,hydrous sand and kaolin clay, starch, sucrose,vinegar, petroleum, silica sand, inorganic salt,ethylene glocol, titanium dioxide, DEET, oil basedpaint, paint, ferrous sulfate, calcium sulfate, salt,sand, concrete, lead acid batteries, nitrogen, oxygen,helium, perlite, sodium chloride, talc, used oil,various inert gasses, sodium carbonate, silica sand,automatic transmission fluid, antifreeze, cat litterNational Security:After 911 the law changed and HSIS chemicals weremade confidential if the chemicals are:explosives, poison gasses (weapons of war likechlorine gas), etiologics (infectious agents), andradioactive materials.8
Response from the DEQPortland Clean Air sent a draft of this report tonumerous government agencies, electedofficials, air pollution groups, and neighborhoodgroups for review and comment. OregonDepartment of Environmental Quality (DEQ)responded with a page of comments. Whatfollows is DEQ's response to this report:DEQ develops a statewide emissions inventoryevery three years. The effort is a partnershipbetween DEQ and EPA. For the statewideemissions inventory, DEQ estimates smallACDP source emissions as an “area source”,with resulting concentrations at the countywide level. A good example of this areemission estimates for industrial natural gasboilers. First, DEQ identifies the total amountof natural gas fuel used in the industrial sector(this information is reported to the FederalEnergy Information Administration) and thenbreaks down the total by county. The reportedand known amounts of natural gas used byTitle V sources is then subtracted from the totalamount of natural gas used in that county.Then, DEQ applies emission factors (such asAP-42, Chapter 1.4 – Natural Gas Combustion,which can be found: ification/ap-42compilation-air-emission-factors) incombination with the amount of natural gasused, to estimate the total amount of hazardousair pollutants for that county. This is repeatedfor each county in Oregon. The results of theseefforts are available at the US EPA’s NationalEmissions Inventory website, national-emissions-inventory-nei.See the third paragraph on the right column ofpage 7 states, ”A knowledge of industrialprocesses is required to know how much of thechemicals used go airborne, and how muchends up in the product, or another wastestream.” DEQ agrees with this statement."In the third paragraph of the right column inpage 7, you state that the ACDP Reviewscontain data on chemical usage. If by“Reviews”, you are referencing the ACDPReview Reports, DEQ would agree that some,but not all, ACDP review reports containchemical usage information. In the nextparagraph (fourth paragraph of the rightcolumn on page 7), it appears that you may bereferencing a DEQ inspection report as a“Review”. DEQ inspection reports may alsohave chemical usage information, but thatdepends on whether an air quality permitrequires this information to be maintained as arecord that DEQ would review. Similar to theamounts of chemicals reported to HSIS, theamount of chemical reported in an ACDPReview Report or DEQ inspection report areusage rates and knowledge of the industrialprocess is required to determine how much of agiven chemical would leave a facility as an airemission.Overall, DEQ agrees that the current air qualityregulatory structure has not adequatelyaddressed air toxics, which is why DEQ isproceeding with the Cleaner Air Oregonrulemaking. DEQ encourages you to continueyour engagement in the Cleaner Air Oregonrulemaking process."Relating to the paragraph top right column ofpage 7, DEQ agrees that it doesn’t have afacility by facility estimate or calculation ofindustrial air toxic emissions; this is what theregulatory overhaul of the state’s air permittingprogram, “Cleaner Air Oregon”, will allow usto complete.Michael R. Orman, E.I.T.Air Quality Section Manager,Northwest RegionOregon Department of Environmental Quality700 NE Multnomah St., Suite 600Portland, OR 972329
Methodology6. Under "Table to Export" ChoosetblHSISFacility7. Under "Path and File" chooseHSISExport.accdb which is in the HSISfolder at the root of C8. Press the "Export" button9. Do steps 6-8 again but this time choosetblHSISFacilityChems10. Open HSISExport.accdbHow PCA got the HSIS and ACDP dataBy Greg Bourget, Lead Researcher,Portland Clean AirHSISA. For HSIS data I first went to:http://www.sfm.state.or.us/CR2K SubDB/SubstanceSearch.htmA sign in name and password is required firstand can be obtained through the site.There is no way to do a geographic search nor toexport the complete dataset.H. This created an Access database with two tables.One has facility information and the other haschemical storage information.I.Seth then wrote scripts that combined the datainto one table using the FacilityID column whichboth tables share in common.This produced the tab delineated dataset whichyou can download at:http://portlandcleanair.org/files/merge/The file is called joined.tabThis file can easily be imported into anyspreadsheet program such as Microsoft ExcelJ.I removed all counties other than Multnomah tocreate Mult joined HSIS.xlsB. I called the number on the page (503) 934-8353,this connected me to:Shelly Kendrick, Information AssistantCommunity Right to Know ProgramOregon Office of State Fire MarshalOregon State PoliceC. She sent me a the CR2K Information K/CR2KInfoRequestForm.pdfACDPsD. In response to sending in the completed formShelly sent me a password to access:http://www.oregon.gov/osp/SFM/pages/cr2k infoavailable.aspxFirst, it took six months of occasional phone calls toDEQ to answer the question: "How do I find outwhich industries you regulate and what chemicalsthese industries emit into the air?" DEQ workerskept referring me the DEQ Facility Profiler. Thisonline database has little benefit to the public andcannot be used to answer the question above.E. There I downloaded HSIS software whichrequires a full version of Access 2010 or later. Itcomes with Access 2010 Runtime but that is notsufficient to export data.Once we realized we wanted Air ContaminantDischarge Permit (ACDP) information, this led toanother six months of phone calls and an in-personmeeting with DEQ officials. At that meetingPortland Clean Air announced the intention to suethe DEQ to obtain access to ACDP records. TheDEQ then dropped the thousands of dollars ofrequested access fees, and wheeled about 8,000pages of paper records into their reading room ofwhich we scanned over 5,000 pages and put onlinefor the first time. At that time DEQ emailed us aspreadsheet of ACDPs for Multnomah, Washington,and Clackamas Counties. These spreadsheets wereF. I downloaded a free trial of Access 2016 at:https://products.office.com/en-us/tryG. The software didn't work so I called Shelly, sheexplained:1. Create a file called HSIS at the root to the Cdrive2. Place all downloaded files from the HSISdatabase in the HSIS folder on C3. Open HSISPublic.accdb4. Go to "Searches and Reports"5. Go to "Export"10
used for this report. Portland Clean Air and EPACvolunteers spent a total of 40 hours in the readingroom scanning all Air Contaminant DischargePermits (ACDP). Now citizens can go to ourgeographical search at portlandcleanair.org anddownload PDFs of these documents for free.7. Make a list of industries by your home orworkplace possibly causing a smell or nuisance.8. Research the ACDP permit type for eachindustry.The steps that the DEQ requires the public tocomplete to get a copy of an ACDP:1. Research the DEQ public records requestprocess.2. Research the industry(s) near the citizen's homeor workplace (Other than usingportlandcleanair.org this is almost impossible see below **)3. Fill out an online public records request formthat appears not to work (for our informationrequests I had to email in a screen shotas the "send" button did not work.)4. Wait for response5. Pay a fee or fill out a fee waiver request form6. Wait for delivery7. Repeat steps 3 - 6 for each industry near thecitizen's home of workplace.By Seth Woolley, Data Specialist,Portland Clean AirCombining the two HSIS tables provided bythe Fire MarshallThe two tables were facility and materials. I did atable join called an inner table join. I used SQLite.Using standard imports I joined using facility IDwhich was the same on both tables.Combining HSIS and ACDP dataBy Robert Mannering, GIS Director,Portland Clean AirA key focus of Portland Clean Air’s mapping ofhazardous air pollution across the city wascorrelating onsite chemical storage data with eachindustry's Air Contaminant Discharge Permit(ACDP). Chemical storage data was not includedwith the ACDPs, ACDP Reviews, ACDPApplications, or Annual Reports obtained fromDEQ. We requested and received a separate data setfrom the Portland Fire Marshal’s office that itemizedinventoried chemicals at industrial facilities acrossthe state (HSIS).Now a citizen can go to portlandcleanair.org andlook at a map and download ACDPs withoutwasting DEQ resources, fees, or their own timewasted. Step two above took me six monthsworking 1-2 hours per week, after eight phone callsto DEQ staff asking how to find out who were theindustrial air polluters by my house. My GPA was3.84 in Political Science fromHSU. I also had the help of Seth Woolley who is asenior programmer and spatialdatabase expert.** Using the DEQ Facility Profiler athttp://deq12.deq.state.or.us/fp20/to research the industries near a person's houserequires:1. Find the DEQ Facility Profile by calling DEQand talking to staff.2. Make a geographic request.3. Export the giant list that results.4. Research the numerous categories in theresulting list.5. Isolate TRAACS data.6. Plot the TRACCS data using Google maps.By combining the two datasets (ACDP and HSISlistings) we were able to better understand thechemistry of the industrial processes at known airpolluting facilities across Portland. Below is theoutline for the method used to marry the data sets.1.Examination of raw dataIn both cases, ACDP and HSIS data arrived to us inExcel format.ACDP data was presented in a one-to-onerelationship. That is, for each company in DEQsdatabase, one permit was issued. The row for eachpermit listed, among other things, the facility name,address and class of permit (basic, simple, standard,title v). There was also a field labeled ‘source11
common key was created in Excel based on the‘source number field’. Using the source numberfield, both sets of data were related to each otherand saved to a new shapefile featureset.number’ that was a unique identifier for eachfacility within the database. Crucially, from theperspective of Portland Clean Air, there was nolisting for specific chemical presences within thepermit type.As a result of the related join, it is possible withinArc to click on an ACDP feature and examine adrop down menu that displays all of the HSISrecords associated with the source number of thatACDP feature.HSIS data was presented in a many-to-manyrelationship. That is, for multiple facilities in theHSIS data, multiple entries existed for known storedchemicals on site. Data records listed the chemicalcompound as well as the maximum anticipatedamount that was in storage.2.Using ArcMap’s table to Excel feature, I was thenable to create a populated list of all known HSISchemicals at each ACDP site and distribute it alongwith maps displaying ACDP locations as well asHSIS entries that were stored at facilities that had nopermit for air contaminant discharge.Conjoining both data setsFor this study, I needed to isolate the 443 facilities inMultnomah and Washington Counties that hadbeen issued ACDPs from DEQ within the HSIS datafrom the Fire Marshal’s Office and determine themultiple HSIS records related to each unique ACDPpermit listing. Using the VLOOKUP functionwithin excel, I built an automated system thatwould, for each hazardous material listing, scan theaddress field in the HSIS listings and compare it tothe range of addresses in the ACDP data. If therewas an address match, the ‘source number’ fieldfrom the ACDP information was tied on to therelative stored chemical listing in the HSIS data.Thus, the source number field was established as akey to link the two spreadsheets in a one-to-manyrelationship: for each ACDP permit record, multipleHSIS chemical storage listings were attributed.3.Statistical analysis of HSIS data by ACDPby Doug LoqaI was provided the PCA edited HSIS dataset forMultnomah and Washington Counties that weregeotagged and matched to geotagged ACDPs.ACDPs were labeled 1 to 6. “N/A” in the ACPDfields was used when no ACDP was assigned to theindustry. Each record had weight or volumeinformation for the chemicals stored by the facilityin either pounds, gallons, or cubic feet. The facilitiesalso were broken down into categories whether afield had one of 4 Hazard class types (6.1, 6.3, 6.4,6.5). I developed a table for comparison of thedifferent facilities.Spreadsheet ProceduresMapping the results1. I copied the following fields into a separatespreadsheet: FacilityID, FacilityName,TRIFacility, County, ChemName, MaxAmt,UnitMeas, UnitDesc, HazClass1, ACDP PermitClassUsing the RLIS geocoding service provided byPortland Metro, all ACDP entries were uploaded toa point shapefile within ArcMap based on theirlisted street address. The RLIS Address Locatorplotted a 6 figure coordinate associated to eachaddress within the data. With assigned x and ycoordinate data, a map of all ACDP permits wasdisplayed in ArcMap.Within ArcMap, a tool exists for relating differentdata sets to each other. ‘Relating Tables’ in Arc is aprocess that conjoins two separate data sets using acommon key. In this case, as was described, a122. “N/A” fields were considered the same as the“6” category. On a spreadsheet, I created 3 newfields to help with the analysis: LowEnd(MaxAmt), High End(MaxAmt), and asecond ACDP Permit class with formulas thatextracted the lower value and the higher valuefrom “MaxAmt” above, and copied allinformation from ACDP Permit Class over with
a conversion condition changing all “N/A” s to“6”.this point I converted the “#Value” errors inorder to make the calculations work. R hadsome methodology to convert these to “N/A”first, and then I could select all of the “N/A”values and convert them to a number. In someof the fields, when I filtered to “N/A” values, theonly number in the spreadsheet was 42662,which most of these were.Note: there was one problem with the LowEndand HighEnd(MaxAmt) fields that wasdiscovered later. Some fields didn’t have a range(IE. ####-####). This caused an error in thosefields of “#Value”. All of those records had aMaxAmt value of either 42499 or 42662. Thesehad to be converted later and caused someminor errors as there were only a couple of thesethat had this issue.The error came into play, when in a couplefields down the line, I noticed that a couple ofthe records were 42499. I tried to go back, findthe facilities that had those, and change those to42499. It was a little tricky, and I think only 1 or2 records still were at the 42662 value. Thediscrepancies found in quality assurance wereeither a 1 or 2 multiple of the difference betweenthese two numbers (163). The discrepanciesoccurred when I compared the output totalsfrom these processes to the pivot table totals.This was the only discrepancy. The low andhigh values were the same value for both ofthese.3. I then copied the following fields into a separatesheet with all of their cold data (formulasremoved): FacilityID, FacilityName, TRIFacility,County, ChemName, Low End(MaxAmt), HighEnd(MaxAmt), UnitDesc, HazClass1,ACDPPermitClass(new).I then converted these into a .csv file, andexported this record set into R statisticalapplication software. This software has someadvanced statistical functionality and advancedgraphing capabilities. The rest of this workcould be done in Excel. There is a small pivottable in the workbook that was created based onthis information for quality assurance. Theanalysis looked at the total values.7. After conducting basic Mean and Totalcalculations, I created a few functions to runcalculations based upon the HazClass categoryof a toxin. I created a small set of comparisonvalues to run through (6.1, 6.3, 6.4, 6.5) and thenran a double loop through this set and theACDP valu
In Multnomah and Washington Count, Oregonies . By Doug Loqa, Robert Mannering, Seth Woolley, Greg Bourget . Emissions Emissions . reported not reported Emissions Emissions . reported not reported . Total Pounds . Total Gallons The Oregon Fire Marshall's Hazardous Substance Information System (HSIS) reports the hazardous