Transcription
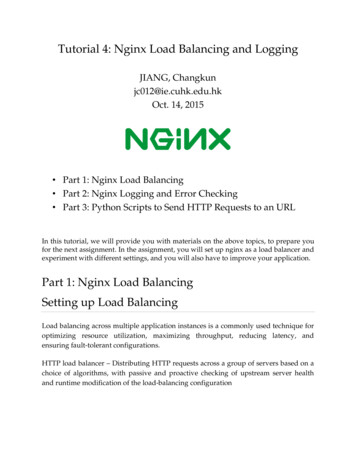
251CONTENTSMonitoring NGINX BY K YOUNG & JOHN MATSONWHAT IS NGINX?NGINX (pronounced “engine X”) is a popular HTTP server and reverseproxy server. As an HTTP server, NGINX serves static content veryefficiently and reliably, using relatively little memory. As a reverseWhat Is NGINX?Key NGINX MetricsError MetricsPerformance MetricsReverse Proxy Metrics. and more!BASIC ACTIVITY METRICSWhatever your NGINX use case, you will no doubt want to monitorhow many client requests your servers are receiving and how thoserequests are being processed.proxy server, it can be used as a single, controlled point of accessNGINX Plus can report basic activity metrics exactly like open-sourcefor multiple backend servers or for additional applications such asNGINX, but it also provides a secondary module that reports metricscaching and load balancing. NGINX is available as a free, open-sourceslightly differently. This Refcard first discusses open-source NGINX,product or in a more full-featured, commercially distributed versionthen the additional reporting capabilities provided by NGINX Plus.called NGINX Plus.NGINX can also be used as a mail proxy and a generic TCP proxy, butthis Refcard does not directly address NGINX monitoring for theseuse cases.NGINXThe diagram below shows the lifecycle of a client connection andhow the open-source version of NGINX collects metrics during aconnection.KEY NGINX METRICSBy monitoring NGINX you can catch two categories of issues:resource issues within NGINX itself, as well as problems developingelsewhere in your web infrastructure. Some of the metrics mostNGINX users will benefit from monitoring include: requests persecond, which provides a high-level view of combined end-useractivity; server error rate, which indicates how often your servers arefailing to process seemingly valid requests; and request processingtime, which describes how long your servers are taking to processclient requests (and which can point to slowdowns or other problemsin your environment).More generally, there are at least three key categories of metricsto watch: Basic activity metrics Error metrics Performance metricsBelow we’ll break down a few of the most important NGINX metricsin each category, as well as metrics for a fairly common use case thatdeserves special mention: using NGINX Plus for reverse proxying. Wewill also describe how you can monitor all of these metrics with yourFigure 1: Open-Source NGINX Client Connection LifecycleAccepts, handled, and requests are ever-increasing counters. Active,waiting, reading, and writing grow and shrink with request volume.NAMEDESCRIPTIONMETRIC TYPEacceptsCount of client connectionsattempted by NGINXResource:UtilizationhandledCount of successful ly active lated)Count of dropped connections(accepts - handled)Work: Errors*requestsCount of client requestsWork:Throughputgraphing or monitoring tools of choice.*Strictly speaking, dropped connections is a metric of resourceThis Refcard references metric terminology introduced in oursaturation, but since saturation causes NGINX to stop servicing someMonitoring 101 series, which provides a framework for metricwork (rather than queuing it up for later), “dropped” is best thought ofcollection and alerting.as a work metric.DZONE.COM DZONE, INC.VISIT DZONE.COM/REFCARDZ FOR MORE!
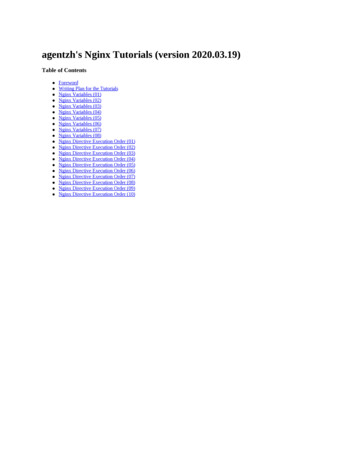
2MONITORING NGINXThe accepts counter is incremented when an NGINX worker picksAccepted, dropped, and total are ever-increasing counters. Active,up a request for a connection from the OS, whereas handled isidle, and current track the current number of connections or requestsincremented when the worker actually gets a connection for thein each of those states, so they grow and shrink with request volume.request (by establishing a new connection or reusing an open one).These two counts are usually the same—any divergence indicates thatconnections are being dropped, often because a resource limit, suchas NGINX’s worker connections limit, has been reached.Once NGINX successfully handles a connection, the connectionmoves to an active state, where it remains as client requestsare processed:ACTIVE STATEAn active connection may also be in a Waiting substate ifthere is no active request at the moment. New connectionsNAMEDESCRIPTIONMETRIC TYPEacceptedCount of client connectionsattempted by NGINXResource: UtilizationdroppedCount of dropped connectionsWork: Errors*activeCurrently active client connectionsResource: UtilizationidleClient connections with zero currentrequestsResource: UtilizationtotalCount of client requestsWork: Throughputcan bypass this state and move directly to Reading, mostWaitingcommonly when using “accept filter” or “deferred accept,” inThe accepted counter is incremented when an NGINX Plus workerwhich case NGINX does not receive notice of work until it haspicks up a request for a connection from the OS. If the worker fails toenough data to begin working on the response. Connectionsget a connection for the request (by establishingwill also be in the Waiting state after sending a response if theconnection is set to keep-alive.When a request is received, the connection moves out of theReadinga new connection or reusing an open one), then the connectionis dropped, and the dropped counter is incremented. Ordinarilywaiting state, and the request itself is counted as Reading. Inconnections are dropped because a resource limit, such as NGINXthis state NGINX is reading a client request header. RequestPlus’s worker connectionslimit, has been reached.headers are lightweight, so this is usually a fast operation.Active and idle are the same as the active and waiting states inWritingAfter the request is read, it is counted as Writing, and remainsopen-source NGINX as described above, with one key exception: inin that state until a response is returned to the client. Thisopen-source NGINX, waiting falls under the active umbrella, whereasmeans that the request is Writing while NGINX is waiting forresults from upstream systems (systems “behind” NGINX), andwhile NGINX is operating on the response. Requests will oftenspend the majority of their time in the Writing state.in NGINX Plus idle connections are excluded from the active count.Current is the same as the combined reading writing states in opensource NGINX.Total is a cumulative count of client requests. Note that a single clientOften a connection will only support one request at a time. In thisconnection can involve multiple requests, so this number may becase, the number of Active connections Waiting connections significantly larger than the cumulative number of connections. In fact,Reading requests Writing requests. However, the newer SPDY and(total / accepted) yields the average number of requests per connection.HTTP/2 protocols allow multiple concurrent requests/ responses tobe multiplexed over a connection, so Active may be less than the sumof Waiting, Reading, and Writing. (As of this writing, NGINX does notsupport HTTP/2, but expects to add support during 2015.METRIC DIFFERENCES BETWEEN OPEN-SOURCEAND PLUSNGINX (OPEN-SOURCE)NGINX PLUSacceptsaccepteddropped must be calculateddropped is reported directlywithin NGINX Plus, but Plus can also report additional metrics. Thisreading writingcurrentsection covers the metrics that are only available from NGINX Plus.waitingidleactive (includes “waiting” states)active (excludes “idle” states)requeststotalNGINX PLUSAs mentioned above, all of open-source NGINX’s metrics are availableMETRIC TO ALERT ON: DROPPED CONNECTIONSThe number of connections that have been dropped is equalto the difference between accepts and handled (NGINX) or isFigure 2: NGINX Plus Client Connection LifecycleDZONE.COM DZONE, INC.exposed directly as a standard metric (NGINX Plus). Under normalVISIT DZONE.COM/REFCARDZ FOR MORE!
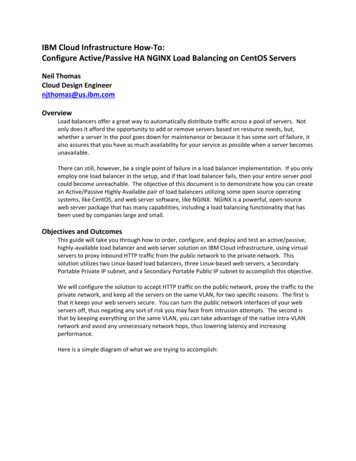
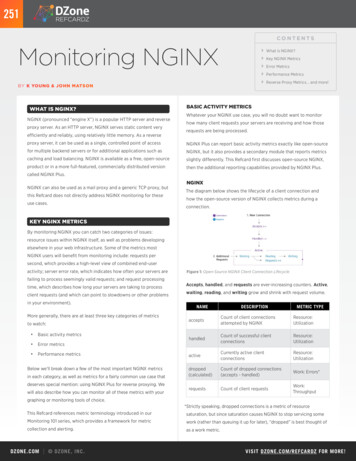
3MONITORING NGINXcircumstances, dropped connections should be zero. If your rate ofMETRIC TO ALERT ON: SERVER RATE ERRORdropped connections per unit time starts to rise, look for possibleYour server error rate is equal to the number of 5xx errors divided byresource saturation.the total number of status codes (1xx, 2xx, 3xx, 4xx, 5xx), per unit oftime (often one to five minutes). If your error rate starts to climb overtime, you may need to investigate the source of the error. If it spikessuddenly, urgent action may be required, as clients are likely to reporterrors to the end user.Figure 3: NGINX Dropped Connections Per SecondMETRIC TO ALERT ON: REQUESTS PER SECONDSampling your request data (requests in open-source, or total inPlus) with a fixed time interval provides you with the number ofrequests you’re receiving per unit of time—often minutes or seconds.Monitoring this metric can alert you to spikes in incoming web traffic,Figure 5: NGINX Server Error Rate Metricswhether legitimate or nefarious, or sudden drops, which are usually5xx (server error) codes are a valuable metric to monitor, particularly asindicative of problems. A drastica share of total response codes. NGINX Plus allows you to easily extractchange in requests per second can alert you to problems brewingsomewhere in your environment, even if it cannot tell you exactlythe number of 5xx codes per upstream server, as well as the totalnumber of responses, to determine that particular server’s error rate.where those problems lie. Note that all requests are counted theA note on client errors: while it is tempting to monitor 4xx, there issame, regardless of their URLs.limited information you can derive from that metric since it measuresclient behavior without offering any insight into particular URLs.In other words, a change in 4xx could be noise, e.g. web scannersblindly looking for vulnerabilities.COLLECTING ERROR METRICSAlthough open-source NGINX does not make error rates immediatelyavailable for monitoring, there are at least two ways to capture thatFigure 4: NGINX Requests Per Secondinformation: COLLECTING ACTIVITY METRICSOpen-source NGINX exposes these basic server metrics on asimple status page. Because the status information is displayed ina standardized form, virtually any graphing or monitoring tool canUse the expanded status module available with commerciallysupported NGINX Plus. Configure NGINX’s log module to write response codes inaccess logs.be configured to parse the relevant data for analysis, visualization,or alerting. NGINX Plus provides a JSON feed with much richer data.A later section of this Refcard will discuss how to enable NGINXPERFORMANCE METRICSNAMEmetrics collection.requesttimeERROR METRICSNGINX error metrics tell you how often your servers are returningDESCRIPTIONTime to process eachrequest, in secondsMETRIC TYPEAVAILABILITYWork:PerformanceNGINX logserrors instead of producing useful work. Client errors are representedMETRIC TO ALERT ON: REQUEST PROCESSING TIMEby 4xx status codes, server errors with 5xx status codes.The request time metric logged by NGINX records the processingtime for each request, from the reading of the first client bytesNAME4xx codesDESCRIPTIONMETRIC TYPEAVAILABILITYCount of client errorsWork:ErrorsNGINX logs,NGINX PlusCount of server errorsWork:ErrorsNGINX logs,NGINX Plusto fulfilling the request. Long response times can point toproblems upstream.COLLECTING PROCESSING TIME METRICS5xx codesDZONE.COM DZONE, INC.NGINX and NGINX Plus users can capture data on processing time byadding the request time variable to the access log format.
4REVERSE PROXY METRICSHOW TO COLLECT NGINX METRICSOne of the most common ways to use NGINX is as a reverse proxy.The commercially-supported NGINX Plus exposes a large number ofmetrics about backend (or “upstream”) servers, which are relevantto a reverse proxy setup. This section highlights a few of the keyupstream metrics that are available to users of NGINX Plus.NAMEDESCRIPTIONMONITORING NGINXMETRICTYPEAVAILABILITYActive connections byupstream serverCurrentlyactive clientconnectionsResource:UtilizationNGINX Plus5xx codes by upstreamserverServer errorsWork: ErrorsNGINX PlusAvailable servers perupstream groupServers passinghealth checksResource:AvailabilityNGINX PlusNGINX Plus segments its upstream metrics first by group, andthen by individual server. So if, for example, your reverse proxy isdistributing requests to five upstream web servers, you can see at aglance whether any of those individual servers is overburdened, andalso whether you have enough healthy servers in the upstream groupto ensure good response times.How you go about capturing metrics depends on which version ofNGINX you are using, as well as which metrics you wish to access. Free,open-source NGINX and the commercial product NGINX Plus both havestatus modules that report metrics, and NGINX can also be configuredto report certain metrics in its logs:AVAILABILITYMETRICSNGINX(OPEN-SOURCE)NGINX PLUSaccepts / accepted handled dropped active requests / total NGINX LOGS4xx codes 5xx codes request time METRICS COLLECTION: NGINX (OPEN-SOURCE)Open-source NGINX exposes several basic metrics about serveractivity on a simple status page, provided that you have the HTTPstub status module enabled. To check if the module is alreadyACTIVITY METRICSenabled, run:The number of active connections per upstream server can helpyou verify that your reverse proxy is properly distributing worknginx -V 2 &1 grep -o with-http stub status moduleacross your server group. If you are using NGINX as a load balancer,significant deviations in the number of connections handled byThe status module is enabled if you see with-http stub statusany one server can indicate that the server is struggling to processmodule as output in the terminal.requests in a timely manner or that the load-balancing method (e.g.round-robin or IP hashing) you have configured is not optimal foryour traffic patterns.AVAILABILITY METRICSFor another view of the health of your web servers, NGINX also makesit simple to monitor the health of your upstream groups via the totalIf that command returns no output, you will need to enable thestatus module. You can use the --with-http stub status moduleconfiguration parameter when building NGINX from source:configure \.\--with-http stub status modulemakesudo make installnumber of servers currently available within each group. In a largereverse proxy setup, you may not care very much about the currentAfter verifying the module is enabled or enabling it yourself, you willstate of any one server, just as long as your pool of available serversalso need to modify your NGINX configuration to set up a locallyis capable of handling the load. But monitoring the total number ofaccessible URL (e.g. /nginx status) for the status page:servers that are up within each upstream group can provide a veryhigh-level view of the aggregate health of your web servers.UPSTREAM METRICSNGINX Plus upstream metrics are exposed on the internal NGINX Plusver {location /atus {stub status on;access log off;allow 127.0.0.1;deny all;}monitoring dashboard, and are also available via a JSON interface thatcan serve up metrics into virtually any external monitoring platform.Note: The server blocks of the NGINX config are usually found notSee examples in the next section on collecting NGINX metrics.in the master configuration file (e.g., /etc/nginx/nginx.conf) but inDZONE.COM DZONE, INC.
5MONITORING NGINXsupplemental configuration files that are referenced by the mastermetrics collected via the open-source NGINX stub status module. Inconfig. To find the relevant configuration files, first locate the masterNGINX Plus metrics, Active connections do not include connections inconfig by running:the Waiting state (aka Idle connections).nginx -tOpen the master configuration file listed, and look for lines beginningwith “include” near the end of the http block, such as:include /etc/nginx/conf.d/*.conf;In one of the referenced config files you should find the main serverblock, which you can modify as above to configure NGINX metricsreporting. After changing any configurations, reload the configs byexecuting:NGINX Plus also reports metrics in JSON format for easy integrationwith other monitoring systems. With NGINX Plus, you can see themetrics and health status for a given upstream grouping of servers,or drill down to get a count of just the response codes from a singleserver in that upstream:nginx -V 2 &1 grep -o with-http stub status moduleTo enable the NGINX Plus metrics dashboard, you can add a statusserver block inside the http block of your NGINX configuration. (Seethe section above on collecting metrics from open-source NGINX fornginx -s reloadinstructions on locating the relevant config files.) For example, toset up a status dashboard at your.ip. address:8080/status.html andNow you can view the status page to see your metrics:Active connections: 24server accepts handled requests1156958 1156958 4491319Reading: 0 Writing: 18 Waiting : 6Note that if you are trying to access the status page from a remotemachine, you will need to whitelist the remote machine’s IP addressa JSON interface at your.ip. address:8080/status, you would add thefollowing server block:server {listen 8080;root /usr/share/nginx/html;location /status {status;}location /status.html {}in your status configuration, just as 127.0.0.1 is whitelisted in theconfiguration snippet above.The NGINX status page is an easy way to get a quick snapshot of yourmetrics, but for continuous monitoring you will need to automaticallyrecord that data at regular intervals. Parsers for the NGINX statuspage already exist for monitoring tools such as Nagios and Datadog,as well as for the statistics collection daemoncollectD.METRICS COLLECTION: NGINX PLUSNGINX Plus provides many more metrics through its ngx httpstatus module than are available in open-source NGINX. Among theadditional metrics exposed by NGINX Plus are bytes streamed, aswell as information about upstream systems and caches. NGINX Plusalso reports counts of all HTTP status code types (1xx, 2xx, 3xx, 4xx,5xx). A sample NGINX Plus status board is available here.The status pages should be live once you reload your NGINXconfiguration:nginx -s reloadThe official NGINX Plus docs have more details on how to configure theexpanded status module.METRICS COLLECTION: NGINX LOGSNGINX’s log module writes configurable access logs to a destination ofyour choosing. You can customize the format of your logs and the datathey contain by adding or subtracting variables. The simplest way tocapture detailed logs is to add the following line in the server block ofyour config file (see the section on collecting metrics from open-sourceNGINX for instructions on locating your config files):access log logs/host.access.log combined;After changing any NGINX configurations, reload the configs byexecuting:nginx -s reloadThe “combined” log format, included by default, captures a numberFigure 6: NGINX Plus Metrics Collectionof key data points, such as the actual HTTP request and thecorresponding response code. In the example logs below, NGINXNote: the Active connections on the NGINX Plus status dashboard arelogged a 200 (success) status code for a request for /index. html anddefined slightly differently than the Active state connections in thea 404 (not found) error for the nonexistent /fail.DZONE.COM DZONE, INC.
6127.0.0.1 - - [19/Feb/2015:12:10:46 -0500] “GET /index.html HTTP/1.1” 200 612 “-” “Mozilla/5.0 (Macintosh; IntelMac OS X 10 10 1) AppleWebKit/537.36 (KHTML, like Gecko)Chrome/40.0.2214.111 Safari 537.36”7.0.0.1 - - [19/Feb/2015:12:11:05 -0500] “GET /fail HTTP/1.1”404 570 “-” “Mozilla/5.0 (Macintosh; Intel Mac OS X 10 10 1)AppleWebKit/537.36 (KHTML, like Gecko) Chrome/40.0.2214.111Safari/537.36”You can log request processing time as well by adding a new logformat to thehttp block of your NGINX config file:log format nginx ‘ remote addr - remote user [ time local] ‘‘” request” status body bytes sent request time ‘‘” http referer” “ http user agent”’;And by adding or modifying the access log line in the server block ofyour config file:MONITORING NGINXthem to any number of log-analytics services; you can use a free,open-source tool such as logstash to collect and analyze logs; or youcan use a unified logging layer such as Fluentd to collect and parseyour NGINX logs.HOW TO COLLECT NGINX METRICSWhich NGINX metrics you monitor will depend on the tools availableto you, and whether the insight provided by a given metric justifiesthe overhead of monitoring that metric. For instance, measuringerror rates may be important enough to your organization to justifyinvesting in NGINX Plus or implementing a system to captureand analyze logs. Eventually you will recognize additional, morespecialized metrics that are particularly relevant to your owninfrastructure and use cases. Of course, what you monitor willaccess log logs/host.access.log nginx;depend on the tools you have and the metrics available to you.After reloading the updated configs (by running nginx -s reload),HOW TO COLLECT NGINX METRICSyour access logs will include response times, as seen below. The unitsare seconds, with millisecond resolution. In this instance, the serverreceived a request for /big.pdf, returning a 206 (success) status codeafter sending 33973115 bytes. Processing the request took 0.202seconds (202 milliseconds):127.0.0.1 - - [19/Feb/2015:15:50:36 -0500] “GET /big.pdfHTTP/1.1” 206 33973115 0.202 “-” “Mozilla/5.0 (Macintosh;Intel Mac OS X 10 10 1) AppleWebKit/537.36 (KHTML, like Gecko)Chrome/40.0.2214.111 Safari/537.36”NGINX: nginx.orgNGINX Documentation: nginx.org/en/docsNGINX Plus: nginx.comNGINX Plus Live ngHow to Monitor NGINX with Datadog:You can use a variety of tools and services to parse and -datadogNGINX logs. For instance, rsyslog can monitor your logs and passA B O U T T H E AU T H O R SK YOUNG is Director of StrategicInitiatives at Datadog. He has morethan a decade of experience leadingteams developing software to runat scale.DZone communities deliver over 6 million pages each month to more than 3.3 millionsoftware developers, architects and decision makers. DZone offers something foreveryone, including news, tutorials, cheat sheets, research guides, feature articles,source code and more."DZone is a developer's dream," says PC Magazine.Copyright 2017 DZone, Inc. All rights reserved. No part of this publication may be reproduced, stored in a retrievalsystem, or transmitted, in any form or by means electronic, mechanical, photocopying, or otherwise, without priorwritten permission of the publisher.JOHN MATSON is the ContentDeveloper at Datadog, where he writesabout monitoring, metrics, and makingsense of complex infrastructures. In apast life, John was a staff writer andeditor at Scientific American magazine.DZONE, INC.150 PRESTON EXECUTIVE DR.CARY, NC 27513888.678.0399919.678.0300REFCARDZ UNITIESsales@dzone.com
WHAT IS NGINX? NGINX (pronounced "engine X") is a popular HTTP server and reverse proxy server. As an HTTP server, NGINX serves static content very efficiently and reliably, using relatively little memory. As a reverse proxy server, it can be used as a single, controlled point of access