Transcription
Agricultural Engineering Research ArticleDOI: http://dx.doi.org/10.1590/1678-992X-2016-0152ISSN 1678-992XA smartphone-based apple yield estimation application using imagingfeatures and the ANN method in mature periodJianping Qian1*, Bin Xing1, Xiaoming Wu1, Meixiang Chen1, Yan’an Wang21ABSTRACT: Apple yield estimation using a smartphone with image processing technology of-Technology in Agriculture, Shuguang Huayuan Middle Road,fers advantages such as low cost, quick access and simple operation. This article proposes a11 – 100097 – Beijing – China.distribution framework consisting of the acquisition of fruit tree images, yield prediction in smart-National Engineering Research Center for Information2Shandong Agricultural University/College of Life Science –phone client, data processing and model calculation in server client for estimating the potentialState Key Lab. of Crop Biology – 271018 – Tai’an – China.fruit yield. An image processing method was designed including the core steps of image seg-*Corresponding author qianjp@nercita.org.cn mentation with R/B value combined with V value and circle-fitting using curvature analysis. Thismethod enabled four parameters to be obtained, namely, total identified pixel area (TP), fittingEdited by: Paulo Cesar Sentelhascircle amount (FC), average radius of the fitting circle (RC) and small polygon pixel area (SP). Anindividual tree yield estimation model on an ANN (Artificial Neural Network) was developed withReceived April 17, 2016three layers, four input parameters, 14 hidden neurons, and one output parameter. The systemAccepted April 29, 2017was used on an experimental Fuji apple (Malus domestica Borkh. cv. Red Fuji) orchard. Twenty-sixtree samples were selected from a total of 80 trees according to the multiples of the numberthree for the establishment model, whereby 21 groups of data were trained and 5 groups ofdata were validated. The R2 value for the training datasets was 0.996 and the relative root meansquared error (RRMSE) value 0.063. The RRMSE value for the validation dataset was 0.284.Furthermore, a yield map with 80 apple trees was generated, and the space distribution ofthe yield was identified. It provided appreciable decision support for site-specific management.Keywords: potential yield prediction model, image processing, mobile phone application development, orchard precision managementIntroductionMajor fluctuations in apple yield from year to yearand from orchard to orchard have not only seriouslydamaged the interests of farmers but have also affectedthe balance between supply and demand (Devetter etal., 2015). Thus, apple yield estimation with an emphasis on tree variability is a crucial step in precision orchard management and a pre-requisite for all partnersin the food chain (Stajnko et al., 2009).With the development of spectroscopic analysisand image sensing technology, research on estimatingsite-specific fruit yield has become a new research trend(Okamotoa and Won, 2009; Zude et al., 2008). The potential of the narrow-band TBVI (two-band vegetationindex) derived from airborne hyperspectral imagery topredict citrus fruit yield was examined in Japan (Ye et al.,2008). The microwave backscatter response of pecan treecanopy samples to estimate pecan yield in situ using terrestrial radar was studied (James et al., 2013). Comparedto spectroscopic and remote sense analysis, machine vision and image processing have the advantage of low costand easy operation (Wachs et al., 2010). They have beenwidely applied in yield estimation of fruit such as apple(Aggelopoulou et al., 2011; Zhou et al., 2012; Qian et al.,2012b), citrus (Gong et al., 2013), blueberry (Swain et al.,2010), and mango (Payne et al., 2013).In China, most orchards are managed by farmers with small production areas. Providing a simple andconvenient mode for real-time and on-scene estimationSci. Agric. v.75, n.4, p.273-280, July/August 2018is also important to orchard workers even if the precision is not very high. With the development of mobilecommunication technology, portable devices (smartphone, tablet) have become effective tools for collecting information. (Qian et al., 2012b; Gong et al., 2013;So-In et al., 2014). In order to improve model processingcapacity and enhance the yield information display, anew framework was designed: 1) the fruit tree canopyimages and the tree ID were synchronously acquiredwith a smartphone; 2) the image processing and modelconstructing following the ANN (Artificial Neural Network) method were carried out in the server client, and3) the estimation result and yield map were shown inthe smartphone. Based on this framework, an application on the Android platform was run and tested in anapple orchard.Materials and MethodsApplication framework designThe first step in a yield estimation exercise for anindividual tree was the selection of a single fruit treefor analysis using a recognized identification methoddescribed in the literature (Qian et al., 2015) which requires a tree label card with a QR code to be hung onthe tree. The QR code, which included the tree ID andtree position, could then be recorded and extracted ona smartphone.As Figure 1 shows, the application framework consisted of the data necessary for acquiring and displaying
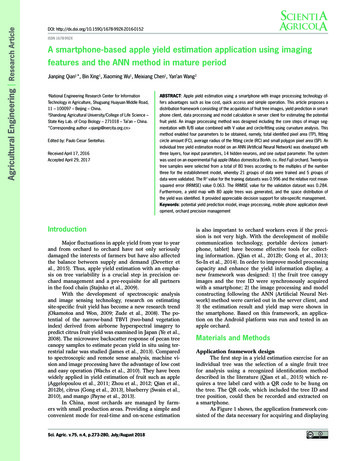
Qian et al.Apple yield estimation with smartphoneparameters and the individual tree yield as the outputparameter. A fruit tree estimation model was then established following the ANN method. An estimation resultwas given.Step 7: Sending the yield information to the phone.Figure 1 – Application framework of a smartphone-based applepotential yield estimation combing smartphone client and serverclient with 8 main steps.information in the smartphone client and data processing in the server client comprising eight main steps.Step 1: Scanning the QR code in the tree label and extracting tree ID. The QR code on the tree label card wascaptured with the smartphone camera. Through imagepreprocessing and barcode decoding, the tree ID storedin the QR code was extracted and recorded.Step 2: Acquiring the canopy images from two sides. Because of overlapping, it was necessary to capture imagesfrom both sides of the fruit tree in question. The wholecanopy for the object tree needed to be covered as muchas possible and other trees needed to be eliminated. Thetwo images for this one single tree were stored in thesmartphone and related to the tree ID.Step 3: Processing the images preliminarily in thesmartphone client. With the aim of saving data throughput and reducing calculation pressure in the server client, preliminary image segmentation was implementedin the smartphone client.Step 4: Uploading the tree ID and related images afterpreprocessing in the server client.Step 5: Identifying the amount of objects in the images. Total identified pixel area (TP), fitting circle amount(FC), average radius of the fitting circle (RC) and smallpolygon pixel area (SP) were deployed as input parameters to establish a yield estimation model. TP showedthe overall yield trend for different trees. FC and RCrepresented the amount and size of no and less overlapping fruit, which can be curved with the circle-fittingmethod. The two parameters had a direct relationshipwith fruit yield. SP represented the amount of small andunfitted polygons due to serious overlapping. In thisstep, these parameters need to be extracted. TP and SPcan be directly calculated by the Matlab software program. FC and RC were also calculated by the Matlabsoftware program after circle-fitting.Step 6: Estimating the fruit tree yield by the ANN method. Four extracted image features were used as inputSci. Agric. v.75, n.4, p.273-280, July/August 2018Step 8: Displaying the fruit tree yield followed byanalysis. Yield value was recorded and displayed in thephone. Drawing on the many tree yield values for thewhole orchard, a yield map can be drafted.Preliminary image segmentation in phone clientFuji apples show deeper red and reduced greencolors during the harvest period, and the R/B (R and Bis the value of RGB color space) value can be seen asan important segmentation parameter (Raphael et al.,2012). Qian et al. (2012a) used line profile analysis technology and combined the R/B and V values for segmentation whereby the apples and the background had agood result. Using the thresholds, the objects and background were segmented preliminarily.Singe apple recognition with circle-fitting methodThe common phenomena of apple separation andoverlap, which occur naturally, strongly affected theapple identification rate. As the identified apple contour was considered a circle (approximately), circle fitting could be used to discriminate the separated applesand the overlapped apples based on curvature analysis(Xiang et al., 2012). Curvature k can be represented asfollows: 1 y y1 1 y3 y2 θ1 tan 2 ,θ 2 tan x2 x1 x3 x2 θθ 21 k S In the formula, (xi, yi) was the coordinate of thesampling point. θi the tangent angle, and ΔS the curvelength of two consecutive sampling points. Figure 2shows the flow determination for single apple recognition.Apple yield estimation model established using theANN methodIn this study, a back propagation algorithm wasused to train the neural network. A three-layer networkarchitecture, consisting of one input layer, one hiddenlayer and one output layer, was established. There werefour variables for the input layer including TP, FC, RCand SP. The hidden layer contained 14 neurons. As onlythe fruit estimation yield was used as the target in thenetwork, the output layer contained one neuron only.From input layer to hidden layer, Tan-Sigmoid TransferFunction (tansig) was used. From hidden layer to outerlayer, Linear Transfer Function (purelin) was used. TheANN structure is described in Figure 3.274
Qian et al.Apple yield estimation with smartphoneThe coefficient of determination (R2) and relativeroot-mean-square error (RRMSE) were used to evaluateyield estimation model. The RRMSE was calculated asRRMSE 1NN Y ( i ) ′ Y ( i ) 2i 11NN Y ( i ) Y 2i 1where N is the number of data samples; Y(i) the actualyield ith value (kg); Y the average of the actual values,and ‘Y(i) the predicted yield ith value. If the R2 value ishigher and the RRMSE value lower, the model performsbetter.System developmentMobile application in smartphone clientMobile application was developed on an Android platform using the Java language. The followingprocedures were performed by the application (Figure4A). During the collecting of data, training data werediscriminated from testing data.Image acquiring: Using the camera in the phone,QR code image and canopy images from two sides wereacquired. Fruit tree ID was extracted and stored withthe related canopy images (Figure 4B).Image preliminary processing: A default segmentation threshold value of R/B and V was set in the application. The user can also adjust the value accordingto the actual condition. The threshold value enabled theoriginal canopy images to be processed.Actual yield collecting: At the time the model wasestablished, individual actual yield had to be collectedfor comparing with the estimation yield to test the model’s precision. The actual yield was recorded with thetree ID.Data uploading: The preliminary processing images were uploaded to the server client with the tree ID.Individual tree yield showing: When the serverclient returned the yield estimation result, the information including tree ID and estimation yield was shownin the phone interface (Figure 4C).Orchard yield mapping: When many tree yieldswere estimated, a yield map can be drafted. In the map,the yield difference can be described with different colors. The user can directly know the yield distribution indifferent positions.Data processing in server clientThe processing program was developed on the Microsoft.NET platform using the Matlab V7.0 interface.Data processing was automatically implemented, whenthe program received data from the mobile client according to different data type of training data or testingdata. The following procedures were carried out in theprogram:Figure 2 – Singe apple recognition determination with circle-fittingmethod processing.Figure 3 – Structure of Artificial Neural Network with four inputvariables and one output variable for implementing apple yieldestimation model.Sci. Agric. v.75, n.4, p.273-280, July/August 2018Extracting the image features: TP and SP can be directly calculated by the interface provided by the Matlab software program. FC and RC were calculated aftercircle-fitting. For the single tree analyzed, TP, FC, RC,SP of both sides were added as input parameters forthe estimation model. Values for the default parameterFigure 4 – Interfaces of information acquiring and displayingapplication on smartphone platform (A for main menu; B for imageacquiring; C for individual tree yield).275
Qian et al.Apple yield estimation with smartphonefor the circle-fitting were set in the application. Theuser can also adjust the value according to the actualcondition.developed yield estimation application. At the end of theharvest, yield data on individual apple trees were automatically counted.Establishing the potential yield model: In the training set, the yield estimation model was constructedbased on the four input parameters extracted, the actualyield and the ANN method adopted. The individual treeyield predicted was calculated as an output parameterand the estimation precision was given by a comparisonof the actual and predicted yields.ResultsEstimating the individual tree yield: Using the model the individual tree yield could be predicted.Calibrating the model: In order to increase the modelpracticability in a different apple orchard, the calibration was configured. With this function, the images oftwo sides and the actual yield of the single tree werecollected and dealt with as a training set.Test in orchardStudy areaThe test was conducted in Feicheng city inShandong Province, China. The orchard is located at36 13’47.41” North and 116 50’36.70” East and its altitude is 141 m. A total of 80 Fuji apple trees were plantedin the orchard, which had an area of 0.15 hm2. The fruittree row and column space were approximately 3.5 m 2 m. The orchard was planted in 2001, and had a highmanagement level with detailed production records. Theheight of the trees was 2.5-3 m and the trees remainedfree of serious disease during the study period.Fruit image feature extractionImage segmentationThe R/B value and the V value along the profileline were calculated. Figures 5A and B show a test imageof the line profile analysis. According to the original image with a white profile line (Figure 5A), the R/B valuesand V values were plotted in the pixel range from 0 to639 in Figure 5B. There were five R/B peak values inthe pixel range of 80-110, 135-220, 390-420, 425-486 and566-575 (Figure 5B). With the exception of the range of425-486, all the ranges listed above were not in the pixelrange of mature apples. Further analysis showed thatall four peak value ranges except for the 425-486 rangewere backlighting leaves and red trunk noise. These twotypes of objects with high red and low blue colors werethus easily identifiable as apples.The V value was introduced to exclude the background high R/B value caused by backlighting leavesand red trunks from the actual apple-related values because the V value is low in non-apple objects with highR/B value ranges. Thus, the V value can be used togetherwith the R/B value to exclude non-apple noise. In thiscase, the R/B value had five peak values, whereas the VData acquisitionApproximately one week before the fruit harvest,digital images were acquired from 10 to 11 Oct 2013.During this period, the fruit was red and mature, andthere were significant color differences in the fruits,leaves and trunks. The weather was sunny on thesetwo days. Using a mobile phone (HUAWEI G716, CPU:MSM8930 1.2GHz, Memory: 1GB RAM, Resolution: 8megapixels) with the developed Apple potential yieldestimation application, images from 80 fruit trees wereobtained between 10 a.m. and 3 p.m. from the southeastand northwest directions. The total image number of 80trees from two directions was thus 160.To maintain image conformity, the same focallength was maintained, and as much of the entire fruittree was included in the images as possible. The imageformat was JPG with a resolution of 1600 1200.Fruit yield on individual trees collectionActual yield data for the individual apple treeswere collected from 13 to 25 Oct 2013. In the harvestperiod, orchard harvest managers recorded the yielddata at each sampling time using a smartphone with theSci. Agric. v.75, n.4, p.273-280, July/August 2018Figure 5 – Line profile analysis on R/B and V value to obtain thesegmentation threshold of apples and background (A for an originalimage and B for profile line of R/B value and V value according tothe original image).276
Qian et al.value had only one peak in the range of 425-486, whichwas the actual apple range. With the application of thecombined R/B value and V value to segment the image,the identification error could be significantly reduced.Ten images were selected at random to obtain theR/B and V segmentation threshold. A profile line wasplotted in the middle of every image, and 10 lines passedthrough 54 apples. The R/B value and V value on thepoint of intersection of the profile line and apple edgewere analyzed. Generally, there were two intersectionpoints of an apple and a profile line, but because of apple separation and overlap phenomena, the number ofintersection points was 174 rather than 108. The averagevalues of the 174 points were calculated to be 1.375 forthe R/B value and 0.456 for the V value.Overlapping and separation processing by thecircle-fitting methodThe parameter values were confirmed based onthe reference of tomato curvature analysis in the literature (Xiang et al., 2012). Ten apple images were selectedfrom the 160 images acquired. The average radius valueof 45, maximum radius value of 65 and minimum radiusvalue of 30 were calculated. Compared with the tomatoparameter values in the literature, the absolute values ofradius value in this research were higher than the valuesin the research on tomato. This was most likely becausethe apple radius is greater and the curvature is smallerthan for tomatoes in the same range. The circle fittingresults were shown in Figures 6A and B.Apple yield estimation with smartphonecalling the “count” and “average” method in the serverclient after fitting circles. Four color features were obtained by processing. Table 1 shows the extraction resultfrom 21 fruit tree images for the training dataset and 5fruit tree images for the validation dataset.Yield estimationFrom the 80 apple trees, 26 trees were selected forestablishing the model at an interval of 3 trees with theascending tree ID. The data were divided into two parts.The first part was a training dataset comprising 21 appletrees, and the other five trees were used for validation.The validation dataset was selected at random from 26group data. In the training dataset, the actual yield of N 3 apple tree was the lowest, with a weight of 13.60 kg,and the yield of N 9 apple tree was the highest, with aweight of 71.92 kg. The average actual yield of trainingdataset was 40.36 kg and the validation dataset was 40.52kg. The standard deviations of the training dataset and thevalidation dataset were 14.76 kg and 9.30 kg, respectively.Back propagation neural network was used to establish a prediction model for fruit yield. Four image featureparameters comprised the input layer of TP, FC, RC andSP. The maximum training steps were set to 20,000 andTable 1 – Modeling data of 4 color features (total identified pixelarea (TP), fitting circle amount (FC), average radius of the fittingcircle (RC) and small polygon pixel area (SP)) and actual yield datafor 21 fruit trees to train and 5 fruit trees to validate.Data typeModel input variable extractionTP, FC, RC and SP as ANN input were used to establish the yield estimation model. TP was counted calling the “bwlabel” method provided by the Matlab V7.0interface. SP was counted using the “count” method provided by the software. FC and RC can be calculated byTrainingdatasetFigure 6 – Diagrammatic sketch of circle fitting with determinationthreshold values to discriminate the overlapped apples (A for twooriginal images and B for processing results after circle fitting).Sci. Agric. v.75, n.4, p.273-280, July/August 2018ValidationdatasetTree IDTPFCRCSPActual 4277
Qian et al.Apple yield estimation with smartphonethe training error was set to 0.001. The main procedureconsisted of two parts. Firstly, all of the data was normalized, and then the training dataset was used to computethe weights between different layers of neurons. Secondly,the fruit yield was predicted using the validation dataset.The yield prediction model was established usingdata from 21 groups. The comparison of predicted yieldand actual yield was shown in Figure 7 and Table 2. Theabsolute error between predicted yield and actual yieldwas small. The biggest absolute error value with 3.15 kgwas in apple tree N 63. The mean value and standarddeviation predicted were 40.35 kg and 14.55 kg, whichwas very close to the value of the actual yield. The R2value for the training datasets was 0.996 and RRMSEvalue was 0.063, which indicated the effectiveness ofthe neural network algorithm in apple potential yieldestimation for the training sets.Furthermore, the validation dataset comprisingfive data was used to test the established model. Thecomparison of the result of the actual and predictedyield is shown in Figure 8 and Table 2. For the N 27,Figure 7 – Results of linear regression between the actual yieldsand the predicted yields with training dataset.Table 2 – Prediction result from statistical analysis comparing estimated yield and actual yield. RRMSE relative root mean-squared error.Data typeTree IDActual yieldPredicted yieldAbsolute -------------------------------------------- kg -----------------------Training datasetValidation 70Mean (kg)40.3640.35Standard deviation n (kg)40.5241.84Standard Deviation (kg)9.309.22Sci. Agric. v.75, n.4, p.273-280, July/August 20180.284278
Qian et al.66 and 75 trees, the predicted yield was lower thanthe actual yield. For the other two trees, the predictedyield was higher than the actual yield. The minimumdeviation value was 0.1 found in N 66 tree and themaximum was 4.54 in N 45. The mean value and thestandard deviation of the predicted yield was 41.84 kgand 9.22 kg, which was close to the value of the actualyield. The RRMSE of the validation set achieved 0.284.Although the value was higher than the training dataset,the result could be considered acceptable according tothe literature (Ye et al., 2008). In terms of training procedure and validation result, the model could be used forthe potential yield estimation.Yield mappingIn the orchard, images from 80 apple trees wereacquired and the yield for every fruit tree was estimatedusing the ANN potential yield estimation application inthe smartphone. A yield map can be generated in serverclient and displayed in the smartphone sending the picture over the 3G or 4G networks. From the yield map inFigure 9, the fruit yield according to the estimation result was highly variable ranging from 13.60 to 71.92 kg.Moreover, the space distribution with different yieldswas revealed, which provided appreciable decision support for site-specific management.DiscussionYield estimation precisionEstablishing field models using image processingtechnology with a digital image capture instrumentis a low cost method. Swain et al. (2010) presentedan automated yield monitoring system for wild blueberry fruit and a significant correlation between percentage blue pixels and actual fruit yield with R2 0.90observed.In this study, the R2 value for the training datasetswas 0.996. The yield evaluation precision improvementis due to two factors. To check for any possible differences not seen when obtaining the fruit image from oneside, this study took two images from the southeast andnorthwest directions for the single fruit tree. Therefore,the fruit images can be taken as required. On the otherhand, the overlapping situation of fruits on tree is veryserious. A circle fitting method using curvature analysiswas used to discriminate the separated apples from theoverlapped apples.Performance efficiencyInvestigation into estimating site-specific fruityield has become a new research trend assisted by information and communication technology. Zhao et al.(2013) assimilated remote sensing information with acrop model using an Ensemble Kalman Filter for maizeyield estimation. Herrero-Huerta et al. (2015) presentedvineyard yield estimation by automatic 3D bunch modelling in field conditions.Sci. Agric. v.75, n.4, p.273-280, July/August 2018Apple yield estimation with smartphoneFigure 8 – Comparison of the actual yields and the predicted yieldswith validation dataset.Figure 9 – Apple yield map of the 80 apple trees in the experimentalorchard using the ANN potential yield estimation application.Compared with the above-mentioned researchon remote sensing, optical spectrum, this study wasrendered convenient, economical and effective by theuse of a mobile phone. The operation is simple and thetime consumed short. Processing time was a major concern for the apple potential yield estimation applicationbased on image processing. Compared to a computer,the smartphone had limited hardware resources and aslow processing speed. In order to save CPU time andmemory, the image acquisition and result displayingprocedures were deployed in the smartphone and imageprocessing and model computation were arranged in theserver. A HUAWEI G716 smartphone with 1.2GHz CPUfrequency and 1G memory were used for testing theprocessing time. With the distribution mode of imagerecorded in the smartphone and the model computationin the server, the time for an individual fruit tree wasabout 4 s. In the model establishment and yield mappingperiod, time expended was more.ConclusionsThe wide application of mobile phones providesa convenient medium for real-time and in-situ management. This study demonstrates the potential for using asmartphone to predict individual tree yield in apple orchards. A distribution framework was designed consisting of acquiring and displaying information in the smartphone client and data processing in the server client.A yield estimation model was established with image features using the ANN method. Four input parameters of TP, FC, RC and SP were obtained after image279
Qian et al.segmentation and circle fitting. Individual tree yield asoutput parameter was estimated using the model anda smartphone-based application and server-based procedure were developed based on the yield estimationmodel using Matlab interfaces.The application was used in an experimental appleorchard. 21 group data were trained and 5 group datawere validated. The R2 value for the training datasetswas 0.996 and the RRMSE value 0.063. The RRMSEvalue for the validation dataset was 0.284. Furthermore,a yield map for 80 apple trees was generated. The spacedistribution of different yields was identified which provided appreciable decision support for site-specific management.Although this study has an acceptable estimation result, there is still room for improvement. Theimage recognition effects and ANN performance werethe main factors that influenced the accuracy of the estimates. In conclusion, there is a need for further studyon improving the fruit identification rate under differentillumination conditions. Meanwhile, the potential yieldestimation model in this study has not been used underany such conditions. It needs to be calibrated accordingto the actual situation.AcknowledgmentsThis work was funded by the National Key Technology R&D Program of China (N 2013BAD19B04) andthe Beijing Natural Science Foundation (N 4132027).ReferencesAggelopoulou, A.D.; Bochtis, D.; Fountas, S.; Swain, K.C.;Gemtos, T.A.; Nanos, G.D. 2011. Yield prediction in appleorchards based on image processing. Precision Agriculture 3:448-456.Devetter, L.; Colquhoun, J.; Zalapa, J.; Harbut, R. 2015.Yield estimation in commercial cranberry systems usingphysiological, environmental, and genetic variables. ScientiaHoriculturae 190: 83-93.Gong, A.; Yu, J.; He, Y.; Qiu, Z. 2013. Citrus yield estimationbased on images processed by an Android mobile phone.Biosystems Engineering 115: 162-170.Herrero-Huerta, M.; González-Aguilera, D.; Rodriguez-Gonzalvez,P.; Hernández-López, D. 2015. Vineyard yield estimation byautomatic 3D bunch modelling in field conditions. Computersand Electronics in Agriculture 110: 17-26.James, A.; Hardin, P.R.; Weckle
software program after circle-fitting. Step 6: Estimating the fruit tree yield by the ANN meth - od. Four extracted image features were used as input parameters and the individual tree yield as the output parameter. A fruit tree estimation model was then estab - lished following the ANN method. An estimation result was given.