Transcription
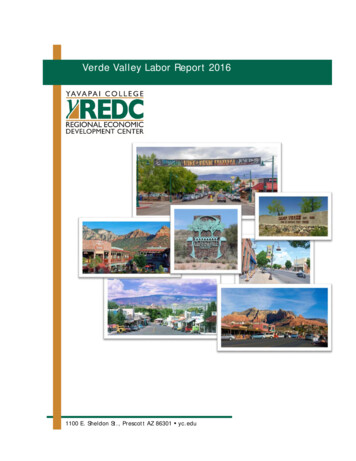
Verde Valley Labor Report 20161100 E. Sheldon St., Prescott AZ 86301 yc.edu
The Verde Valley region encompasses five municipalities including Cottonwood, Clarkdale, CampVerde, Jerome, Sedona and the neighboring Native American Tribe Yavapai-Apache Nation. Thelabor force is comprised of a variety of skill and education levels, from vocational fields toprofessional, technical, and scientific occupations.Yavapai county boasts three universities that each carry a unique focus, a robust communitycollege, and a joint-technical education district in the Verde Valley that produces vocational trainingfor high school students and prepares them to enter the workforce after high school. The laborforce in the area is a steady pipeline for entry-level to technical expert vocational careers andbeginning to advanced professional careers.Technical TrainingThe Valley Academy for Career and Technology Education (VACTE) isthe regional educational district that focuses on training high schoolstudents in technical fields throughout the Verde Valley. Students cangraduate from high schoolwith a variety of industrycertifications includingwelding, automotivetechnologies, nursing, cabinet production, businessoperations,digital photography, architectural draftingYAVAPAI COLLEGE GRADUATEDand culinary arts.1,565 STUDENTS IN MAY 2015 MANAGEMENT COMPUTER NETWORKINGTECHNICIAN CNC MACHING MEDICAL ASISSTANT INDUSTRIAL MACHINEMECHANIC ACCOUNTING NURSING CISCO NETWORKINGTECHNICIAN ELECTRONICS TECHNOLOGY ADMIN OFFICE SPECIALIST AGRICULTURE TECHNOLOGYMANAGEMENTYavapai College serves more than 15,000 students per year through its 62 certificate programs and32 Associates Degree programs. The college has 2 locations in the Verde Valley including the maincampus in Clarkdale and the Sedona Center for Arts and Technology. The Career & TechnicalEducation Center is 108,000 square feet dedicated to technical training in subjects such asmachining, welding, mill right, gunsmithing, diesel technology, industrial machine mechanics,1
electrical instrumentation, robotics, and electronics technology. The college offers several industrycertifications through the vocational program.The College also offers programming specific to the Verde Campus:Certificate Programs:Culinary Arts FundamentalsHotel and Restaurant ManagementMedia ProductionMedia Writing and ProducingViticultureAssociate Degree:AAS in Viticulture and EnologyYavapai College works closely with industry in the Verde Valley to ensure that curriculum is jobdriven and includes superior technology. The college’s Regional Economic Development Centerprovides on-site, contextual training for employers to fill entry level and mid-level labor needs.University SystemYavapai County has three universities that serve thelocal community. Embry-Riddle AeronauticalUniversity is a premier academic academy for aviationand engineering. The College of Aviation fuels youraviation passion by offering the nation’s mostcomprehensive academic programs for degrees inaviation and aerospace fields. The College ofEngineering focuses on hands-on learning andinterdisciplinary collaboration to ensure that ourgraduates are fully prepared to enter the industry.The College of Security & Intelligence boasts severalhigh-tech, high-demand programs, including the firstGlobal Security & Intelligence Studies program in thecountry. The College of Arts & Sciences offers awealth of learning opportunities to choose from, theCOAS truly puts the “universe” in the “universityexperience” at Prescott.Embry-Riddle Aeronautical University2014-2015 Graduates 339 Computer Engineering Electrical Engineering Mechanical Engineering Aeronautical Science Aerospace Engineering Aviation BusinessAdmin. Global Security & Intelligence AviationEnvironmental SciencePrescott College carries a unique emphasis on the liberal arts, the environment, and social justice.The institution offers a variety of Bachelor’s degree in Science and Fine Arts, Master’s programs inLiberal Arts, Education, and Science of Counseling, and Doctoral Programs in Education with anemphasis on Sustainability.NAU-Yavapai is an arm of Northern Arizona University located in Prescott Valley. The YavapaiCampus of Northern Arizona University provides students the opportunity to earn a respectedBachelor’s degree in just three years. These structured degree programs enable students to earn adegree in a high-demand field quickly and prepare to succeed in today’s workforce. Degreeprograms are offered in Service Industry Management, Applied Human Behavior, Community2
Development & Sustainability, and Entrepreneurship. There are 96 graduates in these programsprojected for FY 15-16.2015 DemographicsAge Cohort2015 Population2015 PercentUnder 20 years12,71318.6%20 to 39 years12,02717.6%40 to 59 years17,16625.1%60 to 79 years21,66331.6%4,9067.2%80 years and overIndustry & OccupationsPrimary sectors that have experienced job growth or are signaling the high potential for growth arehealthcare, micro-electronic and advanced manufacturing, food and accommodation services, andretail trade and wholesale trade. Professional, technical, and scientific occupations across all3
sectors have also experienced a steady growth over the past 5 years exhibiting a 21% growth ratein related occupations.This report includes traditional labor market information that are structural analytic sources tocapture broad economic factors occurring in a market, and real-time analytic sources to capture thechurn of talent demands in the marketplace. Traditional labor market information includesquantity of labor, wages, imports, exports, and changes over time in these variables. Real-timelabor market information consists of a mixture of qualitative and quantitative information includingjob postings, industry growth, industry roundtables, surveys, and interviews.Job Summary for Regional Industries21,766Jobs (2015)0% above National average8.9%% Change (2010-2015)Nation: 8.1% 37,755Avg. Earnings Per Job (2015)Nation: 59,897Table 1 Job Count and Wage CorrelationGroup2015 Jobs2016 JobsEarnings Per WorkerAccommodation and Food Services3,5773,642 21,502Retail Trade3,2673,313 30,2044
Group2015 Jobs2016 JobsEarnings Per WorkerHealth Care and Social Assistance2,7792,901 46,761Construction1,5411,450 35,212Other Services (except PublicAdministration)1,3231,345 21,770Manufacturing1,0901,122 53,178Administrative and Support andWaste Management andRemediation Services912882 27,153Professional, Scientific, andTechnical Services850867 41,557Real Estate and Rental and Leasing556545 33,844Transportation and Warehousing495488 47,273Educational Services435445 32,551Arts, Entertainment, and Recreation435438 18,408The education and workforce development system in the Verde Valley region cross-references indemand occupations with the fastest growing industries to create a ready labor force that fulfillsthe needs of local employers for all levels of occupations. Curriculum at the local educationalinstitutions is continually updated to include 21st century, job-driven content. Yavapai Collegeoffers customized training for new and existing employers to ensure that employees receiveaccessible, short-term training in the areas they need. Education and training in the region isstratified according to Career Pathways Systems, whereby entry level training in manufacturing,healthcare, and business and retail management is available through short-term training optionswhile also making movement up the educationalladder for degree programs accessible in all industryfields.5
Table 2 Compensation 13.59/hr 16.22/hr 19.47/hr25th Percentile EarningsMedian Earnings75th Percentile Earnings25th PercentileEarningsMedian Earnings75th PercentileEarningsManagement Occupations (110000) 22.32 28.99 39.10Business and FinancialOperations Occupations (130000) 19.63 24.23 30.02Computer and MathematicalOccupations (15-0000) 21.54 26.40 32.36Architecture and EngineeringOccupations (17-0000) 23.56 28.21 33.55Life, Physical, and Social ScienceOccupations (19-0000) 20.90 26.05 31.19Community and Social ServiceOccupations (21-0000) 15.96 19.94 24.64Legal Occupations (23-0000) 23.90 29.97 35.89Education, Training, and LibraryOccupations (25-0000) 14.46 16.96 19.88Arts, Design, Entertainment,Sports, and Media Occupations(27-0000) 13.22 15.02 17.69Healthcare Practitioners andTechnical Occupations (29-0000) 31.70 38.61 45.56Healthcare Support Occupations(31-0000) 12.10 13.85 15.82Occupation6
25th PercentileEarningsMedian Earnings75th PercentileEarningsProtective Service Occupations(33-0000) 18.51 22.18 26.45Food Preparation and ServingRelated Occupations (35-0000) 8.92 9.79 10.98Building and Grounds Cleaningand Maintenance Occupations(37-0000) 9.40 10.53 12.09Personal Care and ServiceOccupations (39-0000) 9.02 10.18 11.60Sales and Related Occupations(41-0000) 10.60 12.36 14.95Office and Administrative SupportOccupations (43-0000) 11.77 14.33 17.40Farming, Fishing, and ForestryOccupations (45-0000) 13.48 14.68 16.73Construction and ExtractionOccupations (47-0000) 14.31 16.77 19.77Installation, Maintenance, andRepair Occupations (49-0000) 14.34 17.39 20.68Production Occupations (510000) 12.96 15.36 18.44Transportation and MaterialMoving Occupations (53-0000) 11.58 14.05 17.13Military occupations (55-0000) 11.65 16.21 18.73Occupation7
Table 3 Fastest Growing IndustriesGroup2015 Jobs2016 JobsChange% 3%Educational Services43544592%Professional, Scientific, andTechnical Services850867172%Accommodation and FoodServices3,5773,642652%Other Services (exceptPublic Administration)1,3231,345222%Retail Trade3,2673,313461%Wholesale Trade34134651%Information23123321%Arts, Entertainment, andRecreation43543831%Mining, Quarrying, and Oiland Gas ExtractionHealth Care and SocialAssistanceCrop and Animal ProductionManufacturing8
Analysis of the most competitive industries and our local industry location quotients prioritizes thesectors in which the region has a competitive advantage based on the unique qualities of the regionand what sectors are emerging signaling a demand for job growth. Industry Mix Effect measureshow much growth was derived from growth in the industry sector over all. The National GrowthEffect measures how much growth was derived from overall growth in the national economy. TheCompetitive Effect for the region identifies if local factors assisted in the growth for that industrysector.The Verde Valley region displays a competitive effect for manufacturing, retail and wholesale trade,healthcare, information systems, food and accommodation, and crop and animal production.Table 4 Most Competitive IndustriesJob ChangeInd Mix EffectNat -164912258308834Retail Trade46-18361828Other Services (exceptPublic Administration)22-214129Crop and AnimalProduction4-2105Information2-53-24Mining, Quarrying, andOil and Gas Extraction62123GroupManufacturingHealth Care and SocialAssistance9
GroupWholesale TradeAccommodation andFood ServicesJob ChangeInd Mix EffectNat 52539642Table 5 Industry Location QuotientsThe location quotient gauges how much productivity is occurring in a region per industry sectorcompared to all regions nationally. Location Quotients (LQs) are ratios that allow an area'sdistribution of employment by industry to be compared to a reference or base area's distribution(in the case the U.S. as a whole). If an LQ is equal to 1, then the industry has the same share of itsarea employment as it does in the reference area. An LQ greater than 1 indicates an industry with agreater share of the local area employment than is the case in the reference area. A LQ greater than1 states that the region is producing more in that sector then other regions.10
Industry Roundtables, Job Fairs, and RecruitmentThe Yavapai College Regional Economic Development Center runs quarterly roundtables withprimary industry sectors targeted for growth; manufacturing, healthcare, retail and wholesaletrade, food/accommodation & retail, and agriculture. Results are shared with educational andtraining institutions throughout the region to create job-driven training.In conjunction with the Cottonwood Chamber ofCommerce, quarterly workforce roundtables are heldto gather input from industry on current and futurelabor needs.The YC REDC produces 3 annual jobs fairs, facilitates direct job placement forlocal employers, and assists with the set up and running of internships andregistered apprenticeships in the Verde Valley.11
Appendix A ParametersCodeDescription86322Camp Verde, AZ (in Yavapai county)86324Clarkdale, AZ (in Yavapai county)86325Cornville, AZ (in Yavapai county)86326Cottonwood, AZ (in Yavapai county)86331Jerome, AZ (in Yavapai county)86335Rimrock, AZ (in Yavapai county)86336Sedona, AZ (in Yavapai county)86340Sedona, AZ (in Yavapai county)86341Sedona, AZ (in Yavapai county)86342Lake Montezuma, AZ (in Yavapai county)86351Sedona, AZ (in Yavapai county)12
Appendix B SourcesLocation QuotientLocation quotient (LQ) is a way of quantifying how concentrated a particular industry, cluster,occupation, or demographic group is in a region as compared to the nation. It can reveal whatmakes a particular region unique in comparison to the national average.Occupation DataEMSI occupation employment data are based on final EMSI industry data and final EMSI staffingpatterns. Wage estimates are based on Occupational Employment Statistics (QCEW and Non-QCEWEmployees classes of worker) and the American Community Survey (Self-Employed and ExtendedProprietors). Occupational wage estimates also affected by county-level EMSI earnings by industry.Completers DataThe completers data in this report is taken directly from the national IPEDS database published bythe U.S. Department of Education's National Center for Education Statistics.Institution DataThe institution data in this report is taken directly from the national IPEDS database published bythe U.S. Department of Education's National Center for Education Statistics.Industry DataEMSI industry data have various sources depending on the class of worker. (1) For QCEWEmployees, EMSI primarily uses the QCEW (Quarterly Census of Employment and Wages), withsupplemental estimates from County Business Patterns and Current Employment Statistics. (2)Non-QCEW employees data are based on a number of sources including QCEW, CurrentEmployment Statistics, County Business Patterns, BEA State and Local Personal Income reports, theNational Industry-Occupation Employment Matrix (NIOEM), the American Community Survey, andRailroad Retirement Board statistics. (3) Self-Employed and Extended Proprietor classes of workerdata are primarily based on the American Community Survey, Nonemployer Statistics, and BEAState and Local Personal Income Reports. Projections for QCEW and Non-QCEW Employees areinformed by NIOEM and long-term industry projections published by individual states.Staffing Patterns DataThe staffing pattern data in this report are compiled from several sources using a specializedprocess. For QCEW and Non-QCEW Employees classes of worker, sources include OccupationalEmployment Statistics, the National Industry-Occupation Employment Matrix, and the AmericanCommunity Survey. For the Self-Employed and Extended Proprietors classes of worker, the primarysource is the American Community Survey, with a small amount of information from OccupationalEmployment Statistics.13
technologies, nursing, cabinet production, business operations, digital photography, architectural drafting and culinary arts. TECHNICIAN. Yavapai College serves more than 15,000 students per year through its 62 certificate programs and 32 Associates Degree programs. The college has 2 locations in the Verde Valley including the main


