Transcription
State of the U.S. Long-termCare Insurance IndustryNOLHGA Presentation to the NAICMarch 30, 2017
PresentersNOLHGAPeter Gallanis, PresidentBill O’Sullivan, General CounselPaul Peterson, Vice PresidentLong Term Care GroupVince Bodnar, Chief ActuaryFaegre Baker DanielsKevin Griffith, PartnerPat Hughes, Partner2
Overview LTC Background–Role of Private LTC Insurance–LTC 1.0: Traditional LTC Products–LTC 2.0: Hybrid Products–LTC 3.0: Push for InnovationSolvency Implications– Risk ExposureImplications for the GA System–Assessable Premium3
LTC Background:Role of Private LTC Insurance4
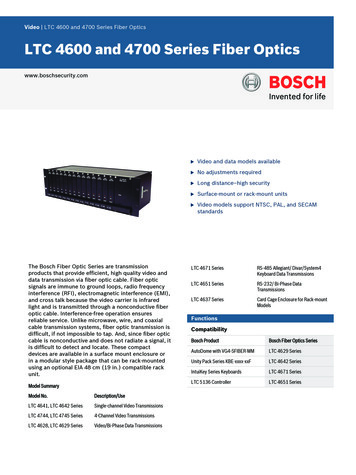
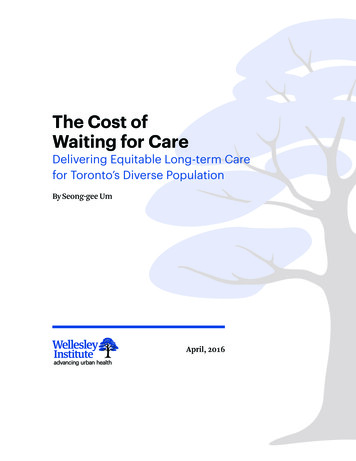
Funding of US LTC expenses 19b; 8% 16b; 6% 7b; 3% US spending on LTC was 246 billion in 2015 63% was funded by two social programs: 82b; 33% Medicare: Limited post-acute care Medicaid: Once assets are spent down20% from direct out of pocket spending Most represents asset spend-downOnly 3% from private LTC insurance 7 million insureds out of 89 million age 55 49b; 20% 73b; 30%MedicaidOut of PocketOther InsuranceMedicareLTC InsuranceOtherSource: National Health Expenditure (NHE) Amounts by Type of Expenditure and Source of Funds: Calendar Years 1965-2015,Centers for Medicare & Medicaid Services5
The need for private LTC insurance Asset spend-down most common funding scheme– Savings are first exhausted or moved via loopholes– Migration to public welfare (Medicaid) afterwards Strain on social program funding– Medicaid’s mission is to provide a safety net to the poor– Not meant to fund lack of LTC planning for the middle class Clear need for individual financial planning / private insurance– Demographics result in an unsustainable burden on public resources– Preserve assets / legacy funding– Higher quality of care when privately funded6
Consumer attitudes Biggest fears about retirement1:–––– 11% Will have too much debt18% Won’t be able to afford daily expenses23% Exhaust savings28% High medical (LTC) expensesPrivate financing of LTC is strongly preferred2– 59% agree that individuals should be responsible– 66% agree that owning private LTC insurance would give them peace of mind– 51% don’t trust the government to run an LTC insurance plan Knowledge of LTC costs and risks is relatively low2– Most greatly underestimate the chance of needing LTC– 20% can correctly estimate costs in their state– 44% have “other priorities” for money other than LTC insurance1Bankrate.com22014Money Pulse Survey, Feb. 18, 2015Survey of Long-Term Care Awareness and Planning, U.S. Dept. of HHS7
Unique distribution challengesChallenges: 177 carriers entered the LTCI market; 56 sold 10,000 policies; 74 sold 1,000 Extreme example of a product that is “sold not bought”– In spite of high initial consumer interest in LTC insurance– Lack of consumer awareness of level of risk and costs– Sticker shock of high premium rates Broad distribution channels do not push LTC products– Lack of understanding of product; discomfort selling– Already successful selling other productsResponse: The successful carriers utilized “LTC specialists” to sell their products– Agents that are trained to sell LTC almost exclusively– Small distribution pockets produced a majority of sales– Initial specialists were captive; independent specialists later emerged Specialists are trained to:– Patiently sit with customer leads – often several hours– Educate customers about risks and complex products– Have rational responses to premium amounts8
LTC Background:LTC 1.0: Traditional LTC Products9
Long-term care insurance 101 Relatively new product: modern version born in late 1980sPatterned after disability income plansMost have a defined benefit trigger: requires assistance with 2 out of 6 activitiesof daily living (“ADLs”) or requires supervision due to a severe cognitiveimpairmentOnce trigger is met: qualified services are covered up to a daily maximumbenefit– Usually care received in a nursing home, assisted living facility or by a qualified homehealth care professional– Some plans do not require expenses to be incurred Specified benefit and elimination periodsInflation protection option: e.g., daily benefit increases 5% each yearIssue age rated: premiums are intended to be level for life– Guaranteed renewable: insurer cannot cancel as long as required premiums are paid– Premium increases are by class and must be approved by regulators10
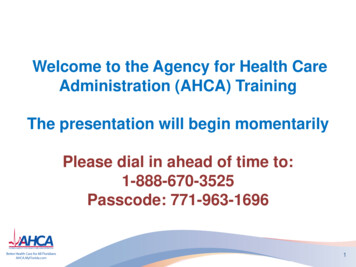
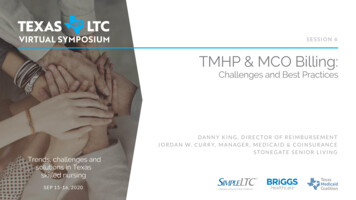
Level premium pre-funds an increasing cost Four forces contribute to increasing claim costs:––––Older people more likely to need long-term careWear-off of underwriting effectBenefits increase for policies with inflation protectionMarried people becoming widows and widowers (which have higher costs) 10,000 9,000 8,000 7,000 6,000 5,000 4,000 3,000 2,000 1,000 013579111315171921Year Since IssuePremium RateClaim Cost per Policy2325272911
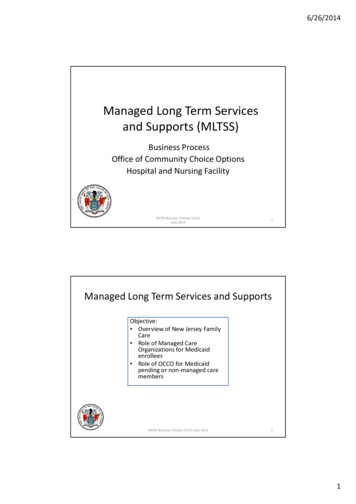
Cash flow patternLevel premium rates and increasing claims costs results in a cash flow mismatchCompanies must hold an active life reserve that builds and releases over time500450Reserves Build400350 Millions Reserves Release30025020015010050013579111315 17 19 21 23 25 27Years Since Product LaunchPremium293133353739Claims12
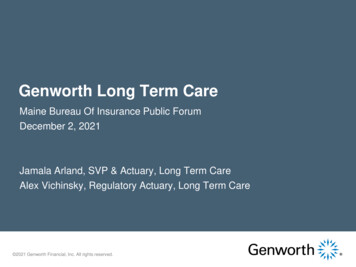
Sales volumes1,400New Annual Premium Issued1,200 Millions1,000800600400200098 99000102030405060708Calendar Year09101112131415Early success!: 20% growth during the 1990sShort-lived: Sales began to decline in 2001(after netting out 2002-2003 FEP enrollment)Source 1999 – 2015 Broker World Surveys13
Leading carriers then and now Compression: top 10 carriers went from 66% to 92% of sales7 of the 10 top carriers have since dropped out2015 Sales2001 SalesCompanyGE CapitalBankers L&CJohn HancockC.N.A.UNUMPenn TreatyAllianzIDSFortisLife InvestorsTop 10OthersTotalPremium 243M 83M 74M 61M 55M 47M 42M 28M 26M 26M 684M 349M orthwesternMutual of OmahaGenworth1Transamerica2John Hancock3New York LifeMassMutualThriventLifeSecureMedAmerica3Top 10OthersTotalPremium 62M 39M 33M 25M 22M 16M 11M 10M 10M 8M 236M 21M his a former division of GE Capitalsingle premium sales3 Companies stopped writing new LTC in 2015 or later2ExcludingSource 2002 and 2016 Broker World Surveys14
New policy pricing challenges Key factors driving the need for higher premium rates––––– Low interest rate environmentLapse rates are virtually zero in later yearsDecreasing mortality ratesCapital requirementsRegulatory requirements for conservative assumptionsCarrier exits– Less need to price competitively Product offerings becoming more limited– Unlimited benefits have essentially disappeared15
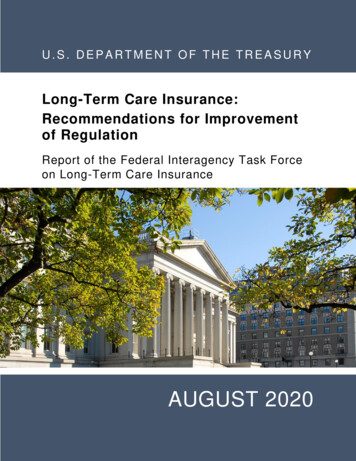
New premium rate trendsLTCI premiums have climbed above a middle income price point 6,000Average Market Premium - 3 Year Benefit Period with BIO 5,000 4,000 3,000 2,000 1,000 02002200320042005Issue Age 502006200720082009Issue Age 60201020112012201320142015Issue Age 70PA hearing consumer question: “Is LTCI only for the 1%?”Source: 2002-2015 Broker World Surveys16
MillionsA changing target market6050403020100Target market: Persons aged 55-6900 01020304Calendar Year0506070809Baby Boomers1011Others121314Target market’s generation turned over since the 1990s:– Issue age 72 in 1995: Born in 1923 (GI Generation)– Issue age 59 in 2015: Born in 1956 (Baby Boomer) New consumer attitudes:– Want immediate value, or ability to “cash out”– Less time for / patience with old distribution methods– Less interested in wealth transferSource: U.S. Census Bureau17
LTC Background:LTC 2.0: Hybrid Products18
Life insurance hybrids Often a rider that can be attached to any type of permanent life product Insured can accelerate all or a portion of face amount for LTC benefits Must meet eligibility requirements– Unable to perform 2 ADLs or cognitive impairment that requires supervision A small percentage (2%-4%) of face available per month until face exhausted Extension of benefits option: more than face is available for LTC– Two or three times face are most common options Feature is financed via an additional premium or account charge19
Annuity hybridsDeferred annuity hybrids: Immediate annuity hybrids:Account value (e.g., 50k) availablefor LTC benefits Base monthly annuity benefit (e.g., 2,000) starts immediately for life–Reduced or no surrender charge Additional LTC benefit (e.g., 100k)available after account value isexhaustedIncreases to a higher benefit (e.g., 4,000) while LTC eligibility is met Financed through additional singlepremium charged at issue Payment structure / eligibilityrequirements similar to lifeacceleration Financed through additionalpremium or account charge20
Hybrid product appealCustomers: Easy to understand: Access to apot of money (death benefit) Cost effective: Add-on premiumsare generally less than stand-alone Equity exists in base product’saccount valueCarriers: Mitigated risks––– Easy to distribute– Exposure limited to life policy netamount at riskInsured’s equity in base coverageacts like a “co-pay”Low mortality offsets life insurancerisk“Add-on” to the base policy sale;can be sold by broad distributionDecreased regulatory, reserve andcapital requirements21
Hybrid product salesHybrid products comprised15%of new life insurance premium issued in(up from 12% in 2014)200,000 policiesand 3.1b issued in 2015Compared to 104,000 policiesand 257m in the stand-aloneLTC market2015Carriers areentering thehybrid LTC marketas opposed tocontinued exits in thestand-alone LTC marketSources: LIMRA’s 2015 Individual LTC Sales and 2015 Life Combo Sales Surveys22
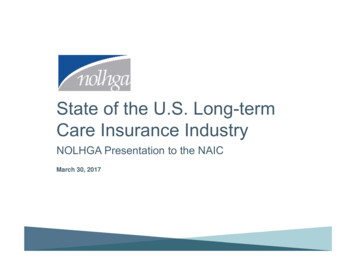
Shift to Hybrid Products (2nd Generation LTCI)3,500New Premium Sales3,000 Millions2,5002,000Traditional LTCHybrid LTC1,5001,000500000 010203040506070809Calendar Year101112131415Premiums for hybrid plans have overtaken traditional plans– Important to note that most hybrid premiums are single premiumsSources: 2001-2014 Broker World Surveys and LIMRA’s Individual Long-term Care and Life Combo Products Annual Reviews23
Looking forward Expect increased volume of hybrid sales via:Target market expansion– Historical focus on affluent market– Companies are expanding to middle market via worksite and direct marketingchannels Distribution and marketing shift– With some exception, hybrid sales are currently add-on options presented at the saleof life and annuity products– Specialty distribution, focused on hybrids as a primary LTC financing solution, willlikely emerge and greatly increase sales volumes24
LTC Background:LTC 3.0: Push for Innovation25
Emerging product concepts Given all of the challenges, the next generation of products must consider: Insurance carrier goals:– Need to better “box the risk” being insured– Mitigate or eliminate traditional risks, such as long-term incidence, mortality andinterest rates– Emerging risks of care delivery changes Consumer desires:– Remove the “use it or lose it” features– Allow flexibility when care is needed– Help reduce / control personal costs and risks26
Looking forward NAIC LTC Innovation Subgroup focused on three tasks:1.Advocate for federal tax policy changes to encourage private LTC financing2.Increase awareness of hybrids and other existing alternative products3.New section of the LTC model regulation to enable Savings Based LTC productsThird Generation of LTCI products is likely to emerge27
Alternative productsUsing existing insurance products to fund LTC in new ways Care Annuity (UK version of LTC insurance)–––– Underwritten SPIA issued to newly disabled personsHealth conditions result in higher monthly benefit payments than traditional SPIAsRemoves longevity risk for the annuitantLarge segment of 80 year-olds have enough assets to fund LTC in this mannerLife settlements– Assign death benefit from existing life policy– Greater value than cash value; can annuitize for life28
Savings Based LTCI Would require modifications to NAIC LTC ModelsShifts investment, lapse and future uncertainty risks to consumerResembles universal life, but with LTC as the insured event:– Cash / account values– Flexible premiums– Annual cost of insurance charges– Investment income credits– Modular coverage– Payout options at LTC event (e.g., annuitize)29
Possible public policy changes Public catastrophic coverage– Universal coverage after a long elimination period (2 or 3 years)– Private insurance can be purchased to provide earlier benefits Allow 401k to fund LTC / LTC insurance– Without tax penalties, up to a maximum amount per year Expand Medicare / Medigap to include more LTC– Auto-enrollment– Minor benefits are mandatory; buy-ups are voluntary– Benefit vesting as a substitute for underwriting30
Solvency Implications:Risk Exposure31
What went wrong with LTC 1.0? Low interest ratesLow lapse ratesIncreasing longevityEvolving care deliveryRegulatory uncertaintyCarrier exitsDistribution contractionWary consumers 8% became 3%5% became 1%5 to 10 year increaseEmergence of ALFsPolitical not actuarial100 to about 1045k became 2,000Smart buy to risky buy1 million policies sold in 2001 vs. 100k in 201632
Losses become difficult to overcome LTC premium base decreases while claim costs increaseRate increases needed to offset deviations grow dramatically over timeRegulators resist large rate increases ( 25%); require benefit reduction optionsOften impossible to offset losses completely, resulting in reserve correctionsSolvency risks increase in relation to company’s concentration of LTC 1.0 writingsCash Flows By Year Since Product Launch1611162126Rate Increase Required to Offset Future LossesDeviationYr. 5Yr. 10Yr. 15Yr. 20 10% Claims7%11%18%27%-1% Lapse10%16%24%34%-1% Interest8%14%20%27%All Three28%44%64%92%Year Since LaunchPremiumBenefits & Expenses33
Key items to watch Actuarial assumptions used in reserve models remain aggressive:–––– Will interest rates return to “normal”?Will mortality continue to improve?Will disability incidence rates improve?Will care delivery continue to evolve, making LTC less of a stigma?Financial metrics and ability to absorb an increase in LTC reserves (e.g. 20%)– Premium rate increases may be needed– Decrease in surplus if required premium rate increases cannot be achieved– Relationship between insurer’s LTC reserves and total reserves LTC spin-offs– Several carriers would like to follow CNO’s lead (spin-off SHIP)– Isolate LTC within a legal entity; sell off or reinsure other lines Diminishing LTC expertise within carriersSuitability of emerging acquirers34
Financial metrics of largest LTC carriersTop 25 LTC Carriers – Data as of 12/31/2015StillSelling?Company1Genworth Life Ins Co2John Hancock Life Ins Co Usa3Metropolitan Life Ins Co4Continental Cas Co5Unum Life Ins Co Of Amer6Thrivent Financial For Lutherans7Transamerica Life Ins Co8Prudential Ins Co Of Amer9Metlife Ins Co Usa10Riversource Life Ins Co11Allianz Life Ins Co Of N Amer12Bankers Life & Cas Co13Northwestern Long Term Care Ins Co214State Farm Mut Auto Ins Co15New York Life Ins Co16John Hancock Life & Hlth Ins Co17Senior Hlth Ins Co Of Pa18Genworth Life Ins Co Of Ny19Lincoln Benefit Life Co20Mutual Of Omaha Ins Co21Massachusetts Mut Life Ins Co22First Unum Life Ins Co23Kanawha Ins Co24Union Security Ins Co25Medamerica Ins CoTotal Top esYesNoNoNoNoPolicies000sLTCPrem. millionsLTCRsvs. millions1TotalLiabs. millionsSurplus 342834125,8861Policyreserves only. The inclusion of disabled life reserves would raise values considerably.LTC is reinsured to its parent company Northwestern Life.Source: 2015 NAIC Statutory Annual Statements2Northwestern35
Acquisition landscape: high interest; few deals Seller motivations:–––––– Buy-side dominated by private equity backed reinsurers–––– General industry trend to dispose of closed blocksLTC administrative activity increases with an aging blockSophisticated IT platforms requiredVery specialized product managementRisk of future reserve adjustmentsLTC viewed as an “earnings drag” by market analystsAttracted by amount of assets and ability to increase portfolio yieldsAdditional spread used as a mitigant of LTC volatilityMove administration to a place with scaleImplement best practice claims and inforce managementDifficult to find price points that both parties can agree with– Sellers reserve with optimistic future state assumptions– Buyers price with data-driven historical state assumptions36
Implications for the GA System37
NAIC Model GA Act Coverage Structure Three “Categories” of Policies Covered by GAs––– Each Coverage Category Has Different Coverage Levels––– Life InsuranceAnnuitiesHealth InsuranceLife Insurance: Death Benefits— 300,000; Net Cash Surrender Value— 100,000Annuities: Annuity Benefits— 250,000 of Present ValueHealth Insurance: Limits Depend on Type of Health Insurance Hospital, Medical, Surgical or Major Medical Insurance— 500,000 in Benefits Long Term Care and Disability Insurance— 300,000 in Benefits All Other Health Insurance— 100,000 in BenefitsOther Coverage Limits and Exclusions Must Also be Considered38
NAIC Model GA Act Assessment Structure Each Coverage Category Also Has a Different Assessment Account for AllocatingAssessments Among Member Insurers in the State––Life Insurance and Annuity Account with up to three Subaccounts Life Account Allocated Annuity Account Unallocated Annuity Account (If Unallocated Annuities are Covered in the State)Health Insurance Account The Financial Burden for GA Assessments to Meet a GA’s Coverage Obligations areAllocated among Member Insurers Based Predominately on Two Factors:––Category of the Policies Covered by GAPremiums in the Assessment Account Reported by Member Insurers in the State Over aThree Year Period: The ratio of (A) the premiums received by an assessed member insurer in the accountfor the three (3) most recent calendar years for which information is available precedingthe year the insurer was placed under an order of liquidation to (B) premiums in theaccount received during those same calendar years by all assessed member insurers39
NAIC Model GA Act—Application to LTC 1.0 LTC 1.0 Products Have (Without any Known Exception) Been Regulated underState Insurance Law as Health Insurance The GA System has Handled Three Prior Insolvencies of LTC 1.0 Issuers:–––American Integrity Insurance Company (1993)Life and Health Insurance Company of America (2004)National States Insurance Company (2010) Today the GA System is Handling the Insolvencies of Two Affiliated LTC 1.0Issuers: Penn Treaty Network America Insurance Company (“PTNA”) and itssubsidiary American Network Insurance Company (“ANIC”)––––Largest failure of LTC 1.0 Issuers to DateMany different benefit designs and optional benefit riders issuedPremium rate increases actuarially justified even at GA Coverage LevelsMajor Medical Premium Dominates Health Insurance Account40
NAIC Model GA Act—Application to LTC 1.0Issues Raised in PTNA and ANIC Major Medical Insurance Premium Dominance in Health Account– Allocates Significant Assessment Burden to Health Insurers that do not write LTC 1.0– Most Life Insurers and Annuity Issuers also do not have significant LTC 1.0 Policies Many providers of Major Medical Coverage are not GA Member Insurers andBear no Assessment Burden (e.g., HMOs, Health Service Corporations, SelfFunded Plans) Application or Not of the Moody’s Limit (Model GA Act 3B(2)(c)) to InflationBenefits Need for Premium Rate Increases and Alternative Benefit Options forPolicyholders Managing Liability Funding and GA Assessment Timing Approaches in Light ofthe Magnitude of the GA Covered Obligations41
NAIC Model GA Act—Application to LTC 2.0 How Should Hybrid LTC Benefits be Categorized?––Hybrid Benefits under Life InsuranceHybrid Benefits under Annuities Issue Impacts Both GA Coverage Levels and Responsible Assessment Account Are Clarifying Amendments Needed?42
GA System Health Account Capacity**Preliminary Information Responsive to NAIC Questions43
Estimated Current Health Account Capacity – 2015 * Total member companies – 1,131 # member companies with Health Account assessable premium - 842 Estimated Health Account assessable premium - 265,015,644,150(approximately 70.7% of gross Health Account premiums in licensed states) Estimated Health Account capacity – 5,201,867,362*Above amounts and counts include PR which is no longer a member ofNOLHGA. Ignores multiyear averagingSource: Assessable premium data as compiled by NOLHGA44
Estimated Current Health Account CapacityAssessment information can be found on NOLHGA’s website: www.NOLHGA.comFacts & FiguresAssessment Data Various summary reports reflecting nationwide capacity,assessments called and refunded activity by account, year andinsolvency case Various reports for above by state level45
Estimated Health Account Capacity – HMO -2015* # HMOs not currently in assessment base – 760 ** Estimated Health Account assessable premium for HMOs (if included) –- 245,814,389,000 (approximately 69.5% of gross HMO health premiums and 92.8%of current Health Account assessable premium)Estimated Health Account capacity related to HMOs (if included)- 4,720,798,810 (approximately 90.8% of current Health Account capacity)*Above amounts and counts include PR which is no longer a member ofNOLHGA** Does not include 100 HMO’s in California under the Dept. of Managed HealthCareSource: Above are preliminary results of data as compiled by NOLHGA fromAMBest Global Insurance Database. Data has not been reviewed in detail byNOLHGA.46
Estimated Health Account Capacity – Comparison# companiesHealth ’s8427605,201,867,3624,720,798,81047
By State ComparisonSource: Preliminary results ofdata as compiled by NOLHGAfrom AMBest Global InsuranceDatabase. Data has not beenreviewed in detail by NOLHGAFor purposes of this preliminary analysis, all premiums have been assumed to be located inthe state of domicile of the related HMO48
Extreme example of a product that is "sold not bought" - In spite of high initial consumer interest in LTC insurance - Lack of consumer awareness of level of risk and costs - Sticker shock of high premium rates Broad distribution channels do not push LTC products - Lack of understanding of product; discomfort selling