Transcription
January 2019MALAWI UNICEF/Pirozzi2018/19 Education Budget BriefTowards Improved Education for all in MalawiKey messages and recommendations1The Government is commended for developing severalpolicies to improve efficiency, equity and quality of basiceducation. These include the Grade Promotion Policyfor Malawi Primary Schools, National Girls’ EducationStrategy (2018 – 2023) and the Teacher ManagementStrategy.Recommendation: The Government and Developmentpartners should work together to implement the abovepolicies. This may require dedicated human, technical andfinancial resources.2Fiscal space to increase education sector budgets infiscal year 2018/19 remains very limited, but there ispotential for doing more with available resources byimproving efficiency and equity of expenditures.Recommendation: The Ministry of Education, Scienceand Technology (MoEST) is encouraged to enhance itsfocus on the efficiency of spending through strengtheningprocurement, performance monitoring, professionaldevelopment of teachers and equitable distribution ofhuman, financial and technical resources, within agreedtimes.3At 0.2% and 11% of the total education budget, publicinvestments in pre-primary and secondary educationrespectively fall far behind basic (48%) and tertiaryeducation (36%), which likely contributes to poorsecondary education outcomes [e.g. low net enrollmentrate (16%) and Form 4 completion rate (21.9%)].Recommendation: The Government is encouraged toprogressively increase capital spending for the constructionof early childhood development (ECD) centers andsecondary school classrooms, without cutting investmentson basic education.4The School Improvement Grant (SIG) has significantlyimproved learning in many primary schools, butallocations fall short of growing financial needs, whiledisbursements are often delayed.Recommendation: To improve efficiency of spending, theGovernment should ensure timely disbursements of theSIG and strengthen measures for fiscal transparency andaccountability on use of resources.5In FY 2018/19, there is no budget for in-service training/continuous professional development of teachersrequired to improve quality of learning.Recommendation: The Government should set asideresources for in-service training for both primary andsecondary teachers.6The removal of secondary school fees is commended, asit helps minimize the financial burden on poor familiesof paying for the education of their children.Recommendation: The policy on removal of fees shouldbe accompanied by other compensatory measures for lostschool revenue as well as measures to increase supply ofsecondary education services to cope with likely growth indemand.7Malawi continues to grapple wit serious classroomshortages, especially at primary level, leading to veryhigh pupil-classroom ratios and open-air classes,which compromise quality learning. At the same time,centralized construction of classrooms is significantlymore expensive than school-led construction. Inprimary school alone, about 36000 new classrooms arerequired.Recommendation: The Government is encouragedto scale-up school and community-led construction ofclassrooms following the successful pilot whereby directfunding was provided to schools, with constructionsupervised by the Central Government. Under this pilot,costs ranged between MK2-3 million for two classroomscompared to 30-40 million under centralized procurement.
2E D U C AT I O NPART 1 INTRODUCTIONThis budget brief assesses the extent to which the 2018/19national budget addresses the education needs of allchildren in Malawi. The brief analyses trends, compositionand equity of education sector budgets. Based on this analysis,it proffers recommendations on how the Government canincrease and improve the quality of its spending on education,including by enhancing the transparency, efficiency and equityin the allocation and utilization of all domestic and externalresources in the sector. To establish trends and patterns, thebudget brief analyses data from fiscal year (FY) 2012/13, whichis the base year for all inflation adjustments.The analysis is based on a review of budget documents,especially Detailed Budget Estimates and Program BasedBudgets (PBBs). Approved budget allocations as presentedin the Detailed Estimates of Expenditures and ProgramBased Budget (PBB) were used for 2018/19 while revisedbudget estimates were used for previous years. The analysisis augmented by a review of Government, donor, and NGOsreports on education spending. The total education budgetis defined as the sum of budget allocations to the Ministryof Education, Science and Technology (MoEST) (Vote 250), UNICEF/Pirozzitransfers to Local Authorities for other recurrent transactions(ORT) and personal emoluments (PE), allocations for VocationalTraining under the Ministry of Labour, Youth, Sports andManpower Development (Vote 370), and to several SubventedEducation Institutions (SEIs) (Vote 275)1.Education is a key investment tool for child survival,growth, development and well-being. Education alsocontributes to higher incomes, individual empowerment anddecreased poverty levels. Improving the quality of learningcontributes to economic growth. For Malawi to reap thedemographic dividend, the country will need to invest more inchildren and young persons, of which secondary education isthe foundation. Malawi’s 17.6 million population, with over 50%(8.89 million) individuals below 18 years of age, remains veryyoung.212These are mainly tertiary and education governance institutions namely: University ofMalawi, Malawi Institute of Education, Malawi College of Health Sciences, National Library Services, Malawi National Examinations Board, Scholarship fund, Mzuzu University,Malawi Universities Development Programme, Lilongwe University of Agriculture, MalawiUniversity of Science and Technology, National Council for Higher Education, TechnicalVocational Education Training (TEVET) Authority, Malawi National UNESCO Commission,National Commission for Science and Technology, and Higher Education Students Loansand Grants Board.Malawi Population and Housing Census, National Statistical Office (2018)
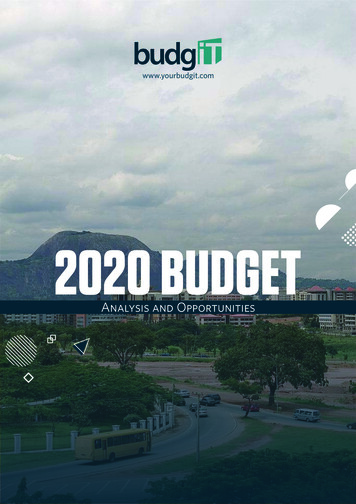
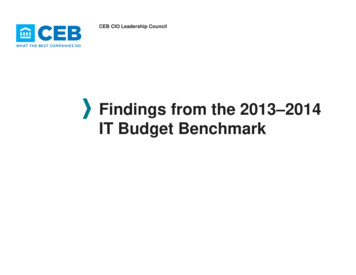
B U D G E T B R I E F 2 01 8 / 1 93PART 2 EDUCATION SECTOROVERVIEWEducation and skills development is one of the five priorityareas of the Government outlined in the Third MalawiGrowth and Development Strategy (MGDS III). Through theMGDS III, the Government has committed itself to improvingaccess, equity, quality and relevance of pre-primary, basic,secondary and tertiary education. Education is key for thesocio-economic development of Malawi. MGDS III is thenational strategic framework for implementing Agenda 2030on Sustainable Development. Under SDG 4, world leaders,including Malawi, made a commitment to ensure inclusiveand equitable quality education and promote lifelong learningopportunities for all.The majority of children of primary school going age iscurrently in school. Data from the Education ManagementInformation System (EMIS, 2017) shows that the net enrollmentrate for primary school is currently at 88% (87% for boys, 89%for girls). It is, however, worrisome that the net enrollment ratedecreased by ten percentage points from 98% in 2015/16. Therelatively high enrollment rate is partly because of increasedpublic awareness on the role of education, public investmentsin basic education (including by development partners), as wellas targeted social protection programs, such as school meals,cash transfers and other forms of social assistance that directlysupport poor families. The pupils per qualified teacher ratio inprimary school is currently at 76.9, an improvement from 79.5in 2015/16. Most schools suffer from shortage of classrooms.Figure 1The result has been high pupil-permanent classroom ratio. Atthe district level, the highest pupil-permanent classroom ratiowas reported in Machinga (165), Lilongwe Rural East (160)and Lilongwe Rural West (149). The lowest were observed inLikoma (50) and Ntchisi (80).3Unfortunately, many children who enrol in primary schooldo not transition to secondary school. Only 38.4% of childrentransition from primary to secondary school (40.9% for boysand 35.8% for girls), and of those that do, only 8% move onto tertiary education. Net enrolment rate for secondary schoolis very low, estimated at 16% in 2017 for both boys and girls(EMIS, 2017). Total enrolment in secondary school was 372,885,against total primary school enrolment of 5,073,721, in 2017(Figure 1). The national average for pupils per qualified teacherratio in secondary school stands at 45.4. One of the biggestchallenges of enrollment is the limited number of secondaryschools. For the entire country, there are only 1,411 secondaryschools compared to 6,065 primary schools.3EMIS, 2017Education is key for the socioeconomic development ofMalawi.Total Enrollment in Primary and Secondary Schools, 2017 (in number of pupils)1,200,000Total number of pupils enrolled1,000,000800,000600,000400,000200,0000Std 1Source: EMIS, 2017Std 2Std 3Std 4Std 5Std 6Std 7Std 8Form 1Form 2Form 3Form 4
4E D U C AT I O N UNICEF/PirozziBOX 1 Key Education StatisticsAttendance in Early Childhood Education(Ministry of Gender, Annual ECD Report)45%Net enrolment rate for primary school88 %Net enrolment rate for primary school,male87 %Net enrolment rate for primary school,female89 %Net enrolment rate for secondary school,male15 %Net enrolment rate for secondary school,female15.5 %Pupils per qualified teacher ratio, primary76.9Pupils per qualified teacher ratio,secondary45.4Number of primary schools6,065Number of secondary schools1,411Pupils to permanent classroom ratio Primary121.4Pupils to permanent classroom ratio Secondary58.7Transition rate to secondary38.4Repetition rate- Primary23.9Source: EMIS, 2017There are many more reasons why girls and boys in Malawidrop out of secondary school. These include child marriage(currently at 42%), inability to pay levies or transport costs,pregnancy, family responsibilities, long distance to schoolsand lack of teachers. Given the above, UNICEF welcomes therecent decision by the Government to remove tuition fees,textbook fees and the general-purpose fund for secondaryeducation. Early pregnancies also contribute to school dropouts. About one in every three girls will bear a child by age18.4 Unless reversed, low secondary school enrolment hassignificant impacts on the social, human capital and economicdevelopment of the country.4Child marriage 42 percent; child-bearing 29 percent, 2016 Malawi Demographic HealthSurvey.Key TakeawaysNegative trends in key education indicators,such as enrollment, should be investigatedto avoid a reversal of gains made over thepast decade.Policies such as double shifting may helpaddress the huge infrastructure needsconsidering high pupil-permanent classroomand pupil-qualified teacher ratios.
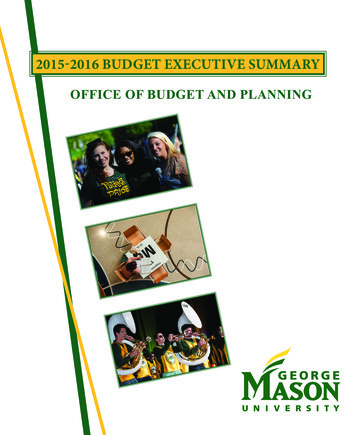
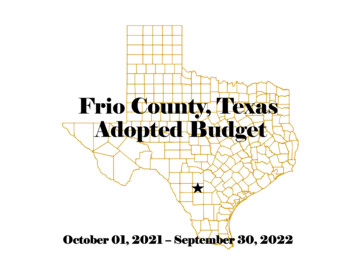
B U D G E T B R I E F 2 01 8 / 1 9PART 3 SIZE OF EDUCATIONSECTOR BUDGETSEducation is a top spending priority of the Government,although budget allocations are insufficient to meet theever growing demand for education services. In 2018/19,the education sector received the highest share of the totalGovernment budget (MK345 billion). This is equivalent to 23.5%of the total Government budget and 6% of the Gross DomesticProduct (GDP) (Figure 2). Debt repayment received the secondhighest share of the budget (12.6%), followed by agriculture(10.4%) and health (9.8%). This means that the total educationbudget for 2018/19 exceeds the Government’s commitmentto Education for All allocating 20% of the national budget toeducation.5Total allocations to the education sector in 2018/19 (MK345billion) increased by 18.7% in nominal terms and 8% in realterms (from MK290 billion) compared to the previous fiscalyear. The sector allocation increased with a higher percentagethan the general Government budget, which went up by about11% in nominal terms and almost no change in in real terms.Over the past 7 years, total education spending has modestlytrended upwards in both nominal and real terms (Figure 3). UNICEF/PirozziDakar Framework on EducationFigure 2Share of Education BudgetFigure 321.9%2023.5%30020%17.3%18.6%19.3%18.9%25018.5%MK, Billions15105.9%50Share of Education Budget35025Percentage (%)56.0%6.0%5.4%2001501006.3%5.7%5.3%5002012/13 2013/14 2014/15 2015/16 2016/17 2017/18 2018/19Education as a % of total budgetEducation as a % of GDPSource: Government Budget Estimates (FY2012/13-2018/19)Dakar Commitment2012/13 2013/14 2014/15 2015/16 2016/17 2017/18 2018/19Total Education Budget (Real)Total Education Budget (Nominal)Source: Approved Budget Estimates5
6E D U C AT I O NMalawi spends more on education than most low-incomecountries, but education outcomes are mixed. Whilst theSub-Saharan African (SSA) average spending on education asa percentage of GDP is approximately 5%, Malawi allocatednearly 6% of its GDP to education in FY 2018/19. Between 2010and 2015, Malawi spent about 1% of GDP more than most lowincome countries (Figure 4).Figure 4Average Education Spending inSelected Countries as a % of GDPZambiaKey TakeawaysTanzaniaEducation continues to be a top spendingpriority of the Government of Malawi.In the current year, the Governmentexceeded the Education for All spendingtarget by allocating 23.5% of its total budgetto education.MalawiMozambique01234Education spending as a % of GDPSource: World Development Indicators, UNICEF Budget BriefsPART 4 COMPOSITION OFEDUCATION SPENDINGThe largest share of education sector resources ischannelled through District Councils. In 2018/19, resourcesto be transferred to District Councils will take up 37% ofthe education sector budget. This figure includes budget forpersonnel emoluments and other recurrent transactions.Subvented organizations, mainly universities and colleges, takeup 35% of the education budget, whilst the MoEST will receiveabout 25% of the sector budget (Figure 5). The MoEST wasallocated MK86 billion up from MK74 billion in FY2017/18.Basic and higher education continue to get the lion’s shareof the education budget. In 2018/19, most of educationsector resources will go to basic education, with pre-primaryeducation getting a very small fraction. In Malawi, early learning(also referred to as pre-primary education) is usually labelledEarly Childhood Development (ECD), although the latter iswider in scope. In fact, early learning is part of ECD. Excludingthe grant expected from the World Bank on ‘Investing in EarlyYears’, ECD (mainly for early learning) was allocated 0.20% ofthe education budget, while basic education 47.8%, secondaryeducation 11.5% and higher (tertiary) education 35.7% (Figure6). The remaining 4.9% was for cross cutting institutions suchas Malawi Institute of Education and Malawi National UNESCOCommission. UNICEF/Pirozzi56
B U D G E T B R I E F 2 01 8 / 1 9Figure 5Distribution of Education SectorResources by MDA in MK Millions2%100Figure 67Composition of the 2018/19Education Sector Budget by Levelof Education (as a % of total)1%0.2%1%4.9%35%Share of budget 8/19FY2017/18MOESTDistrict Councils (ORT PE)Subvented InstitutionsMinistry of Gender (ECD)Ministry of Labour (Vocational Training)Pre-Primary (ECD)Basic Education47.8%Secondary School11.5%Higher Education35.7%Cross-cutting line itemsSource: 2018/19 Program Based BudgetCompared to the previous year, the composition of theeducation budget by levels of education remains relatively thesame.The Government’s contribution to early learning inFY2018/19 (MK669 million) is nominally higher by 9%compared to the revised allocation in the previous year (MK616 Million). The allocation in the current year is equivalentto MK409 per each of the 1.6 million children accessingECD services through centers. If inflation is considered, theGovernment’s allocation to early learning (ECD) went down by2%. This is regrettable considering the increase in enrolment.In FY 2018/19, the total budget allocation to basiceducation (MK163 billion) increased by 17% in nominalterms and 6.4% in real terms compared to MK139 billionin 2017/18. This includes MK118 billion and MK9.5 billion tobe transferred to District Councils for Personal Emolumentsand ORT, respectively. Approximately 73% of resources for0.2%4.9%Source: 2018/19 Program Based Budgetbasic education are for personnel emoluments, about 6%for infrastructure and purchase of desks, with the remainingallocated for other recurrent transactions (ORT). The budgetfor ORT, which include the School Improvement Grant (SIG),has marginally increased from MK9 billion in 2017/18 to MK9.5billion in 2018/19.The secondary education budget increased at the samerate (18% in nominal terms and 6% in real terms) as theentire education budget. In FY2018/19, secondary educationwas allocated MK39 billion compared to the revised budget ofMK33billion in 2017/18. Analysis of capital investments by bothGovernment and development partners show glaring disparitiesbetween primary and secondary education. Secondaryeducation will get 28% (MK12 billion) of the total capital budgetfor education whilst basic education has been allocated 65%(MK28 billion). Although it is relatively normal for a country tohave slightly fewer secondary than primary schools, the gapin Malawi is a bit high. There are approximately 4 times more
8E D U C AT I O NRecurrent costs consume the largest part of the educationbudget (Figure 8). As was the case in the previous year, therecurrent budget will consume 87% of the sector budget, withthe remaining 13% (or MK43 billion) been allocated to capitalprojects (Figure 9). The capital budget increased by 13% innominal terms and 4% in real terms from MK38.7 billion in2017/18 to MK43.6 billion in 2018/19. Out of the total capitalbudget, MK28.3 billion is for basic education, MK2.7 billion fortertiary education and MK12.4 billion for secondary education.Similar to recurrent budgets, basic education is getting the lion’sshare of the capital budget (65%), with secondary educationgetting 28%. Between 2013/14 and 2017/18 recurrent coststook up 85% of education sector budget, on average, withonly 15% allocated to development costs, including theconstruction of school blocks. At the national level, there are13,189 classrooms requiring rehabilitation at primary schoollevel. It is estimated that about 27,113 extra classrooms willbe required for the entire primary sub-sector, given projectedenrolment increases. Some stakeholders estimate the need tobe 36000 new classrooms.primary than secondary schools. The secondary schools aretoo few, which makes the absorption of pupils from primaryschool very challenging. Moreover, only 57% of secondaryschool teachers are professionally trained. Due to shortage ofqualified teachers, there is a sizeable number of primary schoolteachers teaching at secondary level. As a result, the quality ofsecondary education services suffers.The tertiary education budget, totalling MK121 billion,has increased by 19% in nominal terms and 8% in realterms in 2018/19 from the revised budget of MK102 billionin 2017/18. This means that allocations to tertiary/highereducation increased at about one percentage point more thansecondary education. This also means that tertiary educationis increasingly becoming a priority of the Government.Vocational School Management (Vote 84.01) in the Ministry ofYouth witnessed the highest increase amongst all institutionsresponsible for tertiary education, following a 462% increasein allocation from MK887 million in FY2017/18 to nearly MK5billion in 2018/19. Amongst Universities, the Malawi Universityof Science and Technology (MUST) received the highestincrease, from MK5.2 billion in FY2017/18 to MK7.7 billion in2018/19 or a 48% jump in funding (Figure 7).Figure 7There are approximately 4 timesmore primary than secondaryschools.Top 10 Tertiary Allocations in 2018/19 (in MK billions)60FY2018/1954.0FY2017/1850.050MK, urce: 2018/19 Program Based Budget5.00.83.53.03.10.9sitytio Tecn hnTr icai alni Vng ocAu atith onaor litySc Mie alanc we iUan nd iveTe rch sitHno y oighelo fgyLo r Ean dus caan tid onG Sra tunt ds enBo tsHigarhedrEducation(MoESTMan)ag Vem ocen atiot ( naVo lte Sc84 ho.0 ol1)MalH awiea Clth olSc legie e onc fDesev Mel aop lam wien Ut P nivro ergr sitam iem severniUzuzuMiwof e UAg nivric erul sittu yreawMalLilongofitynivers5.100U5.92.8
B U D G E T B R I E F 2 01 8 / 1 9Figure 8Composition of EducationSector Budget by EconomicClassification350300MK, 2018/19Capital BudgetFigure 9Distribution of the Capital Budgetby Level of Education7012.5MK, Millions605027.810.88.02027.928.3100FY 2017/18Secondary EducationFeedback from several stakeholders during the 2018/19 post budget ParliamentaryHearings held in May 2018.Key TakeawaysThe Government should revisit the allocationmix within the education sector so that earlylearning and secondary education gets anincreased shares in order to address the verylow transition rates to secondary educationand to tertiary education.8030The budget for primary teacher training modestly increasedfrom MK3.8 billion in 2017/18 to MK4.8 billion in 2018/19.This constitutes a 26% increase in nominal terms and 13%increase in real terms. Considering the high pupil-qualifiedteacher ratio, the Government should plan for the training andrecruitment of teachers, and their continuous professionaldevelopment, for both primary and secondary education.RecurrentSource: 2018/19 Program Based Budget and Appropriation Bill40The allocation of MK4 billion for desks in primary andcommunity day secondary schools (CDSS) is a welcomedevelopment. In the previous year (2017/18), about MK2.5 billionwas allocated to procurement of desks. Several stakeholdershave, however, lamented delays in the procurement of desks,resulting in funds for 2017/18 being carried over to 2018/19.6The 2017 EMIS report estimated that slightly over 1,393,842pupils’ desks and 789,558 chairs will be required to improve thelearning environment for basic education.650Upward revisions of public investmentsin early learning and secondary educationshould not result in cuts in basic education.Although claiming the majority of sectorresources, a lot still needs to be done toensure that there is adequate supply ofquality education in Malawi.Huge infrastructure gaps in basic andsecondary education require the Governmentto increase its share of the education budgetthat goes to capital projects, especially atpre-primary and secondary level. At the sametime, there is need to improve efficiencyof capital spending considering that,often times, there are significant delays inprocurement and implementation of capitalprojects.FY 2018/19Higher EducationBasic EducationThe budget for primary teachertraining modestly increased.Source: 2018/19 Program Based Budget and Appropriation Bill9
10E D U C AT I O N UNICEF/PirozziPART 5 BUDGET CREDIBILITYAND EXECUTIONRecent social sector spending reports as well as financialstatements in 2016/17 and 2017/18 show good absorptionrate by the MoEST, except for capital projects. The executionrate for capital budgets is relatively low because of protractedprocurement processes. For example, procurement of deskswhich started in 2017/18 spilled over to 2018/19. In the 2018/19PBB, the MoEST also noted that “payment of contractorstakes long”.7 It is also important to note that the MoEST andother education related MDAs sometimes spend beyond theirallocations to ORT, resulting in budget overruns. For example,in 2016/17, the mid-year revised budget for Vote 250 went upto MK150 billion from MK146 billion. In the first six monthsof 2017/18, the MoEST spent MK10.1 billion against a targetof MK9.9 billion for PE. These fiscal slippages often force theGovernment into borrowing.A recent paper by the International Monetary Fund andUNICEF8 shows that there is room for the education sectorto improve the efficiency of spending. Inefficiencies arisefrom several factors, including insufficient inputs, budgetutilization bottlenecks, low teacher morale, absenteeism andlimited professional development of teachers. As highlightedby the IMF, the education sector lacks adequate supply ofinputs across multiple indicators, including but not limited toinadequate trained teachers, shortage of text books and otherlearning materials. About three students in standard 5 and 6share one textbook in English, Mathematics and Chichewa. Thelimited supply of education inputs possibly reflects the skewednature of education budgets, which weigh heavily in favour of78MoEST PBB, Program Issues, pp.235IMF, (2018), Selected Issues Paper: Efficiency of Public Spending on Health and Educationin Malawi [2018 Article IV Consultations), International Monetary Fund (IMF).PE. UNICEF field reports have also revealed delays, sometimesexceeding five months in the disbursement of educationresources such as School Improvement Grants, effectivelycompromising the efficiency and effectiveness of budgets.Improved efficiency allows the Government to achievethe same output with fewer resources or achieve higheroutputs with the same resources. There are several waysthrough which the Government can improve the efficiency ofeducation spending. These include: strengthening technicalefficiency, ensuring timely disbursements of resources andswifter procurement processes, transforming the incentivesystems and improving the functionality of program-basedbudgeting. Additionally, the Government should strengthenreporting and accountability for education resources by allrelevant MDAs and education institutions across all governancelevels. Lastly, it is crucial for the Government to investigateand respond to any possible wastages and other bottlenecksthroughout the spending chain, including in procurement andfrontline service delivery.Key TakeawaysEnhancing the efficiency and effectivenessof education spending is key in Malawiconsidering the limited revenue base.Persistent delays in the implementationof capital projects and in procurement ofessential materials, like desks, has a highpotential to impact negatively on the supplyand quality of education services.
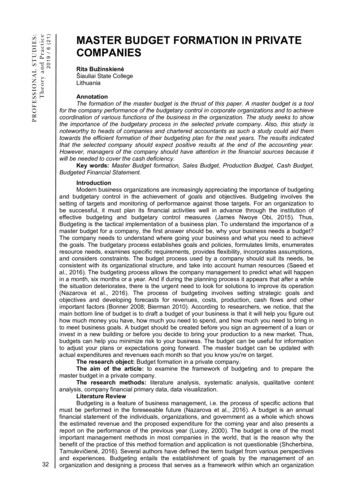
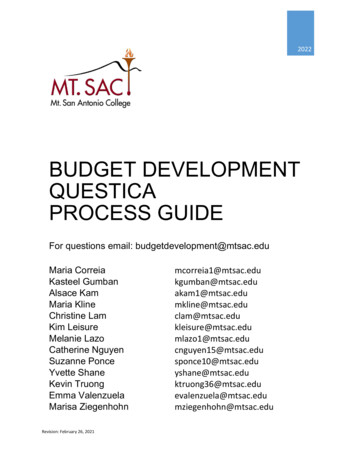
B U D G E T B R I E F 2 01 8 / 1 9PART 6 DECENTRALIZATIONAND EDUCATION SPENDINGEducation is one of the sectors that are advanced withregards to fiscal decentralization. In 2018/19, about 37%(MK128 billion) of educations sector resources will betransferred directly to District Councils. Out of this amount,MK118 billion will be for PE, mainly for basic education, andMK9.5 billion for ORT (also for basic education). Alongsidethis fiscal decentralization drive, education stakeholders havecalled upon the Government to strengthen district and schoollevel expenditure frameworks in order to engender efficiency,transparency and accountability in the utilization of resourcesas highlighted above.The ORT budget to District Councils has declined in realterms compared to the previous year. The ORT budget toDistrict Councils marginally increased from MK9 billion in2017/18 to MK9.5 billion in 2018/19. This is equivalent to a6% change in nominal terms and a 4% decline in real terms.This decline will negatively affect the delivery of quality basiceducation services. The ORT education budget to DistrictCouncils is implemented through a complex combination ofgrants and allowances, mostly to cover operations costs and11small-scale rehabilitation of school assets. The largest share ofthe ORT budget to District Councils is for the Primary SchoolImprovement Program (PSIP).9 Stakeholders in the educationsector, have therefore called upon the Government to reviseupwards allocation to the PSIP, commonly known as the SchoolImprovement Grant (SIG) to at least MK1 million per school inFY2019/20, up from MK600,000. The Government should alsoconsider extending the same to secondary education.9The PSIP comprises the following elements: School Improvement Grant (SIG), ZoneImprovement Grants (ZIG), Zonal Training Funds (ZTF), and District Training Funds (DTF).The criteria governing the allocation of the SIG include enrolment, number of teachers,availability of electricity and water, pupil-teacher ratio as well as pupil-classroom ratio.Key TakeawaysThe SIG has proved to be an effective wayof financing education via schools, butallocations are far below financial needs.To be effective, fiscal decentralization shouldbe accompanied by deliberate efforts tostrengthen local Government financing andexpenditure systems.PART 7 EQUITY OFEDUCATION SPENDINGInequities exist in allocations to secondary schools. Schoollevel analysis of allocations to secondary schools in the 2018/19budget shows that whilst some schools have witnessedincreases in nominal and real terms, more than one in threeschools have suffered cuts in nominal terms. This is an issuethat may require investigation by relevant authorities.Considerable variations have also been observed in percapita allocations to District Councils, which may bereflective of inequities in education spending. In 2018/19,per capita allocations ranged from MK224 in Lilongwe City toMK1,815 in Likoma (usually an outlier), followed by Rumphi(MK1,117) (Figure 10). One possible solution is to reviewthe interGovernmental transfer formula to District Councils,an issue that has been raised by several stakeholders. TheNational Local Government Finance Committee (NLGFC) andother education stakeholders agree that the education formulais also due for review. The formulas currently being used wereapproved in 2002. Since then, many factors have changed. UNICEF/Pirozzi
ZomBl baan UrbatyrnM eRLilong zim uralbwaeRu Nora rthlWeRu stmphiLikomaNtM chezuuzuNkh CityataCh Baira ydzuluNtcLihilongM siwweaRu nzaralEastDedzaSalimaThyoloChitipaBalakaDowKa arongM aulanNkhjeoZo takmotbaaRuKa ralsunguNLisalong njw eeCityMchinjiNPh enoM alozim mba beSM outhangoCh chiBl ikwanaty ware
rate (16%) and Form 4 completion rate (21.9%)]. . the highest pupil-permanent classroom ratio was reported in Machinga (165), Lilongwe Rural East (160) . Std 1 Std 2 Std 3 Std 4 Std 5 Std 6 Std 7 Std 8 Form 1 Form 2 Form 3 Form 4 Education is key for the socio-economic development of