Transcription
IBM SoftwareBusiness AnalyticsIBM SPSS AmosTest relationships in attitudinal and behavioral modelsHighlights Specify, estimate, assess, and presentmodels in an intuitive diagram. Alternatively, use a non-graphical,programmatic method to specify models. Non-programmers can easily specify amodel without drawing the path diagram. Increase the reliability of variables byincluding multiple indicators. Impute missing values and latent scores. Use for longitudinal studies, multiple-groupand reliability analysis.IBM SPSS Amos is powerful structural equation modeling (SEM)software that enables you to support your research and theories byextending standard multivariate analysis methods, including regression,factor analysis, correlation, and analysis of variance.In SPSS Amos, you can specify, estimate, assess, and present yourmodel in an intuitive path diagram to show hypothesized relationshipsamong variables. The latest release enables you to specify user-definedestimates using a simplified technique. You can use a non-graphical,programmatic method to specify models. SPSS Amos also provides away for non-programmers to specify a model easily without drawingthe path diagram.Confirm complex relationshipsYou can quickly build attitudinal and behavioral models in SPSS Amosthat realistically reflect complex relationships. Any numeric variable,whether observed or latent, can be used to predict any other numericvariable. SPSS Amos includes expanded statistical options based onBayesian estimation. You can: Perform estimation with ordered-categorical and censored data.This enables you to create models based on nonnumerical datawithout having to assign numerical scores to the data, and work withcensored data without having to make assumptions other than theassumption of normality.Impute numerical values for ordered-categorical and censored data.The resulting dataset can be used as input to programs that requirecomplete numerical data.Estimate posterior predictive distributions to determine probablevalues for missing or partially missing data values in a latent variable.
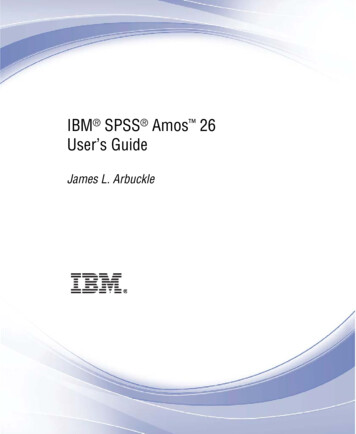
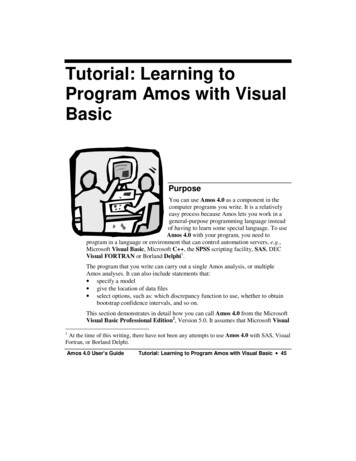
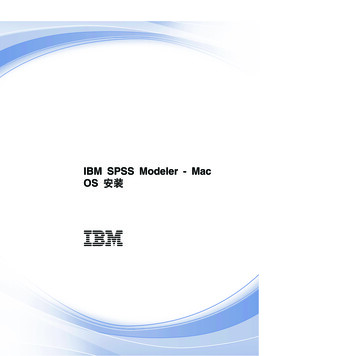
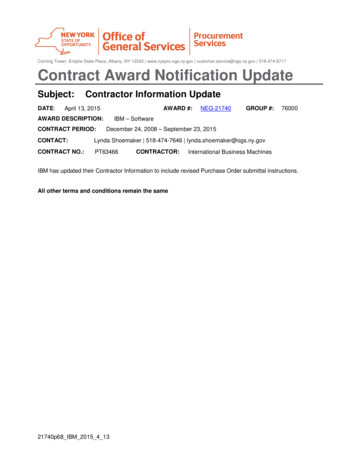
IBM SoftwareBusiness AnalyticsThe equivalent table representation in the recent version ofSPSS Amos is similar to the image in Figure 2.SPSS Amos enables you to simultaneously analyze data fromseveral populations, such as multiple ethnic groups. Increasethe reliability of variables in your analysis by includingmultiple indicators. Impute missing values and latent scores,such as factor scores, with multiple imputations. You canalso use SPSS Amos for longitudinal studies, multiple-groupanalysis, and reliability analysis.Go from onscreen model to publishedresults quicklyThe SPSS Amos interactive, visual approach to SEM makesit easy for you to learn and use. Within the SPSS Amosinterface you can create path diagrams of your analysisusing drawing tools, rather than by writing equations or bytyping commands.Easier model specificationIBM SPSS Amos now allows non-programmers to specify amodel without drawing a path diagram. The model can beentered into a spreadsheet-like table that can be modified. Forexample, Figure 1 below shows an example of a path diagramfrom the Amos User’s Guide.Figure 2: An equivalent table representation of a path diagram inSPSS AmosAfter a model has been fitted, parameter estimates will bedisplayed in the table (in additional columns), in the same waythat parameter estimates can now be displayed on the pathdiagram after a model has been fitted.knowledgevalueperformance1The table representation and the path diagram representationwill provide two alternate views of a model. The table viewwill occupy the same area in the main Amos Graphics windowthat the path diagram occupies. You will be able to switchback and forth between the table view and the path diagramview at any time.errorsatisfactionFigure 1: Example of a path diagram created in SPSS Amos2
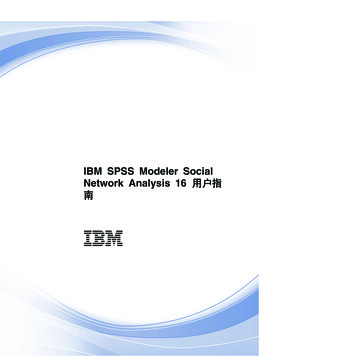
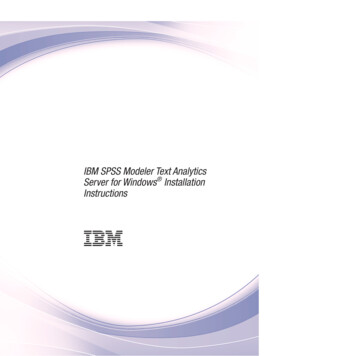
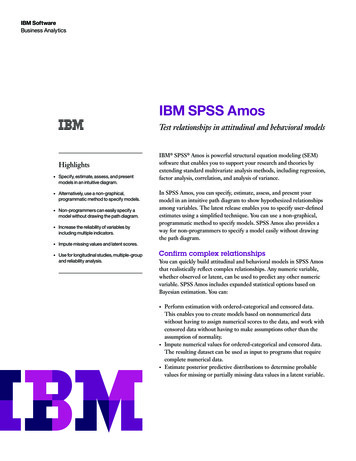
IBM SoftwareBusiness AnalyticsFigure 4: Advanced output options make it even easier to work in SPSSAmos. For example, quickly interpret or summarize results with “use-it-in-asentence” help.Find models that best fit your dataUse the SPSS Amos exploratory technique, SEM specificationsearch, to choose a model from a large number of candidates.Take advantage of previous research by specifying constraintson parameter values in your model, or use Bayesian estimationto specify an informative prior distribution for the parameters.Use confirmatory factor analysis to specify and test a factorpattern, instead of relying on traditional exploratory factoranalysis.Figure 3: SPSS Amos allows you to create structural equation modelsprogrammatically. This capability is useful for: (a) a model that is so complexthat drawing its path diagram is difficult; (b) those who prefer working eitherwith a keyboard rather than a mouse or with text ratherthan graphics; (c) those who need to generate many similar modelsthat differ only in some details (such as the number of variables or thevariable names).The alternative non-graphical, programmatic approachimproves accessibility for those who can benefit by specifyingmodels directly. Its scripting capabilities improve theproductivity of users who need to run large, complicatedmodels, and make it easy to generate many similar modelsthat differ slightly.You can also fit multiple models in a single analysis. SPSSAmos examines every pair of models where one modelcan be obtained by placing parameter restrictions on theother. SPSS Amos even suggests how the model may beimproved—for example, by adding an arrow to connect twovariables. Graphs and statistics help you find an optimumtrade-off between model simplicity and goodness of fit.Once you complete a model, you can assess fit with oneclick. Then, when your model is complete, you can printpresentation-quality output. IBM SPSS Amos includes 36completed examples as an introduction to structural equationmodeling. It also has an extensive online help system.3
IBM SoftwareBusiness AnalyticsDiscover unexpected relationshipsUse with products you haveAfter you fit a model, the SPSS Amos path diagram shows thestrength of the relationship between variables. For example,when working with data from a product survey oncondiments, you might initially assume that the variable,“satisfaction of taste,” is the best brand loyalty indicator.Looking at the path diagram in SPSS Amos, however, youmight discover that the best brand loyalty indicator is“package size purchased.”While you can use SPSS Amos on its own, you can also useit to extend the analyses you might already be doing usingIBM SPSS Statistics. SPSS Amos especially complementsyour analyses if you use IBM SPSS Advanced Statistics orIBM SPSS Regression, because SEM extends algorithmsavailable in these software products.FeaturesGraphical user interfaceApply Amos to explore the “hows andwhys” in your data Researchers and graduate students who have observational, ornon-experimental, data apply SPSS Amos in a variety of fieldsto convince a committee or boss, secure funding, or getpublished. Examples include: Psychology—Develop models to understand how drug,clinical, and art therapies affect mood.Medical and healthcare research—Confirm which of threevariables—confidence, savings, or research—best predicts adoctor’s support for prescribing generic drugs.Social sciences—Study how socioeconomic status,organizational membership, and other determinantsinfluence differences in voting behavior and politicalengagement.Educational research—Evaluate training programoutcomes to determine the impact on classroomeffectiveness.Market research—Model how customer behavior impactsnew product sales.Institutional research—Study how work-related issuesaffect job satisfaction. Display, through a path-diagram browser, a description andthumbnail image of all path diagrams in your foldersSimply point-and-click to select program optionsCreate variables in path diagrams with a single clickDisplay a diagram for a different group or model with justone clickView the contents of data filesDrag variable names from the dataset to the path diagramNon-graphical, programmatic interface 4Use a non-graphical, programmatic method to specifymodels–– Improved accessibility for those who can benefit byspecifying models directly–– Scripting capabilities improve the productivity ofusers who need to run large, complicated models–– Easily generate many similar models that differslightlyIBM SPSS Amos now allows non-programmers to specify amodel without drawing a path diagram–– The model can be entered into a spreadsheet-liketable that can be modified–– Parameter estimates will be displayed in the table(in additional columns)–– The table representation and the path diagramrepresentation will provide two alternate views ofa model
IBM SoftwareBusiness AnalyticsModeling capabilities Create structural equation models (including such specialcases as path analysis and longitudinal data models) withobserved and latent variablesSpecify candidate models using one of two methods:–– Specify each individual candidate model as a set ofequality constraints on model parameters–– Use SEM in an exploratory way. SPSS Amos tries outmany models and suggests promising ones, whileusing Akaike information criterion (AIC) and Bayesinformation criterion (BIC) statistics to comparemodelsFit confirmatory factor analysis models, variancecomponents models, errors-in-variables models, andgeneral latent variable modelsAnalyze mean structures and multiple group datasets–– Quickly specify and test multiple group data throughautomated specificationAnalyze data from several populations at onceSave time by combining factor and regression models into asingle model, and then fit them simultaneouslyAnalyze multiple models simultaneously: SPSS Amosdetermines which models are nested and automaticallycalculates test statisticsTranslate a path diagram into a Visual Basic programFit linear growth curve models using automaticallygenerated parameter constraints Bayesian estimation Estimate values for ordered-categorical and censored dataMarkov chain Monte Carlo (MCMC) simulationSpecify an informative prior distribution: Normal,uniform, or customPlot the marginal posterior distribution of any parameterEstimate any function of model parametersAvoid inadmissible solutions and unstable linear systemsObtain optimal asymmetric credible intervals forindirect effectsComputationally intensive modeling Evaluate parameter estimates with normal or non-normaldata using powerful bootstrapping options. Thebootstrapping and Monte Carlo capabilities in SPSS Amosmake it easy for you to obtain bias and standard errorestimates for any parameter, including standardizedcoefficients and effect estimatesTest multivariate normality and perform outlier analysisModel creation Latent class analysis (mixture modeling) Train the classification algorithm. Assign some cases togroups ahead of time and allow the program to classifythe remaining casesRequire some model parameters to be equal across groupswhile allowing other parameters to vary across groupsPerform market segmentation studiesEstimate the size of each cluster or segmentPerform mixture regression and mixture modelingPerform mixture factor analysisEstimate the probability of group membership forindividual cases 5Use the path diagram as a model specificationThe model can be entered into a spreadsheet-liketable that can be modifiedModify the model by changing the path diagram withdrawing toolsDisplay parameter estimates and fit measures graphicallyon the path diagramDisplay degrees of freedom at any time while drawing onthe path diagramCopy and paste part of one path diagram into anotherpath diagram
IBM SoftwareBusiness AnalyticsAnalytical and statistical capabilities Use full information maximum likelihood estimation inmissing data situations for more efficient and less biasedestimatesObtain an approximate confidence interval for any modelparameter under any empirical distribution, includingstandardized coefficients, using fast bootstrap simulation–– Assess model fit with Bollen and Stine’s bootstrapapproach–– Calculate percentile intervals and bias-correctedpercentile intervalsPerform randomized permutation tests to show whetherequivalent or better-fitting models can be foundSpecify equality constraints in the path diagram by usingthe same label for two or more parameters, includingmeans, intercepts, regression weights, and/or covariances,in the same group or across different groupsEstimate means for exogenous variablesEstimate intercepts in regression equationsPerform parametric bootstraps to find an approximateconfidence interval for any model parameter under normaldistribution theory, including standardized coefficients withMonte Carlo simulationUse a variety of estimation methods, including maximumlikelihood, unweighted least squares, generalized leastsquares, Browne’s asymptotically distribution-free criterion,and scale-free least squaresEvaluate models using more than two dozen fit statistics,including Chi-square; AIC; Bayes and Bozdoganinformation criteria; Browne-Cudeck (BCC); ECVI,RMSEA, and PCLOSE criteria; root mean square residual;Hoelter’s critical n; and Bentler-Bonett and Tucker-LewisindicesObtain bias and standard error estimates for any parameterand derived statistics with bootstrapping or Monte CarlooptionsOptionally, estimate standard errors using the observedinformation matrix View p values along with critical ratios for individualparameters OutputUse additional navigation aids, display options, and tableformatting options with enhanced text output–– Quickly navigate to and display portions of output inthe navigation panel–– Link section and table headings to context-sensitivehelp–– Link numbers, such as p values displayed in thenavigation panel, to “use-it-in-a-sentence” help, andreceive a plain-English description of what thenumbers representView XHTML (web-based) output of your text files inyour browser–– Preserve table formatting when you use the clipboardor drag-and-drop editing to copy tables to otherapplications–– Use XHTML-formatted files as an archival format–– Parse SPSS Amos output using an XML parser; whenwriting programs to post-process SPSS Amos output,use an XPATH expression to extract any desiredportion of the outputPrint previewData imputation 6Impute numerical values for ordered-categorical andcensored dataImpute missing values and latent variable scoresChoose from three different methods: Regression,stochastic regression, and BayesianSingle imputation–– Regression imputation uses linear regression toreplace missing valuesSingle or multiple imputation–– Stochastic regression imputation uses maximumlikelihood (ML)-based parameter estimates ofobserved data; assumes parameters are equal to theirML estimates–– Bayesian estimation is similar to stochastic regressionimputation; however, it assumes that parameter valuesare estimated, not known
IBM SoftwareBusiness AnalyticsDrawing and other tools Data and file managementCreate presentation-quality path diagrams–– Easily show or hide all variable names or labels in apath diagramPrint or paste path diagrams into other applicationsUse toolbox buttons, including shape, copy, erase, fit-topage, and align, to draw your modelCustomize the toolbar–– Associate a toolbar button, menu item, or hot keywith any SPSS Amos macro, including those youwrite yourself–– Add an image to a toolbar button–– Create a shortcut key for macro executionFit your model by selecting buttons on the toolbarWork with variable names you assign, instead of GreeklettersAdd titles and annotations to your diagramWork with the toolbar, menus, and hot keys for frequentlyused tasksUse pop-up menus that show useful actions for eachelement in your diagramRe-arrange measurement models by using the reflect androtate buttonsUse plugins to extend program capabilities System requirementsRequirements vary according to platform. For details,see ibm.com/spss/requirements.About IBM Business AnalyticsIBM Business Analytics software delivers data-driven insightsthat help organizations work smarter and outperform their peers.This comprehensive portfolio includes solutions for businessintelligence, predictive analytics and decision management,performance management, and risk management.Business Analytics solutions enable companies to identifyand visualize trends and patterns in areas, such as customeranalytics, that can have a profound effect on businessperformance. They can compare scenarios, anticipatepotential threats and opportunities, better plan, budget andforecast resources, balance risks against expected returns andwork to meet regulatory requirements. By making analyticswidely available, organizations can align tactical and strategicdecision-making to achieve business goals. For furtherinformation, please visit ibm.com/business-analytics.Programmability Extend the capabilities of SPSS Amos–– In Bayesian analysis, find the posterior distribution ofany function of the parameters–– Define your own fit measuresRequest a callTo request a call or to ask a question, go to ibm.com/businessanalytics/contactus. An IBM representative will respond toyour inquiry within two business days.Documentation and help File types supported include: dBASE (.dbf), Microsoft Excel(.xls), FoxPro (.dbf), Lotus (.wk1, .wk3, .wk4), MicrosoftAccess (.mdb), SPSS Statistics (.sav), and text (.txt, .csv)Extensive online help with cross-references to explanationsof the outputIncludes User’s Guide PDF file with 36 completed examples7
Copyright IBM Corporation 2013IBM CorporationSoftware GroupRoute 100Somers, NY 10589Produced in the United States of AmericaApril 2013IBM, the IBM logo, ibm.com and SPSS are trademarks of InternationalBusiness Machines Corp., registered in many jurisdictions worldwide.Other product and service names might be trademarks of IBM or othercompanies. A current list of IBM trademarks is available on the Web at“Copyright and trademark information” atwww.ibm.com/legal/copytrade.shtml.Microsoft, Windows, Windows NT, and the Windows logo aretrademarks of Microsoft Corporation in the United States, othercountries, or both.This document is current as of the initial date of publication and maybe changed by IBM at any time. Not all offerings are available in everycountry in which IBM operates.THE INFORMATION IN THIS DOCUMENT IS PROVIDED“AS IS” WITHOUT ANY WARRANTY, EXPRESS OR IMPLIED,INCLUDING WITHOUT ANY WARRANTIES OF MERCHANT ABILITY, FITNESS FOR A PARTICULAR PURPOSE AND ANYWARRANTY OR CONDITION OF NON-INFRINGEMENT. IBMproducts are warranted according to the terms and conditions of theagreements under which they are provided.Please RecycleYTD03114-USEN-02
pattern, instead of relying on traditional exploratory factor analysis. You can also fit multiple models in a single analysis. SPSS Amos examines every pair of models where one model can be obtained by placing parameter restrictions on the other. SPSS Amos even suggests how the model may be improved—for example, by adding an arrow to connect two