Transcription
Q3Quarterly Market ReviewThird Quarter 2020
Quarterly Market ReviewThird Quarter 2020This report features world capital market performance and aOverview:timeline of events for the past quarter. It begins with a globaloverview, then features the returns of stock and bond assetMarket Summaryclasses in the US and international markets.World Stock Market PerformanceThe report also illustrates the impact of globally diversifiedportfolios and features a quarterly topic.World Asset ClassesUS StocksInternational Developed StocksEmerging Markets StocksSelect Market PerformanceSelect Currency Performance vs. US DollarReal Estate Investment Trusts (REITs)CommoditiesFixed IncomeGlobal Fixed IncomeImpact of DiversificationQuarterly Topic: When It’s Value vs. Growth,History Is on Value’s Side2
Quarterly Market SummaryIndex ReturnsUS StockMarketInternationalDevelopedStocks3Q dMarketex USUS .6%2020 Q22009 Q22009 Q22009 Q32001 Q32008 Q4-22.8%-23.3%-27.6%-36.1%-3.0%-2.7%2008 Q42020 Q12008 Q42008 Q42016 Q42015 Q2Since Jan. 2001Avg. Quarterly ReturnBestQuarterWorstQuarterPast performance is not a guarantee of future results. Indices are not available for direct investment. Index performance does not reflect the expenses associated with the management of an actual portfolio.Market segment (index representation) as follows: US Stock Market (Russell 3000 Index), International Developed Stocks (MSCI World ex USA Index [net div.]), Emerging Markets (MSCI Emerging Markets Index [net div.]),Global Real Estate (S&P Global REIT Index [net div.]), US Bond Market (Bloomberg Barclays US Aggregate Bond Index), and Global Bond Market ex US (Bloomberg Barclays Global Aggregate ex-USD Bond Index [hedged toUSD]). S&P data 2020 S&P Dow Jones Indices LLC, a division of S&P Global. All rights reserved. Frank Russell Company is the source and owner of the trademarks, service marks, and copyrights related to the RussellIndexes. MSCI data MSCI 2020, all rights reserved. Bloomberg Barclays data provided by Bloomberg.3
Long-Term Market SummaryIndex Returns as of September 30, 2020US StockMarketInternationalDevelopedStocks1 YearEmergingMarketsStocksGlobalRealEstateUS BondMarketSTOCKSGlobalBondMarketex 06%5 Years10 YearsPast performance is not a guarantee of future results. Indices are not available for direct investment. Index performance does not reflect the expenses associated with the management of an actual portfolio.Market segment (index representation) as follows: US Stock Market (Russell 3000 Index), International Developed Stocks (MSCI World ex USA Index [net div.]), Emerging Markets (MSCI Emerging Markets Index [net div.]),Global Real Estate (S&P Global REIT Index [net div.]), US Bond Market (Bloomberg Barclays US Aggregate Bond Index), and Global Bond Market ex US (Bloomberg Barclays Global Aggregate ex-USD Bond Index [hedged toUSD]). S&P data 2020 S&P Dow Jones Indices LLC, a division of S&P Global. All rights reserved. Frank Russell Company is the source and owner of the trademarks, service marks, and copyrights related to the RussellIndexes. MSCI data MSCI 2020, all rights reserved. Bloomberg Barclays data provided by Bloomberg.4
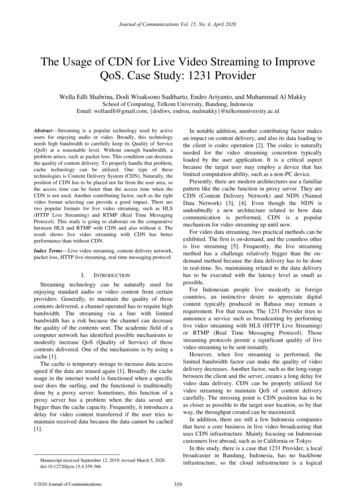
World Stock Market PerformanceMSCI All Country World Index with selected headlines from Q3 2020300280260240220200180Jun 30Jul 31“Deficit Reaches 3Trillion As VirusCosts Soar”“Companies RaisedRecord Amounts bySelling Stock DuringCovid-19 Crisis”“Gold Climbs to aHigh, Topping Its2011 Record”Aug 31“ConsumerSpending Rose5.6% in June”“Euro Nears Two-Year Highas Traders Bet on Europe'sCovid-19 Progress”“Fed Eases InflationTarget in LandmarkDecision”“US Existing-HomeSales Rose 24.7% inJuly from June”“US IndustrialProduction Rises forThird Straight Month”“UK GDP, Down 4-6%Year on Year, Biggest Fallin Advanced Economies”Sep 30“Top Fed OfficialSays EconomyFaces ‘DeepHole' DespiteRebound”“Car Sales AreDown Almost20%, but PricesAre SettingRecords”“US Debt HitsPostwar Record”“CBO DowngradesLong-TermProjections ofEconomic Growth”“Israel Signs Deal With 2 GulfStates Brokered by US”“ConsumersGrow MoreConfidentAbout USEconomy”“US Stocks FinishSecond StraightQuarter of BigGains”These headlines are not offered to explain market returns. Instead, they serve as a reminder that investors should view daily events from a long-term perspective and avoid makinginvestment decisions based solely on the news.Graph Source: MSCI ACWI Index [net div.]. MSCI data MSCI 2020, all rights reserved.It is not possible to invest directly in an index. Performance does not reflect the expenses associated with management of an actual portfolio. Past performance is not a guarantee of future results.5
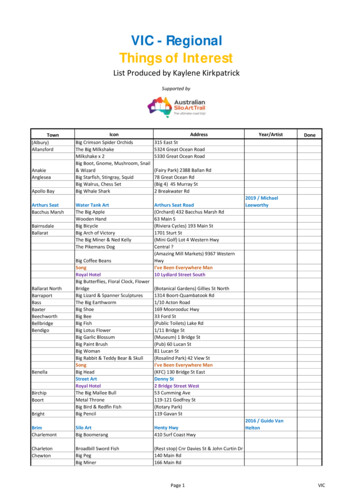
World Stock Market PerformanceMSCI All Country World Index with selected headlines from past 12 monthsLONG TERM (2000–Q3 2020)300200SHORT TERM (Q3 2019–Q3 2020)Last ep 30Dec 31“ManufacturingSputters as BroaderUS Economy Slows”“China’s ConsumerInflation Soars toHighest Level in Years”“US Stocks CloseOut Decade with190% Gain”“New Virus Discoveredby Chinese ScientistsInvestigatingPneumonia Outbreak”Mar 31“Dow Closesat Record asWorries Abate”“Dow, S&P, NasdaqAll Drop More than4% in Largest OneDay Point Declineson Record”“Record Rise inUnemploymentClaims HaltsHistoric Run ofJob Growth”Jun 30“EurozoneEconomy SeesLargestContraction onRecord”“At Least a Fourth ofUS Economy GoesIdle from Lockdown”“US StocksClose OutBest QuarterSince 1998”Sep 30“ConsumerSpending Rose5.6% in June”“US DebtHits PostwarRecord”“Fed Eases Inflation Targetin Landmark Decision”“Recession in US Beganin February, Ending128-month Expansion”“Oil Prices Collapse After SaudiPledge to Boost Output”“US Stocks FinishSecond StraightQuarter of BigGains”These headlines are not offered to explain market returns. Instead, they serve as a reminder that investors should view daily events from a long-term perspective and avoid makinginvestment decisions based solely on the news.Graph Source: MSCI ACWI Index [net div.]. MSCI data MSCI 2020, all rights reserved.It is not possible to invest directly in an index. Performance does not reflect the expenses associated with management of an actual portfolio. Past performance is not a guarantee of future results.6
World Asset ClassesThird Quarter 2020 Index Returns (%)Equity markets around the globe posted positive returns in the third quarter. Looking at broad market indices, emerging markets equities outperformed US andnon-US developed markets for the quarter.Value underperformed growth across regions. Small caps outperformed large caps in non-US developed and emerging markets but underperformed in the US.REIT indices underperformed equity market indices in both the US and non-US developed markets.MSCI Emerging Markets Small Cap Index (net div.)11.85MSCI World ex USA Small Cap Index (net div.)10.12MSCI Emerging Markets Index (net div.)9.56Russell 1000 Index9.47Russell 3000 Index9.21S&P 500 Index8.93MSCI All Country World ex USA Index (net div.)6.25Russell 1000 Value Index5.59Russell 2000 Index4.93MSCI World ex USA Index (net div.)4.92MSCI Emerging Markets Value Index (net div.)4.66S&P Global ex US REIT Index (net div.)4.57Russell 2000 Value Index2.56MSCI World ex USA Value Index (net div.)1.35Dow Jones US Select REIT Index0.83Bloomberg Barclays US Aggregate Bond IndexOne-Month US Treasury Bills0.620.03Past performance is not a guarantee of future results. Indices are not available for direct investment. Index performance does not reflect the expenses associated with the management of an actual portfolio. TheS&P data is provided by Standard & Poor's Index Services Group. Frank Russell Company is the source and owner of the trademarks, service marks, and copyrights related to the Russell Indexes. MSCI data MSCI 2020, allrights reserved. Dow Jones data 2020 S&P Dow Jones Indices LLC, a division of S&P Global. All rights reserved. S&P data 2020 S&P Dow Jones Indices LLC, a division of S&P Global. All rights reserved. BloombergBarclays data provided by Bloomberg. Treasury bills Stocks, Bonds, Bills, and Inflation Yearbook , Ibbotson Associates, Chicago (annually updated work by Roger G. Ibbotson and Rex A. Sinquefield).7
US StocksThird Quarter 2020 Index ReturnsThe US equity market posted positive returns for the quarter,Ranked Returns (%)outperforming non-US developed markets but underperformingemerging markets.Large GrowthValue underperformed growth across large and small capstocks.13.22Large Cap9.47MarketwideSmall caps underperformed large caps.REIT indices underperformed equity market indices.9.21Small Growth7.16Large Value5.59Small CapSmall ValueWorld Market Capitalization—US57%US Market 33.2 trillion4.932.56Period Returns (%)* AnnualizedAsset ClassYTD1 Year3 Years**Large Growth24.3337.5321.6720.1017.25Large 513.6913.48Small Small Cap5 Years** 10 Years**Large Value-11.58-5.032.637.669.95Small Value-21.54-14.88-5.134.117.09Past performance is not a guarantee of future results. Indices are not available for direct investment. Index performance does not reflect the expenses associated with the management of an actual portfolio.Market segment (index representation) as follows: Marketwide (Russell 3000 Index), Large Cap (Russell 1000 Index), Large Cap Value (Russell 1000 Value Index), Large Cap Growth (Russell 1000 Growth Index), Small Cap(Russell 2000 Index), Small Cap Value (Russell 2000 Value Index), and Small Cap Growth (Russell 2000 Growth Index). World Market Cap represented by Russell 3000 Index, MSCI World ex USA IMI Index, and MSCIEmerging Markets IMI Index. Russell 3000 Index is used as the proxy for the US market. Dow Jones US Select REIT Index used as proxy for the US REIT market. Frank Russell Company is the source and owner of thetrademarks, service marks, and copyrights related to the Russell Indexes. MSCI data MSCI 2020, all rights reserved.8
International Developed StocksThird Quarter 2020 Index ReturnsDeveloped markets outside the US posted positive returns forRanked Returns (%)Local currencyUS currencythe quarter but underperformed US and emerging marketsequities.6.61Small Cap10.12Value underperformed growth.Small caps outperformed large caps.5.02Growth8.511.48Large Cap4.92Value -2.051.35World Market Capitalization—International Developed30%InternationalDeveloped Market 17.6 trillionPeriod Returns (%)* AnnualizedAsset ClassYTD1 Year3 Years**5 Years**Growth5.1313.647.069.096.61Small Cap-4.056.881.427.356.55Large alue10 Years**Past performance is not a guarantee of future results. Indices are not available for direct investment. Index performance does not reflect the expenses associated with the management of an actual portfolio.Market segment (index representation) as follows: Large Cap (MSCI World ex USA Index), Small Cap (MSCI World ex USA Small Cap Index), Value (MSCI World ex USA Value Index), and Growth (MSCI World ex USAGrowth Index). All index returns are net of withholding tax on dividends. World Market Cap represented by Russell 3000 Index, MSCI World ex USA IMI Index, and MSCI Emerging Markets IMI Index. MSCI World ex USA IMIIndex is used as the proxy for the International Developed market. MSCI data MSCI 2020, all rights reserved. Frank Russell Company is the source and owner of the trademarks, service marks, and copyrights related to theRussell Indexes.9
Emerging Markets StocksThird Quarter 2020 Index ReturnsEmerging markets posted positive returns for the quarter,Ranked Returns (%)Local currencyUS currencyoutperforming the US and developed ex US equity markets.Value underperformed growth.13.31Growth14.15Small caps outperformed large caps.10.51Small Cap11.858.65Large Cap9.563.68Value4.66World Market Capitalization—Emerging MarketsPeriod Returns (%)Asset Class12%Emerging Markets 7.1 trillion* AnnualizedYTD1 Year3 Years**5 Years**Growth12.4127.807.4513.265.29Large .23-5.70-2.894.45-0.44Small CapValue10 Years**Past performance is not a guarantee of future results. Indices are not available for direct investment. Index performance does not reflect the expenses associated with the management of an actual portfolio.Market segment (index representation) as follows: Large Cap (MSCI Emerging Markets Index), Small Cap (MSCI Emerging Markets Small Cap Index), Value (MSCI Emerging Markets Value Index), and Growth (MSCIEmerging Markets Growth Index). All index returns are net of withholding tax on dividends. World Market Cap represented by Russell 3000 Index, MSCI World ex USA IMI Index, and MSCI Emerging Markets IMI Index. MSCIEmerging Markets IMI Index used as the proxy for the emerging market portion of the market. MSCI data MSCI 2020, all rights reserved. Frank Russell Company is the source and owner of the trademarks, service marks,and copyrights related to the Russell Indexes.10
Select Market PerformanceThird Quarter 2020 Index ReturnsIn US dollar terms, Sweden and Denmark recorded the highest country performance in developed markets, while Portugal and Spain posted the lowestreturns for the quarter. In emerging markets, India and Pakistan recorded the highest country performance, while Turkey and Thailand posted the lowestperformance.Ranked Developed Markets Returns CanadaNetherlandsSwitzerlandAustraliaNew ZealandBelgiumFranceItalyHong l 5.604.043.593.143.002.772.302.070.850.24Ranked Emerging Markets Returns (%)IndiaPakistanTaiwanKoreaChinaSaudi ArabiaQatarMalaysiaUAEMexicoSouth 27Czech .39Turkey 034.274.203.532.991.00Past performance is not a guarantee of future results. Indices are not available for direct investment. Index performance does not reflect the expenses associated with the management of an actual portfolio.MSCI Index returns are in USD net of dividend withholding taxes. Country returns are the country component indices of the MSCI All Country World ex USA IMI for all countries except the United States, where the Russell 3000index is used instead. Frank Russell Company is the source and owner of the trademarks, service marks and copyrights related to the Russell Indexes. MSCI data MSCI 2020, all rights reserved. Indices are not available fordirect investment. Their performance does not reflect the expenses associated with the management of an actual portfolio. Past performance is not a guarantee of future results.11
Select Currency Performance vs. US DollarThird Quarter 2020In developed markets, all currencies appreciated versus the US dollar. In emerging markets, currency performance versus the US dollar was mixed. Mostcurrencies generally appreciated versus the US dollar, but some, notably the Turkish lira and Russian ruble, depreciated.Ranked Developed Markets (%)Ranked Emerging Markets (%)British pound (GBP)4.63Danish krone (DKK)4.54Euro (EUR)4.41Australian dollar (AUD)4.10Swedish krona (SEK)4.10Swiss franc (CHF)3.13Norwegian krone (NOK)3.10New Zealand dollar (NZD)2.68Japanese yen (JPY)2.23Singapore dollar (SGD)2.19Canadian dollar (CAD)1.97Israeli new shekel (ILS)Hong Kong dollar (HKD)1.190.01Mexican peso (MXN)South African rand (ZAR)Chilean peso (CLP)Chinese renminbi (CNY)Malaysian ringgit (MYR)Korean won (KRW)Philippine peso (PHP)Czech koruna (CZK)Egyptian pound (EGP)Indian rupee (INR)Polish zloty (PLN)Hungarian forint (HUF)New Taiwan dollar (TWD)Pakistani rupee (PKR)Saudi Arabian riyal (SAR)Peruvian sol (PEN)Thai baht (THB)Brazilian real (BRL)Colombian peso (COP)Indonesian rupiah (IDR)Argentinian peso (ARS)Russian ruble (RUB)Turkish lira -11.03Past performance is not a guarantee of future results. Indices are not available for direct investment. Index performance does not reflect the expenses associated with the management of an actual portfolio.MSCI data MSCI 2020, all rights reserved.12
Real Estate Investment Trusts (REITs)Third Quarter 2020 Index ReturnsUS real estate investment trusts underperformed non-USRanked Returns (%)REITs during the quarter.Global ex US REITSUS REITSTotal Value of REIT StocksWorld ex US 435 billion268 REITs(23 othercountries)0.83* AnnualizedPeriod Returns (%)Asset Class39%4.5761%YTD1 Year3 Years**5 Years** 10 Years**US REITS-21.36-22.33-1.851.997.03Global ex US REITS-21.84-18.37-1.621.674.13US 681 billion115 REITsPast performance is not a guarantee of future results. Indices are not available for direct investment. Index performance does not reflect the expenses associated with the management of an actual portfolio.Number of REIT stocks and total value based on the two indices. All index returns are net of withholding tax on dividends. Total value of REIT stocks represented by Dow Jones US Select REIT Index and the S&P Global ex USREIT Index. Dow Jones US Select REIT Index used as proxy for the US market, and S&P Global ex US REIT Index used as proxy for the World ex US market. Dow Jones and S&P data 2020 S&P Dow Jones Indices LLC, adivision of S&P Global. All rights reserved.13
CommoditiesThird Quarter 2020 Index ReturnsThe Bloomberg Commodity Index Total Return returned 9.07%Ranked Returns (%)for the third quarter of 2020.Lean hogsLean hogs and Silver were the best performers, returning30.76Silver30.76% and 25.06%, respectively.25.06ZincLow sulfur gas and Heating oil were the worst performers,declining 9.27% and 7.51%, respectively.16.71Soybeans16.01Soybean meal15.85Wheat15.48Soybean oil14.99Natural gas14.93Nickel13.01Kansas wheat12.81Copper* AnnualizedPeriod Returns (%)Asset ClassCommoditiesQTRYTD9.07 -12.081 Year 3 Years** 5 Years** 10 67Aluminum7.16Live cattle7.13Sugar6.93Corn6.65Unleaded gas5.57Gold3.60WTI crude oil0.81Brent crude oilHeating oil-0.26-7.51Low sulphur gas oil -9.27Past performance is not a guarantee of future results. Index is not available for direct investment. Index performance does not reflect the expenses associated with the management of an actual portfolio.Commodities returns represent the return of the Bloomberg Commodity Total Return Index. Individual commodities are sub-index values of the Bloomberg Commodity Total Return Index. Data provided by Bloomberg.14
Fixed IncomeThird Quarter 2020 Index ReturnsInterest rate changes were mixed in theUS Treasury Yield Curve (%)Bond Yield across Issuers (%)US Treasury fixed income market duringthe third quarter. The yield on the 5-year4.002.40US Treasury note decreased by 3 basispoints (bps), ending at 0.31%. The yield2.163.00on the 10-year US T-note rose by 3 bpsto 0.64%. The 30-year US T-bond yield1.569/30/20192.009/30/20206/30/2020increased by 5 bps to 1.46%.0.691.00On the short end of the yield curve, the1-month US Treasury bill yielddecreased to 0.08%, while the 1-year Tbill yield decreased by 5 bps to 0.14%.0.001Yr5Yr10Yr30Yr10-Year USTreasuryState he 2-year US T-note yield finished at0.09% after a decrease of 2 basis points.Period Returns (%)*AnnualizedIn terms of total returns, short-termAsset ClassQTRYTD1 Year3 Years** 5 Years**10 Years**corporate bonds returned 0.92% for theBloomberg Barclays US High Yield Corporate Bond Index4.600.623.254.216.796.47quarter. Intermediate-term corporatesBloomberg Barclays US TIPS Index3.039.2210.085.794.613.57returned 1.33%.FTSE World Government Bond Index 1-5 Years2.014.165.212.032.010.21Bloomberg Barclays Municipal Bond Index1.233.334.094.283.843.99The total return for short-term municipalBloomberg Barclays US Aggregate Bond Index0.626.796.985.244.183.64bonds was 0.83%, while intermediateFTSE World Government Bond Index 1-5 Years (hedged to USD)0.243.043.223.022.311.90munis returned 1.40%. Revenue bondsBloomberg Barclays US Government Bond Index Long0.1321.1316.2111.798.187.18outperformed general obligation bonds.ICE BofA 1-Year US Treasury Note Index0.081.772.372.191.540.93ICE BofA US 3-Month Treasury Bill Index0.040.641.101.691.200.64One basis point (bps) equals 0.01%. Past performance is not a guarantee of future results. Indices are not available for direct investment. Index performance does not reflect the expenses associated with themanagement of an actual portfolio. Yield curve data from Federal Reserve. State and local bonds are from the S&P National AMT-Free Municipal Bond Index. AAA-AA Corporates represent the Bank of America Merrill LynchUS Corporates, AA-AAA rated. A-BBB Corporates represent the ICE BofA Corporates, BBB-A rated. Bloomberg Barclays data provided by Bloomberg. US long-term bonds, bills, inflation, and fixed income factor data Stocks,Bonds, Bills, and Inflation (SBBI) Yearbook , Ibbotson Associates, Chicago (annually updated work by Roger G. Ibbotson and Rex A. Sinquefield). FTSE fixed income indices 2020 FTSE Fixed Income LLC, all rightsreserved. ICE BofA index data 2020 ICE Data Indices, LLC. S&P data 2020 S&P Dow Jones Indices LLC, a division of S&P Global. All rights reserved.15
Global Fixed IncomeThird Quarter 2020 Yield CurvesUSUK4.0rates in the global developed markets3.03.0were mixed for the quarter.2.0Longer-term bonds generallyoutperformed shorter-term bonds in9/30/20206/30/20201.00.0Yield (%)4.0Yield (%)Changes in Government bond interest-1.0global ex-US developed 0Y1Y5YYears to Maturity10Y20Y30YYears to MaturityShort- and intermediate-term nominalinterest rates were negative in Japan,Germanywhile all maturities finished the ield (%)Yield (%)in negative territory in 0Y20Y30Y1Y5YYears to .60.212.2-5.1Yield -2.1-14.520Y30YYears to 1.00.0-1.0Yield (%)Changes in Yields (bps) since 20YYears to MaturityOne basis point (bps) equals 0.01%. Source: ICE BofA government yield. ICE BofA index data 2020 ICE Data Indices, LLC.30Y1Y5Y10Y20Y30YYears to Maturity16
Impact of DiversificationThird Quarter 2020Ranked Returns (%)These portfolios illustrate the performance of different globalstock/bond mixes and highlight the benefits of diversification.100% StocksMixes with larger allocations to stocks are considered riskierbut have higher expected returns over time.8.2575/256.2150/504.1525/75100% Treasury Bills2.090.03Growth of Wealth: The Relationship between Risk and ReturnStock/Bond Mix 120,000100%Stocks 100,000Period Returns (%)* Annualized75/25 80,000Asset Class10-YearYTD 1 Year 3 Years** 5 Years** 10 Years** STDEV¹75/251.908.896.408.587.1210.28 60,00050/50100% Stocks1.7711.007.6810.909.1313.71 .783.323.652.823.42 20,000100% Treasury Bills0.420.831.541.070.550.23100%TreasuryBills 1. STDEV (standard deviation) is a measure of the variation or dispersion of a set of data points. Standard deviations are often used to quantify the historical return volatility of a security or portfolio.Diversification does not eliminate the risk of market loss. Past performance is not a guarantee of future results. Indices are not available for direct investment. Index performance does not reflect expenses associatedwith the management of an actual portfolio. Asset allocations and the hypothetical index portfolio returns are for illustrative purposes only and do not represent actual performance. Global Stocks represented by MSCI AllCountry World Index (gross div.) and Treasury Bills represented by US One-Month Treasury Bills. Globally diversified allocations rebalanced monthly, no withdrawals. Data MSCI 2020, all rights reserved. Treasury bills Stocks, Bonds, Bills, and Inflation Yearbook , Ibbotson Associates, Chicago (annually updated work by Roger G. Ibbotson and Rex A. Sinquefield).17
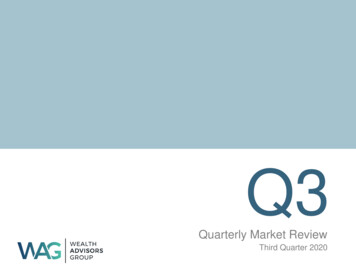
When It’s Value vs. Growth,History Is on Value’s SideThird Quarter 2020Logic and data provide the basis for a positive expected value premium,offering a guide for investors targeting higher potential returns. There ispervasive historical evidence of value stocks outperforming growth stocks.Data covering nearly a century in the US, and nearly five decades of marketdata outside the US, support the notion that value stocks— those with lowerrelative prices—have higher expected returns.Exhibit 1. Value AddYearly observations of premiums: value minus growth in US markets, 1928–2019Recently, growth stocks have enjoyed a run of outperformance vs. their valuecounterparts. But while disappointing periods emerge from time to time, theprinciple that lower relative prices lead to higher expected returns remains thesame. On average, value stocks have outperformed growth stocks by 4.54%annually in the US since 1928, as Exhibit 1 shows.Some historical context is helpful in providing perspective for growth stocks’recent outperformance. As Exhibit 1 demonstrates, realized premiums arehighly volatile. While periods of underperformance are disappointing, they arealso within the range of possible outcomes.We believe investors are best served by making decisions based on soundeconomic principles supported by a preponderance of evidence. Valueinvesting is based on the premise that paying less for a set of future cash flowsis associated with a higher expected return. That’s one of the mostfundamental tenets of investing. Combined with the long series of empiricaldata on the value premium, our research shows that value investing continuesto be a reliable way for investors to increase expected returns going forward.Past performance is no guarantee of future results. Investing risks include loss ofprincipal and fluctuating value. There is no guarantee an investment strategy will besuccessful. Indices are not available for direct investment. Their performance does notreflect the expenses associated with the management of an actual portfolio.In US dollars. Yearly premiums are calculated as the difference in one-year returns between the two indicesdescribed. Value minus growth: Fama/French US Value Research Index minus the Fama/French USGrowth Research Index.Fama/French US Value Research Index: Provided by Fama/French from CRSP securities data. Includesthe lower 30% in price-to-book of NYSE securities (plus NYSE Amex equivalents since July 1962 andNasdaq equivalents since 1973).Please see the end of this document for important disclosures.Fama/French US Growth Research Index: Provided by Fama/French from CRSP securities data. Includesthe higher 30% in price-to-book of NYSE securities (plus NYSE Amex equivalents since July 1962 andNasdaq equivalents since 1973).18
When It’s Value vs. Growth,History Is on Value’s Side(continued from page 18)GLOSSARYUNITED STATES: Dimensional Fund Advisors LP is an investment advisor registered withthe Securities and Exchange Commission.Value Stock: A stock trading at a low price relative to a measure offundamental value such as book equity.CANADA: These materials have been prepared by Dimensional Fund Advisors Canada ULC.Commissions, trailing commissions, management fees, and expenses all may be associatedwith mutual fund investments. Unless otherwise noted, any indicated total rates of returnreflect the historical annual compounded total returns, including changes in share or unitvalue and reinvestment of all dividends or other distributions, and do not take into accountsales, redemption, distribution, or optional charges or income taxes payable by any securityholder that would have reduced returns. Please read the prospectus before investing. Mutualfunds are not guaranteed, their values change frequently, and past performance may not berepeated.Growth Stock: A stock trading at a high price relative to a measure offundamental value such as book equity.Value Premium: The return difference between stocks with low relative prices(value) and stocks with high relative prices (growth).DISCLOSURESEugene Fama and Ken French are members of the Board of Directors of the general partnerof, and provide consulting services to, Dimensional Fund Advisors LP.The information in this document is provided in good faith without any warranty and isintended for the recipient’s background information only. It does not constitute investmentadvice, recommendation, or an offer of any services or products for sale and is not intendedto provide a sufficient basis on which to make an investment decision. It is the responsibility ofany persons wishing to make a purchase to inform themselves of and observe all applicablelaws and regulations. Unauthorized copying, reproducing, duplicating, or transmitting of thisdocument are strictly prohibited. Dimensional accepts no responsibility for loss arising fromthe use of the information contained herein.RISKSInvestments involve risks. The investment return and principal value of aninvestment may fluctuate so that an investor’s shares, when redeemed,may be worth more or less than their original value. Past performance isnot a guarantee of future results. There is no guarantee strategies will besuccessful.The information in this document is provided
World Market Cap represented by Russell 3000 Index, MSCI World ex USA IMI Index, and MSCI Emerging Markets IMI Index. Russell 3000 Index is used as the proxy for the US market. Dow Jones US Select REIT Index used as proxy for the US REIT market. Frank Russell Company is the source and owner of the