Transcription
2015-2016 BUDGET EXECUTIVE SUMMARYOFFICE OF BUDGET AND PLANNING
George Mason UniversityTotal Budget, 2015-2016Executive SummaryTable of ContentsBUDGET SUMMARYOVERVIEW .1Budget Highlights, FY 2016 .1Annual Change: All Programs .3All Funds—All Sources—Revenue .4All Funds—All Uses—Outlay .5Institutional Profile .7Performance Measures .15Institutional Performance Standards .19Six-Year Plans .21Strategic Plan .22EDUCATIONAL & GENERAL .29Educational and General Revenues .29Funds Available For Allocation (Sources) .34Use of Funds / Expenses .35Educational & General Budget by Unit .39AUXILIARY ENTERPRISES .41Auxiliary Enterprises Revenues .41New Student Fee Requirements .45Use of Funds / Expenses .47Summary of Auxiliary Enterprises Operating Budget .53TUITION AND FEES .55STUDENT FINANCIAL ASSISTANCE.61SPONSORED RESEARCH .69CAPITAL OUTLAY .75BUDGET DETAILSEDUCATIONAL & GENERAL DETAIL BY MAJOR UNIT .79AUXILIARY ENTERPRISES DETAIL BY MAJOR UNIT .103i
Members of the George Mason University Budget Planning TeamMs. Jennifer (J.J.) Wagner Davis and Dr. S. David Wu, Co-chairsMs. Janet BinghamMr. David BurgeMr. Thomas CalhounMs. Lisa KempMr. Paul LibertyDr. Michelle MarksMs. Rose PascarellMs. Marilyn SmithEx officioSupport StaffMr. David Moore, Chief Budget OfficerMs. Barbara ClarkMr. Frank Neville, Chief of StaffMs. Kim DightDr. Mark Houck, Faculty Senate RepresentativeMs. Renate GuilfordMs. Patrice MuscoOffice of Budget and PlanningContributions by other departments:Ms. Jieping LiDr. Kris Smith—Institutional Research & ReportingMs. Monica MichaudMs. Carol Brosseau—Student Financial AidMs. Dorian MrozMr. Mike Laskofski, Ms. Kimberly Maze—Office of Sponsored ProgramsMr. David OlerMr. Mark StahleyMs. Tracy WilliamsMs. Li Zhouii
GEORGE MASON UNIVERSITYTOTAL BUDGET, 2015–2016BUDGET HIGHLIGHTS The total university budget for FY 2016 is 977.6 million, a 3.4 percent increase compared to the FY2015 budget. The FY 2016 budget comprises 877.4 million operating, 18.7 million state-supportedfinancial aid, and 81.5 million in capital outlay. Compared to the FY 2015 budget, the operatingbudget increases by 3.2 percent, most notably including a 13.2 percent increase in PhilanthropicActivities. State-supported financial aid funds will increase by approximately 7.2 percent forundergraduate need-based awards, and Capital Outlay will increase by 4.2 percent as planning andconstruction progresses for Academic VII, Fenwick Library, Potomac Science Center, and the CentralPlant expansion. New to this year’s operating budget is a one-time funding allocation from carryforward funds of 2.7million that will be targeted toward faculty retention and compensation funding in the form of a onetime bonus along with 1.0 million set aside for a new Mason Student Access Initiative. This newinitiative will help address the needs of our students to have the opportunity to be successful duringtheir educational career. Senior administrators and students are working together to define the use ofthese funds. Early discussions with students suggest the funds could provide additional financial aid,expansion of targeted programs and services, or other support that will help our students have accessto an affordable and quality education. Mason continues to be the largest university in the Commonwealth with a headcount of 33,791, or 8.2percent greater than the next largest university. Mason welcomed its largest freshman class ofapproximately 3,091 during fall of 2014 and enrolled approximately 16 percent of the total headcountacross Virginia’s 15 institutions of higher education. Mason’s demand remains strong with over8,300 new degree-seeking students in FY 2015. Like most institutions of higher education, Masonhas experienced a shifting and competitive enrollment landscape over recent fiscal years. In FY2016, overall enrollment and revenues will remain stable with the majority of the revenue changescoming from the proposed tuition and fee rate increase. Serving a large diverse student populationrequires investment in services and programs to maintain and balance an accessible, affordable, andhigh quality education for our students. The total price for an in-state undergraduate student living on-campus (including tuition, fees, room,and board) is 21,462 which is a 4.8 percent increase and the total price for an out-of-stateundergraduate student living on-campus will be 42,108, a 5.1 percent increase over the previousyear. Institutional financial aid for undergraduates increases by 17.1 percent which includes thecontinuation and expansion of out-of-state leveraging grant funds consistent with the tuition pricingstrategy study for both undergraduate and graduate enrollments. Total institutional aid increases by17.2 percent or approximately 5.8 million. The combination of Commonwealth and institutionalfinancial aid will increase by 13.8 percent or approximately 7.0 million.1
GEORGE MASON UNIVERSITYTOTAL BUDGET, 2015–2016BUDGET HIGHLIGHTS, (CONTINUED) Compared to the FY 2015 budget, total FY 2016 Educational & General (E&G) budgetSOURCES increase by 10.3M or 2.2%. External subsidies from state appropriations increase by 1.2 million in FY 2016. The change inappropriations is comprised of a 4.7 million decrease experienced in FY 2015 that was madepermanent in FY 2016. Additional resources were provided for an overall increase in costs for astate-supported salary increase and rising costs in both healthcare and pension rates. GeneralFund appropriations provide approximately 27 percent of the total E&G operating funds. E&G funding from one-time sources (fund balance carried forward from prior fiscal years)decreases by 3.3 million in FY 2016, which concludes the Bridge Funding Strategy that wascreated in FY 2012. FY 2016 Educational & General (E&G) budget USES increase by 10.3M or 2.2%. The budget reflects 13.1 million in additional compensation, including 1) funding for new keyfaculty hires; 2) state-supported salary plan increase and employer paid health insurance premiumand pension increases; and 3) funding for faculty retention, promotion, and tenure. Non-personnel budgets reflect 12.5 million additional support for 1) state-supported six-yearplan initiatives for pathways in cybersecurity and nursing, along with funding to support theSmall Business Center and the Hylton Performing Arts Center; 2) investment in Mason’sstrategic plan initiatives; 3) investment in research; 4) academic program and service funding; 5)contractual escalation costs; and 6) additional merit-based student financial aid. The E&G budget includes efforts to drive down costs and repurpose the base budget through costcontainment, efficiencies, and organizational restructuring that total 15.3 million. Auxiliary Enterprise (AE) revenue in FY 2016 will increase by 4.5 percent or 10.4 million with anincrease in student fee revenue of 2.3 million and in self-generated revenues of approximately 11.9million. Mason projects a decrease of 3.8 million for AE—Independent Operations. The FY 2016AE budget includes an increase for new capacity in student housing, additional meal plan revenues,and additional fee revenue primarily due to a student fee rate increase. Operating expense increasesare primarily due to the required state-supported salary and total compensation increases and tosupport debt service and growth in overall operating costs. Sponsored Research activity in FY 2016 is projected to total 102.6 million, which is approximately a2 percent decrease over the level originally projected for FY 2015. The effects of federal budgetconstraints, while not yet fully known, have been anticipated in making this projection. Althoughprojected expenditures are being revised to reflect recent experience, overall research proposalsubmissions continue to increase and awards remain stable under these relatively unpredictableeconomic conditions. Within this projection is an increase of 0.6 million in state-supported researchactivity to support Modeling and Simulation research and Lyme Disease Test development.2
ANNUAL CHANGE: ALL PROGRAMSThis Executive Summary summarizes an all funds view of the budget plans for FY 2016. It describes thepriorities of the institution and how financial resources for FY 2016 have been allocated to support thosepriorities. Key performance metrics and trends are included to provide context for budget allocation decisions.The overall university budget will increase by approximately 3.4 percent when compared to the FY 2015original budget. As shown in the summary table below, Mason’s FY 2016 operating budget increases by 3.2percent, State Financial Assistance increases by 7.2 percent, and the Capital budget increases by 4.2 percent.In addition, a new program category has been included for FY 2016. The one-time funds will help providesupport for retention and compensation as well as the new Mason Student Access Initiative fund that will beallocated as Mason leadership works with students over the summer and early fall.PROGRAM( in Millions)Educational &General (E&G)*PhilanthropicActivitiesAuxiliaryEnterprises GState StudentFinancial Assist.CapitalOutlayTOTAL*BUDGETFY 2012BUDGETFY 2013BUDGETFY 2014BUDGETFY 2015BUDGETFY 2016FY15 TOFY16 %CHANGE 409.6 447.4 456.8 475.1 100% 749.3 779.8 813.7 850.1 81.54.2% 876.3 888.0 911.0 945.7 977.63.4%All years include Equipment Trust Funds (ETF).TOTAL UNIVERSITY BUDGET, FY 2016 . 977.6M3
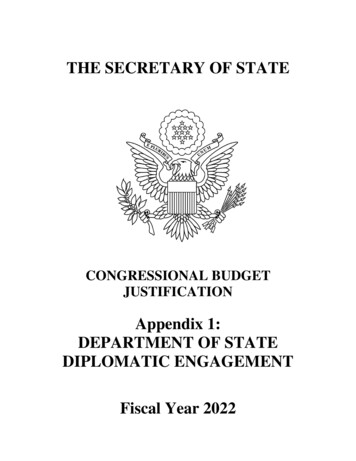
ALL FUNDS—ALL SOURCES—REVENUEThe total FY 2016 revenue budget for Mason is projected to be 977.6M. The revenue that supports theMason budget is derived from six major sources in addition to one-time funds. For Sponsored Research andCapital Outlay, consistent with Governmental Accounting Standards Board (GASB) accounting standards,revenues are reported to the extent of actual expenditures.All Other Activities, 28%*VA StateFunding, 23%Note 1: VA State Funding includes Educational & General of 128.4M, Capital Improvements of 75.1M (includingMaintenance Reserve of 3.4M and Equipment Trust Fund of 3.6M), and State Financial Aid of 18.7M.4
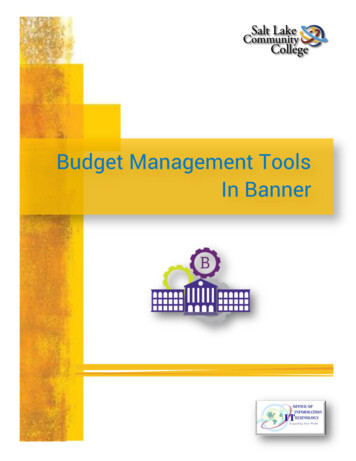
ALL FUNDS—ALL USES—OUTLAYThe FY 2016 spending plan is also established at 977.6M. All budgeted funds will be expended for actualoperating costs and capital projects or be allocated to reserves for facility depreciation or contingency needs.Funds are expended within five programs recognized distinctly by the state. The one-time funding includedin the FY 2016 budget plan will be expended across these five programs as it will be used for retention andcompensation as well as a new Mason Access Strategic Initiatives fund.All OtherActivities, 25%5
GEORGE MASON UNIVERSITYCHANGE IN OPERATING FUNDSFY 2015 ORIGINAL BUDGET – FY 2016 BUDGETFY 2016 BudgetFY 2015 Original BudgetBUDGET CHANGE(Dollars in Millions)SOURCE OF FUNDSNet Tuition RevenueTuition revenue (FY 2015 revenue levels with rate increase)Enrollment growth revenue eliminating Bridge Funding StrategyLeveraging fundingUndergraduate and Graduate Financial Aid (including Law School)Philanthropic ActivitiesStudent Fee RevenueState support – General FundSelf-Supporting programs – Auxiliary EnterprisesSponsored ResearchResearch contracts and grants (based on spending levels)State Research (Modeling and Simulation & Lyme Disease Test)One-Time FundsTOTAL INCREASED (DECREASED) REVENUESUSE OF FUNDSCompensation – Faculty and StaffEmployer benefit cost increase for health insurance and pensionSelf-Supporting programs - Auxiliary Enterprises(includes Housing and Board operational cost increases)GMU Foundation support for MasonStrategic Plan initiatives *Strategic Plan initiativesResearch investmentProgram and services enhancement fundingContractual cost escalation and facility support (includes library materials)Faculty compensation & retention efforts (mid-year one-time bonus)All other self-supporting activitiesMason Student Access Initiative funding (one-time)Facility debt service and maintenanceStudent Financial Aid (merit-based)Research contracts and grantsCost containment, efficiencies, and organizational restructuring 877.4850.1 27.3 9.117.3(3.3)(3.2)(1.7)5.02.31.28.1(2.1)(2.7)0.63.7 27.3 9.63.28.15.05.04.01.0TOTAL INCREASED (DECREASED) EXPENSES*Strategic Plan initiatives include, but may not be limited to, research, executive education, distanceeducation, strategic new key faculty hires, graduate admissions process, and other key initiatives.64.22.72.71.31.01.00.9(2.1)(15.3) 27.3
INSTITUTIONAL PROFILENEW STUDENT SELECTIVITY AND INSTITUTIONAL ATTRACTIVENESSStudent Quality: The tables that follow illustrates that Mason has become more selective in its admissionpolicies as evidenced by the increase in both the SAT and GPA of incoming students. Taken together, theyindicate the increasing competitiveness in higher education.FIRST-TIME FRESHMEN – HEADCOUNTFALL 2007–FALL 58FALL200913,7328,6912,656FALL2010 ,53215,0173,080Transfer ApplicantsTransfer AdmitsTransfer 4394,0352,5476,6403,6782,465Graduate ApplicantsGraduate AdmitsGraduate 110,1975,5472,8539,4625,2222,757Law ApplicantsLaw AdmitsLaw 824165Freshmen ApplicantsFreshmen AdmitsFreshmen EnrolledSource: Office of Institutional Research and Reporting*Students applying for the International Access program that began in fall 2010 are excluded from these figures.7
FIRST-TIME FRESHMENQUALITY INDICATOR TRENDSFALL 2007–FALL 2014FRESHMENAPPLIED20072008AVERAGEHS 9FRESHMENADMITTEDAVERAGEHS 43.731184FRESHMENENROLLEDAVERAGEHS 43.6511538
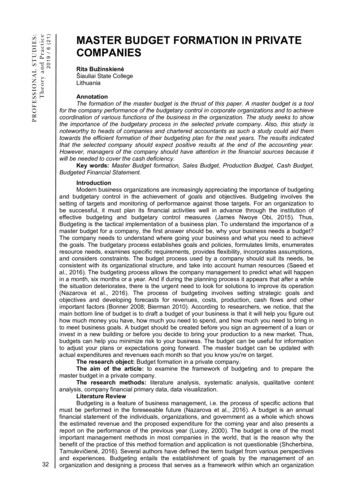
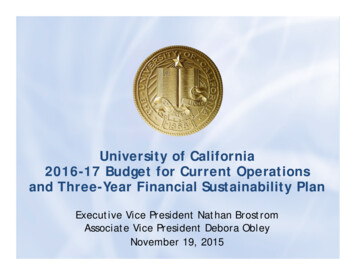
INSTITUTIONAL SIZE: STUDENT ENROLLMENT (HEADCOUNT)In fall 2003, Mason became the largest university in the Commonwealth, with a headcount of 28,426. Masoncontinues to be the largest university in the Commonwealth, with a headcount of 33,791 (see chart below), 8.2percent greater than the next largest university. In the fall of 2014, Mason enrolled approximately 16 percentof the total headcount across Virginia’s 15 public institutions of higher education.VIRGINIA PUBLIC INSTITUTIONSOF HIGHER EDUCATIONFALL 2014, STUDENT HEADCOUNT33,79135,00031,163 43710,0005,0009,7986,0274,535 5,025 5,096 5,2211,700 2,1820TOTAL HEADCOUNT STUDENT ENROLLMENT - 213,71878% of the student enrollment is at the six largest institutions9
Mason serves a diverse student population that comprises different academic levels, domicile, full- to parttime course work, first generation college goers, underrepresented racial and ethnic populations, and variousage groups. Below are a few graphs that demonstrate Mason’s diverse student profile.UndergraduateGraduate34%66%In StateOut of State18%82%Full TimePart Time35%65%10
INSTITUTIONAL SIZE: UNDERGRADUATE ENROLLMENT (HEADCOUNT)Mason serves a diverse population with a board array of needs which require investments. Mason’sundergraduate student population is approximately 66 percent or 22,340 of the total headcount.First GenerationOther33%67%Underrepresented Racial/EthnicOther50%50%Over Age 25 at EntryOther15%85%11
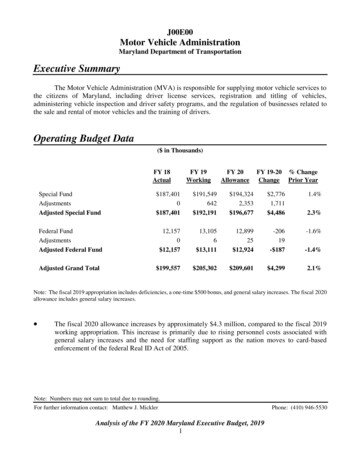
INSTITUTIONAL SIZE: STUDENT ENROLLMENT (FTE)When looking at full-time equivalent (FTE) enrollment, George Mason University is the third largestinstitution behind Virginia Tech and Virginia Commonwealth University (see below). The actual annualizedenrollment for FY 2014 shown here is the most current actual enrollment data available for other Virginiainstitutions.35,000VIRGINIA PUBLIC INSTITUTIONSOF HIGHER EDUCATIONSTUDENT (FTE) ENROLLMENT, FY 201430,00031,90627,338 9510,0005,9865,135 5,4984,364 4,7645,0001,800 1,8930TOTAL STUDENT (FTE) ENROLLMENT - 198,82376% of the student enrollment is at the six largest institutions12
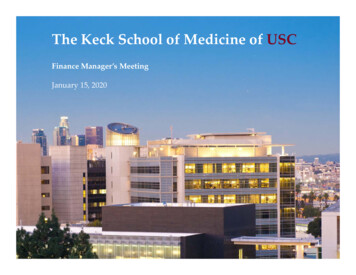
RECENT STUDENT ENROLLMENT GROWTHDespite certain years with General Fund budget reductions, George Mason University has continued to growin an effort to meet the increasing demand for higher education associated with the growing number ofVirginia high school graduates. Mason has assumed almost a quarter (23.7 percent) of the statewideenrollment growth accommodated in Virginia public four-year institutions since fall 2006.VIRGINIA PUBLIC INSTITUTIONSOF HIGHER EDUCATION4,000STUDENT GROWTH (HEADCOUNT) FALL 2006-FALL 20143,9023,4623,3073,500Student Growth (HC)3,0002,7542,5002,0001,5001,000578500-336 -327 -211 1532713236177287824280-500Virginia Public InstitutionsThe net growth for all Virginia public institutions from fall 2006 to fall 2014 was 16,431, and George Masonhas enrolled 3,902 of this growth.13
STUDENT RETENTIONOther indicators of improved student quality and program excellence are increased student persistence andgraduation rates. Improved retention also positively impacts student enrollment growth, since the number ofstudents continuing their college education after their first year increases.FIRST TIME FRESHMEN-PERSISTENCE & SIX-YEARGRADUATION RATES COHORTS, 1999-201360%52.8%66.9%66.7%65.9%64.4%87.2% 86.3% 87.3% 87.6%85.8% 85.9% 85.2%83.9% 84.7% 85.7%63.6%63.7%70%78.7% 79.9%59.9%75.5%56.1%80%82.2% 83.2%61.2%90%50%40%30%20%10%0%1999 2000 2001 2002 2003 2004 2005 2006 2007 2008 2009 2010 2011 2012 2013COHORT YEARFIRST-TIME FULL-TIME ar Graduation tence Rate (Progression & Retention)The most recent comparative data for first-year persistence rates for Mason's national peer group is for the2012 cohort as published from IPEDS. The percentage of Mason's 2012 cohort who returned for their secondyear was 87 percent; the peer average was 91 percent. Mason's six-year graduation rate for the 2007 cohortcompared to the peer group average is 67 percent to 77 percent respectively.14
PERFORMANCE MEASURESMason takes great pride in its regular assessment of a series of important operational indicators of institutionaleffectiveness.Total Core Funding per FTE StudentThe combination of General Fund support and tuition approximates the total funding available to teach a fulltime student. The 25 institutions shown below were approved for benchmarking by university and stateofficials as the schools most similar to Mason. As reported by the U.S. Department of Education IntegratedPostsecondary Education System (IPEDS), Mason has one of the lowest core funding levels per FTE studentamong this national peer group.FY 2013 GEORGE MASON UNIVERSITY PEER GROUP COMPARISONINSTITUTIONUniversity of Southern CaliforniaNew York UniversityUniversity of ConnecticutBoston UniversityUniversity of Washington—Seattle CampusGeorge Washington UniversityUniversity of North Carolina at Chapel HillRutgers University—New BrunswickStony Brook UniversitySyracuse UniversityUniversity of Minnesota—Twin CitiesNortheastern UniversitySUNY at AlbanyUniversity of KansasUniversity of Illinois at Urbana—ChampaignArizona State UniversityUniversity of FloridaTemple UniversityUniversity of Maryland—College ParkMichigan State UniversityNorth Carolina State University at RaleighUniversity of ArizonaUniversity of Massachusetts AmherstGeorge Mason UniversityUniversity of Nebraska—LincolnFlorida State UniversityPeer Group Average (Excluding Mason)Mason % of Peer Group 8,30127,95626,58821,19039,41334,09178.0%Source: FY 2013 IPEDS15CORE SPENDING PERSTUDENT 12,969 28,35662.9%
Funding Improvement: Statewide Comparison is Slowly ImprovingEach doctoral institution within the Commonwealth of Virginia has a unique mission, but fundingcomparisons present an interesting analysis. The following table illustrates both the institutional difference intotal funding within the Commonwealth of Virginia and the relationship between tuition and General Fundsupport at the Virginia doctoral universities. In terms of total funding, in FY 2016 Mason is operating withapproximately 75 percent of the total resources available to the other doctoral universities.EDUCATIONAL & GENERALESTIMATED TOTAL FUNDING PER IN-STATE FTE STUDENT, FY 2016General Fund, Tuition and Mandatory E&G FeesDOCTORALINSTITUTIONSCollege of William & MaryUniversity of VirginiaVirginia TechVirginia Commonwealth UnivOld Dominion*GENERAL FUNDFY 2016* 7,8338,4206,8936,7075,884IN-STATETUITION FY 2016 14,11412,34710,62810,7196,193TOTAL 21,94720,76717,52117,42612,077Doctoral Avg. excl. Mason 7,147 10,800 17,948GEORGE MASON 5,488 7,976 13,464Mason % of Average76.8%73.9%75.0%General Fund estimate based on SCHEV FTE projection in the 2B report; numbers for all institutions will changewith actual revised numbers. General Fund estimate includes budget reductions in FY 2016.Student: Faculty & Staff RatiosThe number of students (headcount) supported by the total number of faculty/staff positions (FTE) is anational benchmark for institutional effectiveness. Mason’s ratio remains more efficient than the averageratios at the other doctoral institutions in Virginia. Based on IPEDS Human Resource data for fall 2013 andthe State Council of Higher Education for Virginia (SCHEV) fall 2013 headcount enrollment data, thedifference between Mason’s number of total faculty and staff positions and the doctoral average isapproximately 2.4 students per faculty/staff member. In order for Mason to operate with the same averagenumber of positions per student as other Virginia doctoral institutions, Mason would have to add over 1,500new positions to its current staffing complement.DOCTORALINSTITUTIONSCollege of William & MaryUniversity of VirginiaVirginia TechVirginia Commonwealth UnivOld DominionSTUDENTS (HEADCOUNT) PERFACULTY &STAFF POSITION (FALL 2013 DATA)3.64.04.27.19.3Doctoral Average excluding Mason5.6GEORGE MASON UNIVERSITY8.0Source: IPEDS, SCHEV16
Faculty: Support Staff RatiosAnother ratio is the relationship of teaching positions to non-teaching positions. The FY 2016 budget forGeorge Mason University establishes the ratio of 1,858 teaching to 2,023 non-teaching positions atapproximately a 1:1.1 ratio, which is more efficient than the average for Mason’s national peer group.Student:Faculty RatiosMason strives to maintain a low student:faculty ratio. In the fall of 2014, the university’s ratio was 15.8:1.This ratio has slightly improved when compared to fall of 2013. The university’s high priority of smallerclasses and an improved student:faculty ratio has been constrained by limited resources since fall of 2008.STUDENT:FACULTY RATIO TREND AS OF FALLNote: Fall 2005-2014 uses Common Data Set reporting1720102011201220132014
Number of Academic Programs—Sharp FocusMason regularly reviews its academic offerings with a goal of maintaining a sharp focus in program offerings.Reviews lead to restructuring, merging, deleting, and adding programs as needed.Mason offers 59 percent of the average number of academic programs offered by the same peer group.ACADEMIC PROGRAM COMPARISONGEORGE MASON UNIVERSITY & PEER GROUPINSTITUTIONUniversity of ArizonaBoston UniversityArizona State University—Tempe CampusUniversity of Southern CaliforniaMichigan State UniversityUniversity of Washington—Seattle CampusUniversity of FloridaUniversity of Minnesota—Twin CitiesRutgers University—New Brunswick/PiscatawayNew York UniversitySyracuse UniversityUniversity of Illinois at Urbana—ChampaignTemple UniversityUniversity of Maryland—College ParkFlorida State UniversityUniversity of Kansas—Main CampusNorth Carolina State University at Raleigh (2010)University of Nebraska at LincolnGeorge Washington UniversityUniversity of North Carolina at Chapel HillUniversity of Massachusetts—AmherstUniversity of ConnecticutNortheastern UniversityStony Brook UniversityGeorge Mason UniversitySUNY at AlbanyAVERAGETOTALTOTALFALL 2013DEGREEHEADCOUNTPROGRAMSENROLLMENT OFFERED 2013 3,10920924,36120933,91720017,34018236,342342* The Total Degree Programs Offered is the total of Baccalaureate, Master’s, and Doctoral degrees. It does notinclude professional degrees such as Law.18
INSTITUTIONAL PERFORMANCE STANDARDSChanges to State Institutional Performance StandardsThe Virginia Higher Education Restructuring Act was implemented in 2006 to increase institutionalmanagement flexibility in exchange for meeting accountability standards. The Institutional PerformanceStandards are designed to track institutional progress in meeting state higher education priorities by gatheringinformation in a wide range of areas. With the passage of the Commonwealth’s 2011 Higher EducationOpportunity Act, these measures are undergoing a revision. The current version of the InstitutionalPerformance Measures was approved by the State Council of Higher Education for Virginia (SCHEV) at itsNovember 19, 2012 meeting to replace section §4-9.02 Assessment of Institutional Performance of the 2012Appropriation Act. Although the 2014 Legislative session has not concluded, it appears that section §4-9.02will go forward as approved by SCHEV. Under the Act, institutions will be expected to meet the IPSmeasures in order to qualify for incentive funding offered by the Commonwealth.The Institutional Performance Standard measures continue to focus on each institution’s contribution to theeducation of citizens of the Commonwealth. Institutions will be expected to meet 95 percent of the StateCouncil approved biennial projections on the following measures: in-state undergraduate headcount (HC) enrollment,in-state upper-level full-time equivalency (FTE) enrollment (juniors and seniors),in-state bachelor degree awards, andin-state bachelor degree awards in Science, Technology, Engineering, Math, and Health sciences(STEM/H).Two additional measures focus on access by requiring institutions to maintain or increase: the number of in-state associate and bachelor degrees awarded to students from under-representedpopulations, andthe number of in-state two-year transfers to four-year institutions: total those with an associate degree those with a guaranteed admission agreementThe State Council of Higher Education for Virginia will certify institutions based on these criteria and willrecommend the institutions eligible to receive financial benefits such as incentive funds.The table below provides a summary of how Mason has performed on the proposed measures over the pastfew years. Underrepresented student groups included: racial/ethnic minorities, Pell Grant recipients(economically underrepresented), first-generation college students, and students from selected under-servedcounties/cities within the Commonwealth. Mason has a history of graduating st
support for retention and compensation as well as the new Mason Student Access Initiative fund that will be allocated as Mason leadership works with students over the summer and early fall. PROGRAM ( in Millions) BUDGET FY 2012 BUDGET FY 2013 BUDGET FY 2014 BUDGET FY 2015 BUDGET FY 2016 FY15 TO FY16 % CHANGE Educational & General (E&G)* 409.6