Transcription
First-hand knowledge.Reading SampleThis sample chapter describes the reporting capabilities of Concur. Itcovers both the standard Concur Analysis offering, as well as ConcurIntelligence. It also describes how to build and edit reports usingtwo separate tools: Query Studio and Report Studio.“Concur Reporting”ContentsIndexThe AuthorsSven Ringling, Hannah Smith, and Andy WittmannConcur: Travel and Expense Management withSAP322 Pages, 2017, 79.95ISBN 978-1-4932-1456-3www.sap-press.com/4262
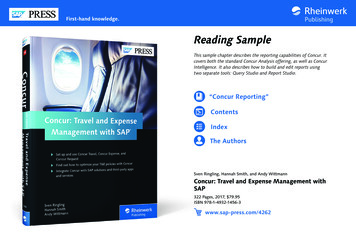
Chapter 6Concur’s reporting capabilities provide detailed insight into your T&Espending, allowing for both cost savings and increased efficiency for yourorganization.6Concur ReportingConcur’s reporting solution offers comprehensive insight into all your T&E data.Concur’s reporting uses IBM’s Cognos reporting solution, a web-based tool thatallows you to create queries, reports, and dashboards that can be run and viewedon desktops and mobile devices. It also allows you to extract and share reports inmultiple ways.The Cognos tool can report using simple queries; more complex, structured management-style ones; and interactive dashboards. Reports and queries can beexported into multiple formats, such as HTML, Excel, PDF, or CSV, and sharedusing distribution options such as report bursting. Data is updated from Concurinto Cognos by nightly batch jobs; thus, the data available in Concur reports willalways be correct as of the previous day. This process also includes permissionassignments and changes.Concur’s reporting uses a hierarchical structure to restrict users to reporting ondata that is relevant to them and their teams. The one exception to the applicationof the hierarchical structure authorizations arises when a user has been directlyassigned to a user’s profile as a BI Manager. Regardless of the hierarchical structure, BI managers will be able to report on the Concur data of any of theirassigned users.During your Concur implementation, one standard reporting currency will beselected for all countries using Concur. This currency may be different than thecurrency that your country uses in Concur. All standard reports will show valuesin this reporting currency; to report in your country’s relevant currency, differentcurrencies can be added to the report by your report administrator.213
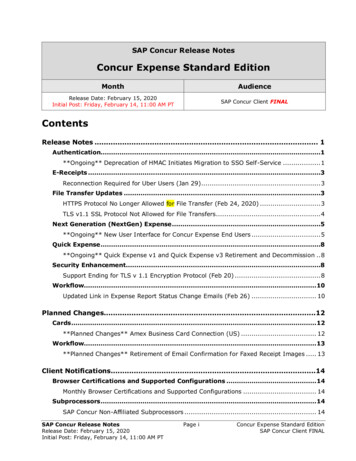
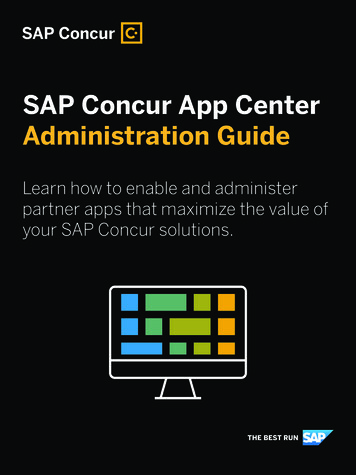
6Concur ReportingIn this chapter, we take a look at the reporting features available in standard Concur Analysis and Concur Intelligence, including a look at the standard reportsavailable in Concur, creating your own queries and reports using Query Studioand Report Studio, and dashboards.6.1T&E Analysis vs. Concur Intelligence ToolsAnalysis reports and 187 Concur Intelligence reports. These standard prebuiltreports are based on Concur’s key T&E reporting metrics and data. In order tomanage the large number of standard reports available, Concur has comprehensive catalogues that provide a definition, for each report, its data, and its intendedaudience. This information can be found under the Help menu on the ConcurConnect homepage, as shown in Figure 6.1.T&E Analysis vs. Concur Intelligence ToolsThe reporting options for your T&E data in Concur come in two versions: thestandard Concur Analysis offering and the premium version known as ConcurIntelligence. There are several differences between the two reporting versions,including the following:왘 Number of standard reports available across the Concur Travel and ConcurExpense modules왘 Number of user licences왘 Studio tools provided to build custom reports왘 Report scheduling and automated distribution options (known as report bursting)왘 Availability of integrated T&E reporting왘 Presence of reporting dashboardsConcur comes with access to the standard Concur Analysis reporting; ConcurIntelligence reporting can be purchased as an add-on feature. In the followingsections, we’ll first discuss features common to both reporting options before diving into some tools exclusive to Concur Intelligence.6.1.1Concur Analysis and Concur Intelligence: Shared ToolsConcur Intelligence and Concur Analysis share several standard features andtools, as we’ll explore in the following subsections. In some cases, Concur Intelligence includes additional functionality.Default ReportsThe number of standard prebuilt reports varies between Concur Analysis andConcur Intelligence, with the latter containing all the reports available in ConcurAnalysis and more. As of December 2016, this includes 138 standard Concur214Figure 6.1 Concur Report CatalogReport Design ToolsThere are two report design tools available in Concur: Query Studio and ReportStudio. Query Studio is available in both Concur Analysis and Concur Intelligence; Report Studio is available in Concur Intelligence. Both are flexible toolsthat you can use to design new queries and reports, in addition to the standardprebuilt reports available in Concur. In addition, extra user licences for QueryStudio come with Concur Intelligence; Concur Intelligence provides twentylicences standard, versus five licences in standard Concur Analysis.Because each reporting option provides access to different studio tools, the abilityto modify the standard Concur reports will depend on whether the report wasmade with Query Studio or Report Studio. The appropriate studio tool access isrequired to modify a standard report; for example, if you have the standard Concur Analysis reporting feature, you do not have access to the Report Studio tooland therefore can’t modify any standard reports built in Report Studio. If youhave Concur Intelligence but only a user licence for the Query Studio, then youcan access all the reports that Concur has to offer, but you can only amend thosestandard reports that have been built in Query Studio.2156.1
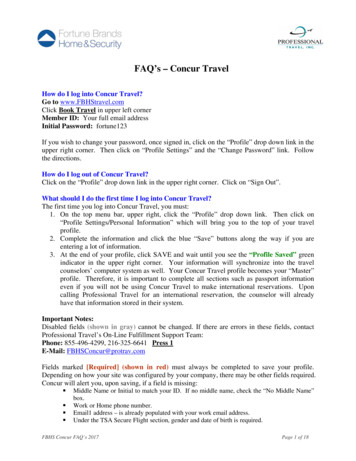
6Concur ReportingUsing Existing ReportsWe’ll cover the using the Query Studio and Report Studio tools in greater detail inSection 6.3 and Section 6.4.User Roles and LicencesThe Concur Analysis and Concur Intelligence offerings each allow for a differenttype and number of user licences. The different types of licences are as follows:왘 The consumer licence allows a user to run any of the prebuilt and customerreports available.왘 The business author licence allows a user to run all the reports available andgives access to the Query Studio to build simple reports.왘 The professional author licence allows a user to run all reports available andgives access to both Query Studio and Report Studio to build a range of reports.왘 The manager licence allows a user access to run the reports available for onlytheir direct and indirect employees.Table 6.1 provides a summary of the number of users allowed under each licensetype for both standard Concur Analysis and Concur Intelligence.User License TypeConcur AnalysisConcur IntelligenceConsumer1040Business author520Professional authorN/A10ManagerUnlimitedUnlimitedTable 6.1 Cognos Reporting Licenses: Numbers and Types6.1.2Concur Intelligence-Only ToolsThe following reporting features are only available in Concur Intelligence:왘 Scheduling and bursting of reportsScheduling within Concur reporting allows for the scheduled, automated running and distribution of reports. Bursting is a feature whereby the report scheduled is tailored to the recipient, showing only data relevant to him.왘 Reporting dashboardsDashboards are an easy data visualization tool with which key metrics and key216performance indicators (KPIs) can be monitored and managed on a singlescreen specifically configured for a target audience, which can contain up to sixreports. Concur offers prebuilt dashboards designed for the most commonlyused reports, as well as tools to build your own.왘 Alert and exception notificationsException-based highlighting is a tool within Concur’s reporting to alert budgetmanagers when important figures in their budgets change in a significant manner. Triggered alerts will alert budget managers to suspicious card transactionsfor their budget or to budget changes that may require review and correctionaction to be taken. Concur’s reporting uses budget values set in the budgetmanager’s user profile to determine exceptions and alerts.왘 Integrated T&E dataIf you use both Concur Travel and Concur Expense, integration of data fromboth modules in reporting is only available in the Concur Intelligence offering.6.2Using Existing ReportsConcur offers several standard reports, providing insight into all aspects of yourT&E spending, including integrated reports if you use Concur Travel and ConcurExpense.The standard reports can be found in the Concur Analysis/Concur IntelligenceStandard Report folders and are organized into a folder structure for reportingareas across T&E data, including additional reporting areas for how Concur isbeing used in your company.Before we look at how to run the standard reports available, we’ll look throughthe preferences that you can set in Cognos to enhance your reporting.6.2.1Set Reporting PreferencesYour reporting preferences can be found in the My Area options, as indicated bythe person icon, available from the Concur Connect page. There are three areasof preferences that you can set (see Figure 6.2), each of which will be discussed inthe following sections. Any changes that you make to your preferences take effectimmediately.2176.2
6Concur ReportingUsing Existing ReportsPreference SettingApplicationPortal Default ViewThe reports and folders in the portal can either bedisplayed in a simple list view or in a detail view; thelatter shows a short description of each folder or reportas available for the individual item.Time ZoneCognos has a default time zone of UTC. The preferenceset here can change the time zone that your Cognosinstallation uses.You should change this setting to your local time zoneif you want to schedule report jobs to run and bedistributed in your local time zone.Enable Bi-directionalLanguage SupportFigure 6.2 User Preferences Menu on Connect HomepageGeneral PreferencesTable 6.2 Preference Settings Available in Cognos (Cont.)The General Preferences tab sets preferences for how reports and queries willbe displayed and run. Some of these settings are also available when you select torun a report using the Run With Options function (for more details, see Section6.2.2). Table 6.2 lists some of the general preferences options.Preference SettingApplicationNumber of Entries in List View The value entered will define the number of entriesshown in a list.Report FormatDefines the default format in which a report will beexported from Cognos:왘 HTML왘 PDF왘 EXCEL왘 CSVProduct Language and Content LanguageThe language used to display Cognos reports andcontent data can be personalized here to match yourlocal language.However, reports can be created in specific languagesother than the default set and will override any preferences set in your profile.Table 6.2 Preference Settings Available in Cognos218This setting will allow you to view numbers in Arabic,Hebrew, Urdu, and Farsi in the correct left-to-rightformat while still viewing text in the right-to-leftformat correct for these languages.Personal PreferencesThe Personal Preferences tab contains logon details for the Cognos connectionworkspace. Your usual logon details will be listed as your Primary Logon; if youhave additional logon information for any other workspaces, it can be listedunder Secondary Logon.The Alerts Email field can be used to define an email address that Cognos alertsare sent to for notifications of specific events.Other preferences include settings to apply Credentials, Groups and Roles, andCapabilities. Many of these settings may be read-only for your Cognos connection. These settings perform the following functions:왘 Credentials can provide authorizations to other users, groups, or roles to runreport entries.왘 Groups and Roles will show the groups in Cognos and the Cognos roles thatare assigned to your primary and secondary logons as applicable.왘 Capabilities will show functions and features available based on your primaryand secondary logons. This is a useful view to check if you’re authorized forspecific activities in Cognos reporting.2196.2
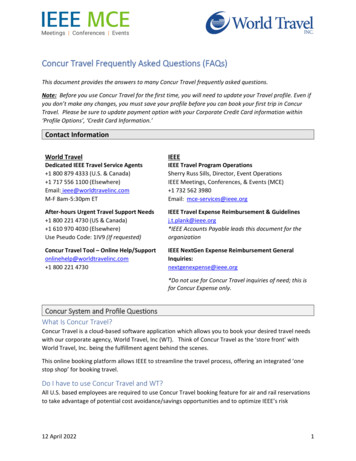
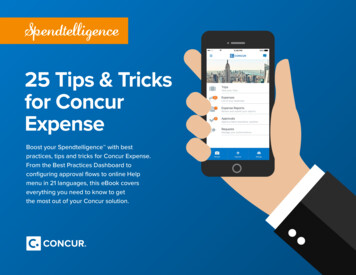
6Concur ReportingUsing Existing ReportsPortal Tab PreferencesFolder NameUseThe last tab is for Portal Tab Preferences, in which settings can be made for theportal tabs shown on the Cognos connection homepage. Here, you can modifythe sequence of the tabs that are shown and add new/hide existing tabs asneeded.Concur Data WarehouseContains the Concur data warehousemodel. It will appear empty, but must notbe deleted.왘 Intelligence—Standard ReportsThis folder will contain all the standardreports available in either Concur Analysisor Concur Intelligence reporting.왘 Analysis—Standard Reports6.2.2Running a Standard Report Your company name The report folder will be named after yourcompany and customer number. Thisreport folder can be used to share reportsbetween users in your company.Dashboard MetricsAny metrics that can be added to reportingdashboards will be contained here.The Reporting tile can be found on the My Concur homepage, and the types ofreports shown will depend on the product (either Concur Analysis or Concur Intelligence) that your company uses or the reporting access assigned within Cognos.Use the Reporting tile to open the screen shown in Figure 6.3, launching Concur’s reporting features.Navigation MenusFolder and Dashboard tabsReporting ToolsReport FoldersTable 6.3 Reporting Folders in Cognos3. Reporting toolsStandard tools to create new report folders, schedule report jobs, set folderproperties etc.4. Homepage navigationTools to navigate to Cognos help, personal settings and preferences withreporting.Personal FoldersFigure 6.3 Concur Reporting HomepageThe Concur Connection homepage includes the following four main areas:1. Folders and dashboard tabsThese tabs allow access to folders containing reports and to dashboards.2. Report foldersAll the standard reports and metrics are arranged into a folder structure. ForConcur Intelligence, there are four main folders (see Table 6.3); the folders arethe same for Concur Analysis reporting, except that the Dashboard Metricsfolder is not available.If you create a report or report view in any tool, and save the new report to your Personal Folder, found under My Folders, then the report can’t be seen or shared withany other reporting administrator. To access the report, another user will need to be setas your delegate.To share reports across the organization, a reporting administrator should set up ashared folder structure under your company’s folder in the public folders.To run a standard report, navigate via the relevant folder structure to the reportand click on it. This will open a report prompt page on which you can enter yourreport selection criteria. Different prompt fields will appear depending on thedata set for your chosen report. Figure 6.4 shows a report that uses both a datetype prompt (Sent for Payment Date:) and a value-type prompt (Employee:).Enter your report criteria, and click Finish to run the report.2202216.2
6Concur ReportingUsing Existing ReportsFigure 6.4 Report Prompt Screen Using Different Types of Data Selection PromptsYou can also set a report to run with layout or output options different than yourusual default stored values when you run the report by using the Run withOptions selection button under the Actions column on the right-hand side of thescreen. Advanced options (see Figure 6.5) also allow you to choose additional formats to run the report in, choose other languages for the report, and schedule thereport to run at a specific time and date. To schedule a report to run as a recurringjob, use the scheduling feature described in Section 6.4.2.Using additional options to run your report will also allow the report to be distributed to recipients when the report has been run in the background. When theTime and Mode of the report is set as Run in the Background, Cognos will showthe Delivery options. Here, choose Send by Email for the report to be sent out tousers. The email distribution list, email title, and a message can be included in theemail.222Figure 6.5 Advanced Options Available when Running ReportsOnce a report has been run, a report view can be created to save the report selection parameters and thus make the report output repeatable. The report view canbe saved into shared folders to be shared across your organization. To do so,under the Keep This Version dropdown (see Figure 6.6), select the Save as2236.2
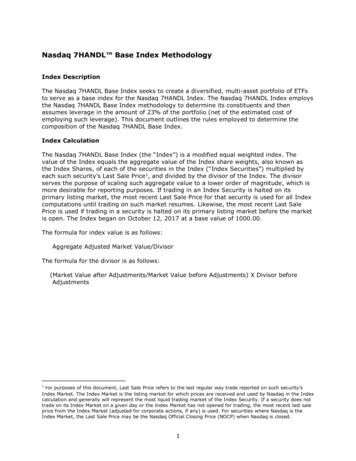
6Concur ReportingBuilding and Editing Reports in Query StudioReport View option. Cognos will ask for a save location to be specified; thedefault save location will be your My Folder area. Once saved, the report viewcan be accessed quickly from a folder by any user permissioned for the folder.Selecting the report will run it with the saved selections criteria.ToolbarsQuery Design panelData andFunctions panelFigure 6.7 Query StudioQuery Studio allows you to create two different types of reports:Figure 6.6 The Report View Option Makes a Report Repeatable6.3Building and Editing Reports in Query StudioQuery Studio is a lightweight tool that allows you to create simple queries andreports. To launch Query Studio, select the Launch menu, then select Query Studio.Cognos will ask you to confirm the data warehouse package to use for Query Studio. For this example, select Concur Data Warehouse.왘 A list report will show data in simple lists and is best suited to simple value listsof data. List reports show simple queries, such as the total spend for an expensetype for the whole company.왘 A crosstab report is a list report with columns and rows of data; a measure at theintersections of each column and row to provides a summary of the data. Crosstab reports can provide more detailed information, such as the total spend of anexpense type per country or business unit to provide a more detailed breakdown.In the following subsections, we’ll cover how to create a new report in Query Studio before moving on to manipulating data within reports.The Query Designer screen contains three main areas (see Figure 6.7):6.3.11. Data and related functions panelThis area to allows you to insert data, edit data, change a report layout, run thereport, and manage a file.Query Studio allows you to create simple, list-style reports, manipulate data, andadd charts for visual representation. The first step to create a new report is toselect the New Report button on the toolbar button to open a blank reportscreen.2. ToolbarThis area contains the most commonly used report functions in the standardtoolbar and font settings in the font toolbar to be used in your report.Creating a New ReportFrom the data menu on the left-hand side of the screen, each piece of data information that can be used in reporting is organized into a comprehensive folder3. Report design panelIn this design area, you’ll build your report.2242256.3
6Concur Reportingstructure within the areas of Expense, Invoice, Travel, Meetings, and Configuration. To add a new piece of data into your report, simply select the field fromthe data menu and either double-click on the data item or use the Insert buttonfound at the bottom of the menu to add the data item to the report. Data items areadded from left to right, but you can use drag and drop to drop the data items intospecific places. Continue to add data fields to your report until you have all thedesired data.Building and Editing Reports in Query StudioTo save the report created, click the Save button on the toolbar; Cognos will thenask for a report Name, short Description for the report, Screen Tip, and a saveLocation, as shown in Figure 6.9. The save location for a new report will defaultto your My folder location. To save the report to another shared location withinyour company, choose another location. Reports can only be saved to locations auser has permission to access.Delete any data field added to the report by selecting the column and clicking onthe Delete button on the toolbar.Titles can be added to reports by double clicking on the title to select the Titleoption in the report design panel; Cognos will open the Edit Title Area, providing access to fields for the report title and subtitle and options to show any filters,sorting, or data suppression when applied to the report (see Figure 6.8).Figure 6.9 Saving Newly Created Report6.3.2Manipulating Data within ReportsSeveral data manipulation techniques are available to make alterations to yourreport, including renaming data columns, filtering, summaries, and calculations,all of which can be accessed via the toolbar at the top of the report designer page.You can perform the following actions:Figure 6.8 Editing Report Title and Subtitle226왘 Column header names can be renamed to something more specific and informative for your organization by double-clicking on the required column headerto open the renaming options.2276.3
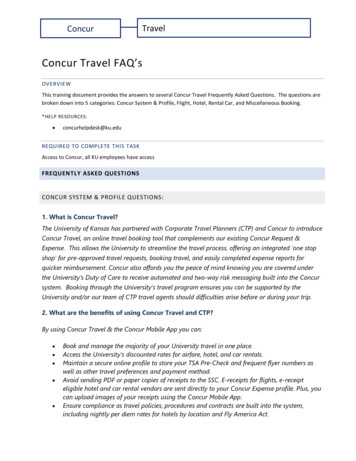
6Concur Reporting왘 Filters can be added to reports to both ensure that only relevant data is beingreported and provide performance improvements. When adding a filter valuebased on a column selection, you can include or exclude data from the reportin several ways depending on the data being filtered. Filters can also be combined for more complexity. One common filter to include in reports removestest users from any user administration reports.왘 Calculations can be added to your queries to provide sums, averages, andcounts for the data of a single column or to multiply values in two columns andprovide the resulting value in a third column. Multiplication calculations inreports can be useful for budget-related predictions, such as seeing how a costincrease for a specific expense could affect a budget.왘 Reports automatically summarize data to remove the repetition of measure values within the report and to improve the performance, look, and feel of thereport. For example, when reporting on the total value of an expense, the summarization of the data will report the total expense type and value rather thanreporting each individual line item instance and individual value of thatexpense type. The option to automatically summarize data and values can bedeactivated for a report through the advanced runtime options for the report.왘 Suppressing cell options can be used to hide empty cells values from your finished report. The suppression options can be applied to cells, rows, or cells androws of data within the report from the appropriate button on the toolbar.Building and Editing Reports in Report Studioand how the data will flow from one page to the next if the report crosses multiple pages. A prompt page for the report can be also be built for report selections.One or multiple queries can be used in the report to provide added levels of detailand complexity or to use key functionalities such as report bursting. Reports created with Report Studio can contain multiple objects, such as charts and lists, andmultiple nonreport objects, such as logos and images, to create a more stylizedreport.The Report Studio homepage (see Figure 6.10) includes five main areas, as follows:1. The Data and Related Function panel allows you to insert data, edit data,change a report layout, run the report, and manage the file.2. The Properties panel allows you to configure various properties for data, queries, or report page selections.3. The most used report functions are in the standard toolbar, and font settingsare in the font toolbar.4. The Report Designer panel is where you’ll build your report, including sidebarnavigation through the different pages and queries that make up your report.5. Explorer Bars can help you navigate the multiple layers that make up thereport, including multiple queries or pages in the report; the conditionexplorer works with different variables that define conditions in your report.ToolbarsAdding ChartsSeveral chart types can be added to a report for a visual representation of the data andto show patterns and trends in the data.6.4Building and Editing Reports in Report StudioData Source,Query, andToolbar PanelExplorer BarsIn the previous section, we covered how Query Studio can create simple dataqueries; now, we’ll look at Report Studio and how it can be used to create morecomplex, management-style reports.Report designerpanelProperties PanelA report created with Report Studio will consist of multiple pages used to definethe layout and presentation of the report. The report layout pages will designhow the report will look, including how the data is presented with report styleand chart options; how the data is formatted, such as font, color, and text options;228Figure 6.10 Report Studio Homepage2296.4
6Concur ReportingComparing the Report Studio homepage with the Query Studio homepage shownin Figure 6.7 you’ll see many more toolbar options in Report Studio, as well asadditional options for manipulation of data parameters.In the following subsections, we’ll provide a quick primer on the types of reportsand their structure, discuss creating a report, and then walk through the processof bursting reports.6.4.1Building and Editing Reports in Report Studioused to collate who should receive the report. For a more detailed guide of howto configure a report to be burst to different users, see Section 6.4.3.A report will consist of one or more report pages, which are used to design eachstep of the report, from the report prompt pages used to enter the report selections to the layout of the report itself in the report pages. The page explorer onthe Explorer Bars bar can be used to navigate between the multiple pages thatmake up your report.Report Types and StructuresThe report designer offers several report types that can be created to representthe data in the most appropriate manner. Report types available include the basiclist to show columns of data, the crosstab to show rows and columns of data witha measure at the intersection of each, and chart reports to show the data graphically. Different report styles will suit different reports best, depending onwhether the data being reported on is relational or dimensional. Once the reporttype has been selected, Cognos will open the Report Studio homepage.6.4.2Creating a New ReportAccess Report Studio in the same manner as Query Studio, using the same menu.When asked to confirm the data warehouse package to use, select Concur DataWarehouse.Report Studio will then offer choices for the type of report to create (see Figure6.11). Chose the appropriate report type depending the data to be reported on,click the OK button, and the Report Studio homepage will open.Report Studio can be used to create either relational or dimensional reports,whichever suits the report specification better. The relational reporting styleshould be used for relational data and is best represented by lists and list reports.Dimensional reporting styles are appropriate for dimensional data, which arebest represented by crosstab, map, and chart reports. When authoring a newreport, take a moment to consider how you view your data. If you consider yourdata in list, tables, and columns, then your chosen reporting style is relational. Ifyou consider your data using different dimensions and measures and with various cells intersecting, then your reporting style is dimensional.Reports created in Report Studio will consist of at least two components: thereport layout and the report query, crossing multiple report pages.A report layout is the set of pages that define how the report appears to the user,including how the data is presented, such as a chart or a crosstab layout; anyreport formatting and specification for how data should flow from one page tothe next if necessary is part of the layout.The queries included in a report will define the data that appears in that report,and multiple queries can be used in a single report. As an example of using multiple queries in a report, you can configure a report that is burst to recipients, inSection 6.4.3, in which one query is used to report data and the second query is230Figure 6.11 Different Report Styles Available in Report StudioData items can be added to the report easily by selecting them from the data andrelated functions panel; either double-click an item, or drag and drop it into theReport Designer panel. As with Query Studio, data items are added left to rightacross the Report Designer panel. Many of the features and functions of ReportStudio will behave in the same manner as in Query Studio. In the following subsections, we’ll cover some of the more advanced and unique features and functions of Report Studio.2316.4
6Concur ReportingObjects in ReportsSeveral objects can be added to your report to enhance the report features. Chartscan be added to reports as individual objects to visually represent specific dataand metrics within a wider report. There are several chart types available to represent different the metrics being demonstrated in a report, including straightforward visualizations, such as using line or bar charts to show data trends or piecharts to show percentages or proportions of a whole. You can also use combination charts to highlight the relationships among various sets of data or bubble andquadrant charts to show a comparison of key data metrics with respect to axis andsize metrics.Chart options can be selected from the Chart toolbar button; once you’ve createda chart in your report, several chart properties are available to be configured.Double-click on any aspect of your chart, and the Properties pane will allow customizations to be made. Figure 6.12 shows an example of some parameteroptions that can be applied to a data item, including data Type, Label, Expression,and Functions.Building and Editing Reports in Report Studioefficiency due to the scheduled job being set up once for multiple outputs. Anyreport in Cognos can be set to run on a schedule.From the Cognos connect
Report Design Tools There are two report design tools availa ble in Concur: Query Studio and Report Studio. Query Studio is available in both Concur Analysis and Concur Intelli-gence; Report Studio is available in Conc ur Intelligence. Both are flexible tools that you can use to design new queries an d reports, in addition to the standard