Transcription
Saga et al. Journal of Experimental & Clinical Cancer 2019) 38:416RESEARCHOpen AccessNANOG helps cancer cells escape NK cellattack by downregulating ICAM1 duringtumorigenesisKotaro Saga1*†, Jinhee Park1†, Keisuke Nimura1, Norihiko Kawamura1,2, Airi Ishibashi1, Norio Nonomura2 andYasufumi Kaneda1*AbstractBackground: At the beginning of tumorigenesis, newly born cancer cells must successfully avoid attack by theimmune system. Although most abnormal cells are efficiently identified and destroyed by the immune system,particularly by NK cells, the molecular mechanisms by which newly born cancer cells evade NK cell surveillance arenot fully understood.Methods: NK cell resistance of highly tumorigenic population of human prostate cancer (PCa) cells were confirmedby xenograft in SCID mice with or without NK cell neutralization. The mechanisms by which the tumorigenic PCacells evaded NK cell attack were investigated by RNAseq, ChIPseq, generation of several transformants andxenograft in SCID mice.Results: Here, we show that PCa cells have a strengthened ability to escape NK cell attack due to NANOG, apluripotent-related transcription factor, mediating the repression of ICAM1, a cell adhesion molecule, duringtumorigenesis. Mechanistically, NANOG directly binds to the region upstream of ICAM1. As the binding betweenNANOG and the upstream ICAM1 region increases, p300 binding to this region is diminished, resulting in decreasedICAM1 expression. High NANOG expression confers PCa cells the ability to resist NK cell attack via the repression ofICAM1. Consistent with these results, low ICAM1 expression is significantly correlated with a high recurrence rate inpatients with PCa.Conclusions: Our findings indicate that repression of ICAM1 is a critical mechanism by which cancer cells evadeattack from NK cells during tumorigenesis. These results suggest a pivotal role of NANOG in establishing a geneexpression profile for escaping the immune system.Keywords: NANOG, ICAM1, NK cell, TumorigenesisBackgroundTumorigenesis is continuously monitored by the immunesystem, and most newly born cancer cells are eliminated byanticancer immune responses [1, 2]. However, some newlyborn cancer cells evade immune surveillance, defined ascancer-initiating cells (CICs), and thus exhibit tumorigenicpotential, resulting in tumor formation. As the tumor massincreases, chemokines secreted from cancer cells attract* Correspondence: saga@gts.med.osaka-u.ac.jp; kaneday@gts.med.osakau.ac.jpKotaro Saga and Jinhee Park are Co-first authors.1Division of Gene Therapy Science, Osaka University Graduate School ofMedicine, 2-2 Yamada-oka, Suita, Osaka 565-0871, JapanFull list of author information is available at the end of the articlevarious host-derived immunosuppressive cells (e.g., regulatory T cells [3], myeloid-derived suppressor cells [4],tumor-associated macrophages [5] and tumor-associatedneutrophils [6]) into tumors. Thus, tumor tissues eventuallyconsist of heterogeneous cell populations that include numerous cancer cells and various host-derived immunosuppressive cells [7]. These heterogeneous cells establish animmunosuppressive environment in the tumor tissue bymaintaining high cytokine levels [8–12], promoting theproduction of cancer-derived exosomes [13] and exertingimmunosuppressive effects on intratumoral host-derivedimmunosuppressive cells [14], thus protecting cancer cellsfrom immune cell attack. On the other hand, during the The Author(s). 2019 Open Access This article is distributed under the terms of the Creative Commons Attribution 4.0International License (http://creativecommons.org/licenses/by/4.0/), which permits unrestricted use, distribution, andreproduction in any medium, provided you give appropriate credit to the original author(s) and the source, provide a link tothe Creative Commons license, and indicate if changes were made. The Creative Commons Public Domain Dedication o/1.0/) applies to the data made available in this article, unless otherwise stated.
Saga et al. Journal of Experimental & Clinical Cancer Research(2019) 38:416early phase of tumorigenesis, CICs and other cancer cellsderived from CICs establish a poor immunosuppressive environment due to insufficient cytokine secretion, exosomeproduction and host-derived immunosuppressive cell attraction. Therefore, these cancer cells require a distinct anticancer immune escape system to allow tumor tissueformation from the tumor tissue-mediated immunosuppressed environment. However, the molecular mechanismsby which CICs evade anticancer immune surveillance during the initial stage of tumor formation via the establishment of an immunosuppressive environment remainincompletely understood.CIC-like phenotypic cancer cells, which exhibit hightumorigenic activity, have been identified in various tumortissues and cultured cancer cells [15–19] and have a distinctive gene expression profile unlike that of normal cancer cells [20, 21]. In particular, the upregulation of stem cellfactors, e.g., NANOG, OCT4 and SOX2, are distinguishingcharacteristics of CIC-like cells, and these transcription factors are important for maintenance of the CIC-like phenotype [22]. However, the mechanisms by which thesetranscription factors provide cancer cells the ability to evadeanticancer immune responses remain unknown.Herein, we show that the NANOG-mediated repressionof ICAM1 is a critical mechanism underlying the ability ofcancer cells to escape natural killer (NK) cell attack duringthe initial stage of prostate cancer (PCa) formation.MethodsCell cultureHuman PCa cells (DU145, PC3, 22Rv1) were purchasedfrom the American Type Culture Collection (Rockville,USA) and maintained in Dulbecco’s Modified Eagle’sMedium (DMEM) (Nacalai Tesque Inc., Tokyo, Japan).MTA cells were purchased from Japanese Collection ofResearch Bioresources Cell Bank (Ibaraki, Japan) andmaintained in RPMI-1640 medium (Nacalai Tesque). BothDMEM and RPMI-1640 medium were supplemented with10% fetal bovine serum (FBS) (Biowest, Nuaillé, France),100 U/mL penicillin and 0.1 mg/mL streptomycin (Penicillin–Streptomycin Mixed Solution) (Nacalai Tesque).These cells were incubated at 37 C and 5% CO2.Sphere-forming cultureSpheres of DU145 cells were formed as previously described [23]. Briefly, DU145 cells were plated on ultralowattachment culture dishes (Corning, NY, USA) (1 103cells/well in 6-well plates and 1 105 cells/dish in 10 cmdishes) and cultured in DMEM/F-12 (Gibco, NY, USA)supplemented with B27 (Gibco), 4 μg/mL insulin (Sigma,MO, USA), 20 ng/mL epithelial growth factor (EGF;Gibco), and 20 ng/mL basic fibroblast growth factor(bFGF) (ORF, Kopavogur, Iceland) for 10 days at 37 Cand 5% CO2.Page 2 of 13Plasmid constructionHuman NANOG cDNA was amplified from PC3 cDNA,and GFP-NANOG was generated by connecting NANOGcDNA to the 3′-terminus of EGFP cDNA. HumanICAM1 cDNA was purchased from R&D Systems (Minnesota, USA). GFP and GFP-NANOG cDNA were introduced into the CAGIpuro vector, and ICAM1 cDNA wasintroduced into the CAGIneo Gateway vector. pX330(Addgene, MA, USA) was treated with BbsI, and DNA oligos comprising a gRNA sequence (GCTCTGTTCCCAGGTGAGTC and GCTATTCAAACTGCCCTGAT)were inserted into the BbsI site.Generation of stable transformants and ICAM1KO-DU145cellsPlasmid DNA (1 μg) was transfected into suspendedDU145, PC3 or 22Rv1 cells (1 105 cells) using theNENO system (Invitrogen) (voltage; 1150, width; 30,pulse number; 2). Transfected DU145 cells were cultured with 1.0 μg/mL puromycin (Nacalai Tesque) or 2mM G418 (Nacalai Tesque), while transfected PC3 and22Rv1 cells were respectively cultured with 4.0 μg/mLand 0.5 μg/mL puromycin. Single colonies were selectedand individually cultured. pX330 including the targetgRNA sequence (1 μg) and pPGK-puro (0.5 μg) weretransfected into suspended DU145 cells (1 105) usingthe NENO system; the DU145 cells were then culturedwith 1.0 μg/mL puromycin for 1 week and then culturedwithout puromycin. Single colonies were selected andindividually cultured. Genotypes were identified by PCR,which was performed using Q5 high-fidelity DNA polymerase (New England Biolabs Inc. (NEB), MA, USA).Cell proliferation assayWT-, GFP-, and GN-DU145 cells as well as WT-, GFP-,and GN-PC3 cells were seeded on 6-well plates at 1 105 cells/well. These cells were cultured, and the cellnumbers were counted every other day.Western blot analysisCell lysates were subjected to SDS-PAGE, and separatedproteins were transferred onto Immobiron-P TransferMembranes (Merck Millipore, Tokyo, Japan). To detectproteins, the anti-NANOG (Cell Signaling Technology(CST), MA, USA; #4903), anti-ICAM1 (CST; #4915), antiGFP (CST; #2956) and anti-βactin (Sigma; A5441) primary antibodies were used. Enhanced chemiluminescence(ECL) horseradish peroxidase-conjugated donkey antirabbit IgG (GE Healthcare Japan, Tokyo, Japan) was usedas a secondary antibody for the detection of NANOG,ICAM1 and GFP, and ECL horseradish peroxidaseconjugated sheep anti-mouse IgG (GE Healthcare) wasused as a secondary antibody for the detection of βactin.Signals were detected using Chemi-Lumi One (Nacalai
Saga et al. Journal of Experimental & Clinical Cancer Research(2019) 38:416Tesque) or Chemi-Lumi One Super (Nacalai Tesque) andan ImageQuant LAS 4000 mini system (GE Healthcare).Real-time RT-PCRTotal RNA was isolated from each cell using the ISOGEN kit (Nippon Gene, Tokyo, Japan), and cDNA wasgenerated from total RNA using a High Capacity cDNAReverse Transcription Kit (Applied Biosystems Inc., CA,USA). NANOG and ICAM1 expression was quantifiedvia real-time reverse transcriptase PCR (RT-PCR) usingTHUNDERBIRD SYBR qPCR Mix (TOYOBO, Tokyo,Japan). As a control, 18S ribosomal RNA was quantifiedin the same manner.Page 3 of 13USA; #61401) Abs were bound to Protein G Dynabeads(Thermo Fisher Scientific, MA, USA), and these conjugates were used for ChIP. Native ChIP: Nuclear fractionsof WT-, GFP- and GN-DU145 cells (1 106) weretreated with 1200 U MNase (Takara, Shiga, Japan) forchromatin fragmentation. The anti-H3K27Ac Ab(Abcam, Cambridge, UK; ab4729) was bound to ProteinG-agarose (Merck Millipore), and the conjugate wasused for ChIP. The ChIPseq library was prepared usingthe NEBNext Ultra II DNA Library Prep Kit for Illumina(NEB) and the NEBNext Multiplex Oligos for Illumina.ChIPseq libraries were sequenced by Illumina.ChIP qPCRAssaying NK cell resistance in vitroDU145 and PC3 cells were seeded on 6-well plates (1 105 cells/well) and incubated for 4 h to allow adhesion tothe plate bottom. MTA cells were added to each well at a1:1 ratio (1 105 cells), and the cells were cocultured for48 h. Anti-ICAM1 Ab (CST; #4915) was added to culturemedium at 1/1000 dilution for ICAM1 neutralization.After coculture, floating cells, including MTA and deadcancer cells, were eliminated by washing with PBS, andadherent surviving cancer cells were measured by theMTS assay using the CellTiter 96 Aqueous One SolutionCell Proliferation Assay kit (Promega, WI, USA).Assaying tumor formation in vivoDU145 cells and their derivatives (1 or 5 105 cells) wereintradermally transplanted onto the backs of SCID mice(CLEA Japan, Suita, Japan). For NK cell neutralization, ananti-asialo GM1 antibody (Wako, Osaka, Japan; 200 μg/200 μL PBS) was intraperitoneally administered to SCIDmice before and after ( 1, 0, 1, 2, 4, 6, 9, 12, 15 and 19days) cancer cell transplantation. As a control, normalrabbit IgG (Sigma) was administered in the same manner.Tumor growth was monitored by periodically measuringtumor volume using calipers; tumor volume was calculatedaccording the following formula: tumor volume (mm)3 maximal length (mm) x (perpendicular width) (mm)2 / 2.RNAseqRNAseq libraries were prepared using the NEBNextPoly(A) mRNA Magnetic Isolation Module (NEB), theNEBNext Ultra RNA Library Prep Kit for Illumina(NEB) and the NEBNext Multiplex Oligos for Illumina(NEB) and sequenced by Illumina.ChIPseqCrosslink ChIP: WT-, GFP- and GN-DU145 cells (2 107) were fixed with 1% formaldehyde (Sigma) and sonicated using the Sonifier SFX550 instrument (BRANSON,CT, USA) to induce chromatin fragmentation. AntiNANOG (CST; #5232) and anti-p300 (Active Motif, CA,ChIP was performed according to the manufacturer’s instructions (SimpleChIP Enzymatic Chromatin IP Kit(#9003); CST). ChIP samples of WT-, GFP, and GNDU145 cells were amplified by primers targeting theICAM1 promoter region (ACCGAGCCTGGCCCCAAand CTGACCTCGTGTTCCACCTGC) and quantifiedusing THUNDERBIRD SYBR qPCR Mix.Clinical dataset analysisThe ICAM1 expression levels in localized PCa andCRPC tissues were analyzed using previously publishedmicroarray-based gene expression data [24]. cBioPortal[25] was used to analyze the correlation between ICAM1expression levels and progression-free rates in a prostateadenocarcinoma dataset (TCGA, Provisional). To assessthe progression-free rate after total prostatectomy, dataharvested from patients in the chemotherapy group before surgery, patients in the radiotherapy group aftersurgery and patients with an unknown follow-up periodand prognosis were eliminated from the original dataset.The final dataset was separated into two groups depending on the ICAM1 expression level, and levels in the topand bottom 50% were respectively categorized into theICAM1-high and ICAM1-low groups, respectively.ResultsSphere-forming cancer cells have tumorigenic potentialand escape from NK cell attackIn immunodeficient mice, PCa spheres exhibit manyCIC-like characteristics and a higher tumorigenic potential than adherent-cultured cancer cells [15, 16, 26, 27].To confirm the phenotype of sphere-forming cancercells, sphere-forming human PCa cell lines (DU145)were generated by culturing cells in serum-free mediumon a low adherent culture dish. Although DU145 cellsappeared in a cobblestone form when cultured in normaladherent medium (Additional file 1: Figure S1A, left),they formed floating spheres within 10 days under thisculture condition (Additional file 1: Figure S1A, right).To compare the tumorigenicities of both forms of
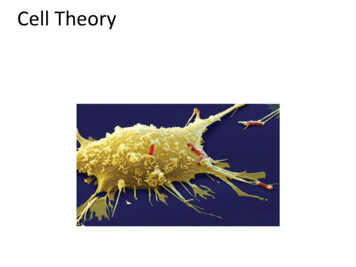
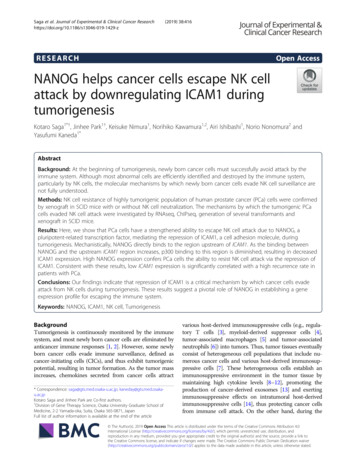
Saga et al. Journal of Experimental & Clinical Cancer Research(2019) 38:416DU145 cells (sphere-forming DU145 cells (SP-DU145)and adherent-cultured DU145 cells (AD-DU145)), 1 105 cells of each form were intradermally inoculatedonto the backs of SCID mice (Additional file 1: FigureS1B). SP-DU145 cells exhibited tumorigenic potential,while AD-DU145 cells did not, consistent with previousreports (Additional file 1: Figure S1C). Tumor formationassays of sphere-forming cancer cells were carried out usingSCID or NOD/SCID mice in this experiment and in previous reports [15, 16, 26, 27]. These immunodeficient micelack T and B cells but maintain NK cell activity [28, 29].Therefore, transplanted sphere-forming cancer cells mustescape from NK cell attack by themselves during the initialstage before a tumor tissue-mediated immunosuppressiveenvironment is established.Next, we investigated the relationship between thetumorigenic potential and NK cell sensitivity of DU145cells. SCID mice were continually injected with an antiasialo GM1 antibody (NKneut-SCID mice) via the intraperitoneal route to inhibit NK cell activity; as a control,normal rabbit IgG was injected into SCID mice in thesame manner (Cont-SCID mice) (Additional file 1: Figure S1D). These injections were performed for 19 daysafter the transplantation of cancerous cells to neutralizeNK cells from the initial stage through the formation oftumor tissue. AD- and SP-DU145 cells were intradermally transplanted onto the backs of these SCID mice,and their tumorigenic potentials were then observedseparately (Additional file 1: Figure S1D). In Cont-SCIDmice, SP-DU145 cells formed tumors in all mice, whileAD-DU145 cells exhibited very low tumorigenicity.However, both SP-DU145 cells and AD-DU145 cells exhibited tumorigenicity in NKneut-SCID mice (Fig. 1 A).These results suggested that the tumorigenic potential ofDU145 cells was promoted by the acquisition of NK cellresistance via sphere formation.NANOG overexpression promotes escapability from NKcell attackSeveral transcription factors contribute to the maintenance of CIC-like characteristics, which include hightumorigenic potential and some malignant phenotypes[30]. In particular, NANOG is highly expressed in CIClike PCa cell lines [31, 32], and our group has revealedthat NANOG is important for the tumorigenesis of PCacells [33]. In fact, SP-DU145 cells exhibited higherNANOG expression than AD-DU145 cells (Fig. 1 B andC). Moreover, tumors comprised of highly malignantPCa tissue had more CIC-like cells than those comprisedof low malignant PCa tissue [34], and NANOG expression was higher in highly malignant PCa tumors (Grisonscore (GS) 9) than in low malignant PCa tumors (GS6)(Additional file 1: Figure S2). Therefore, these resultssuggest a link between NANOG expression and NK cellresistance in PCa.To investigate the relationship between NANOG expression and NK cell resistance in PCa, GFP-NANOGoverexpressing DU145 (GN-DU145) and PC3 (GN-PC3)cells were generated (Fig. 2 A and Additional file 1: FigureS3A); GFP-overexpressing DU145 (GFP-DU145) and PC3(GFP-PC3) cells were generated as controls. GN-DU145and GN-PC3 cells exogenously expressed GFP-NANOGControl2000NK cell D15001000N.S.5000030 35 40 45 50 55 60(Day)30 35 40 45 50 55 60(Days)CBNANOG/18S(Relative expression)Tumor volume (mm3)Tumor volume (mm3)APage 4 of 1310DU145**8AD6SPNANOG42β-ACTIN0ADSPFig. 1 Sphere-forming DU145 cells exhibit tumorigenic potential by escaping from NK cell attack. (a) AD- and SP-DU145 cells were transplantedonto SCID mice treated with an anti-asialo GM1 Ab for NK cell neutralization or control IgG. The respective tumor volumes were measured overtime (n 4, *P 0.05, **P 0.01, Student’s t test). (b and c) The NANOG expression levels in AD- and SPDU145 cells were compared by real-timeRT-PCR (b) and western blot (c) analyses. Real-time RT-PCR was performed in triplicate. (**P 0.001, Student’s t test)
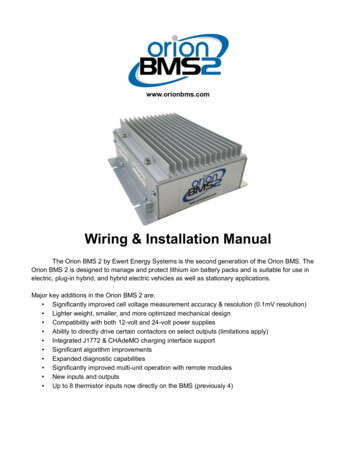
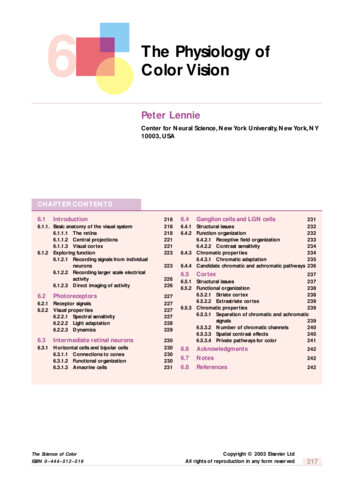
Saga et al. Journal of Experimental & Clinical Cancer ResearchA(2019) 38:416BCell number (x 105)DU145GFPGNWT #1 #2 #3 #1 #2 #3GFPNANOGGFPNANOGDU14576543210N.S.WTGFPGN0 1 2 3 4 5 6(Day)β-ACTINCDTumor volume (mm3)DU145Cell viability (%)Page 5 of 13**120100806040200WTGFPGNControlNK cell neutralization2500**2000GN1500GFP****1000*500** ** *025002000GN1500GFPN.S.100050000 30 35 40 45 50 55 600 30 35 40 45 50 55 60(Day)(Day)Fig. 2 NANOG overexpression induces tumorigenic potential by allowing escape from NK cell attack. (a) Western blot analyses of WT-, GFP- andGN-DU145 cells. (b) The proliferation rates of DU145 cells (WT, GFP, and GN) were compared (n 3, Tukey-Kramer test). (c) The cell viabilities ofDU145 cells (WT, GFP, and GN) were measured after performing the NK cell resistance assay in vitro (n 3, *P 0.005, **P 0.001, Tukey-Kramertest). (d) GFP- and GN-DU145 cells were transplanted onto SCID mice treated with an anti-asialo GM1 Ab or control IgG. Respective tumorvolumes were measured for up to 60 days after the transplantation (n 4, *P 0.05, **P 0.01, Student’s t test)and exhibited increased intrinsic NANOG expressionlevels compared with those in their respective wild-type(WT) and GFP groups (Fig. 2 A and Additional file 1: Figure S3A). Moreover, the proliferation rates of GN-DU145and GN-PC3 cells equaled those of their respective controls (Fig. 2 B and Additional file 1: Figure S3B). Next, weassessed whether NANOG overexpression influenced NKcell resistance. NK cells have the ability to lyse myeloidleukemia cells (K562) when the two cell types are cocultured [35]. Because NK-like T cell leukemia/lymphoma(MTA) cells exhibited NK cell-like lysis activity againstcocultured K562 cells despite exhibiting little activity toward another leukocyte cell line (M1 macrophage cell line)(Additional file 1: Figure S3C), MTA cells were used toassay in vitro resistance against NK cell attack. WT-, GFPand GN-DU145 cells and WT-, GFP- and GN-PC3 cellswere cultured with MTA cells for 48 h, and the cell viabilities of DU145 and PC3 cells were measured by the MTSassay (Fig. 2C and Additional file 1: Figure S3D). The survival rates of WT-DU145, GFP-DU145, WT-PC3, andGFP-PC3 cells were decreased to 60 80%, whileGN-DU145 and GN-PC3 cells were hardly attackedby MTA cells. Moreover, MTA-treated apoptotic(AnnexinV ) DU145 cells were measured by FACS,and GN-DU145 had fewer AnnexinV populationthan WT-DU145 (Additional file 1: Figure S3E). Furthermore, GN-DU145 also exhibited higher resistanceagainst human NK cell from healthy donor than control group (Additional file 1: Figure S3F). Next, GFPand GN-DU145 cells were intradermally transplantedonto the backs of the NKneut- and Cont-SCID mice,and their respective tumorigenic potentials were observed (Fig. 2 D), revealing that GFP-DU145-derivedtumors were formed in only NKneut-SCID mice.However, GN-DU145 cells were able to generate tumors in both types of SCID mice. Therefore, NANOGexpression in PCa cells promoted escape from NKcell attack.NANOG overexpression induced NK cell resistance bydownregulating ICAM1Tumorigenic cancer cells must escape from immune cellsindividually because a few cells will unlikely be insufficientfor successfully establishing an immune suppressive environment from the initial stage all the way through tumortissue formation. Tumorigenic cancer cells might evadeNK cell attack by regulating membrane surface proteins[36], and we hypothesized that NANOG upregulates NKcell inhibitory factors or downregulates NK cell activationfactors in PCa cells. The gene expression profiles of thesefactors were analyzed in WT-, GFP- and GN-DU145 cellsby RNAseq (Fig. 3 A, Additional file 1: Figures. S4A andS5A). Upregulated inhibitory factors and immune checkpoint ligands were not detected in GN-DU145 cells (Fig. 3A left and Additional file 1: Figure S5A), while several activation factors were significantly downregulated in thesecells (Fig. 3 A right). We focused on ICAM1, the genemost highly expressed in WT- and GFP-DU145 cellsamong genes whose expression was suppressed more than2-fold in GN-DU145 cells compared with that in WT-
Saga et al. Journal of Experimental & Clinical Cancer Research(2019) 38:416Page 6 of 13AInhibitory receptorsActivation receptorsRAET1Glog10FRKM NAHLA-EHLA-AHLA-GHLA-HPVRMICA, GFPNANOGNANOGICAM1MergeWTWT #1 #2 #3 #1 #2 #3NANOGGNGFPβ-ACTINFig. 3 NANOG overexpression downregulates ICAM1 expression. (a) RNAseq analysis of WT-, GFP-, and GN-DU145 cells. The expression levels ofNK cell inhibitory receptors and activation receptors were compared among these cells. (b) ICAM1 expression was detected in WT-, GFPand GNDU145 cells by western blot. (c) ICAM1 localization was detected in WT- and GN-DU145 cells by immunofluorescence stainingand GFP-DU145 cells (both P-values 0.00005). ICAM1downregulation at the protein level was also detected inGN-DU145 cells compared with that in WT- and GFPDU145 cells (Fig. 3 B). Moreover, ICAM1 expression wasinhibited by NANOG overexpression in another PCa cellline (22Rv1) (Additional file 1: Figure S5B). ICAM1, atype-1 transmembrane protein that is localized on the cellsurface, activates NK cells via binding to LFA1 [37, 38].ICAM1 localization was detected by immunofluorescencestaining, revealing that WT-DU145 cells expressedICAM1 on the plasma membrane, while GN-DU145 cellsdid not express ICAM1 (Fig. 3 C). Taken together, theseresults demonstrated that NANOG overexpression downregulated ICAM1 expression in PCa cells.Next, we investigated whether ICAM1 downregulation isresponsible for the NK cell resistibility of PCa cells. Theviabilities of WT-, GFP- and GN-DU145 cells and WT-,GFP- and GN-PC3 cells were measured after coculture withMTA cells treated with either an ICAM1 neutralizing antibody or a control IgG. ICAM1 neutralization significantlyinhibited the cell deaths of WT and GFP-DU145 cells andWT and GFP-PC3 cells; however, the survival rates of GNDU145 and GN-PC3 cells were not different between thegroups treated with the ICAM1 antibody and the controlIgG (Fig. 4 A). Moreover, ICAM1-overexpressing GNDU145 (ICAM1/GN-DU145) cells were generated (Fig. 4B), and their resistance against MTA cells was measured bythe MTS assay (Fig. 4 C). Although GN-DU145 cells wereable to escape from MTA attack, the survival rate ofICAM1/GN-DU145 cells was decreased by 60–70% afterMTA attack. Furthermore, ICAM1/GN- and GN-DU145cells were intradermally transplanted onto the backs of
Saga et al. Journal of Experimental & Clinical Cancer ResearchDU145Cell viability (%)120100PC3 Control IgG anti-ICAM1 ICAM1/GNCell viability (%)WT #1 #2 #3 #1 #2 #3 #1 #2 0GN1000*ICAM1/GN*5000GNICAM1/GNNK cell neutralization*Tumor volume (mm3)Control*****GFPDTumor volume (mm3) Control IgG anti-ICAM1 Ab0WTBPage 7 of 13120N.S.*Cell viability (%)A(2019) 38:4160 30 35 40 45 50 55 60(Day)1500GN1000ICAM1/GNN.S.50000 30 35 40 45 50 55 60(Day)Fig. 4 ICAM1 downregulation induces NK cell resistance (a) The viabilities of DU145 and PC3 cells (WT, GFP, and GN) were measured afterperforming the NK cell resistance assay with or without the ICAM1 neutralizing antibody in vitro (n 3, *P 0.005, **P 0.0001, Student’s t test).(b) Generation of ICAM1-overexpressing GN-DU145 cells. (c) The viabilities of GFP-, GN- and ICAM1/GN-DU145 cells were measured afterperforming the NK cell resistance assay in vitro (n 3, *P 0.01, **P 0.001, ***P 0.0001, Tukey-Kramer test). (d) ICAM1/GN- and GN-DU145 cellswere transplanted onto SCID mice treated with an anti-asialo GM1 Ab or control IgG. Respective tumor volumes were measured for up to 60days after the transplantation (n 4, *P 0.05, Student’s t test)NKneut- and Cont-SCID mice, and their respective tumorigenic potentials were observed. GN-DU145 cells were capable of forming tumors in both types of SCID mice, whileICAM1/GN-DU145-derived tumors were not detected inCont-SCID mice (Fig. 4 D). Therefore, these data suggestthat NANOG overexpression induced NK cell resistance inPCa cells by downregulating ICAM1.NANOG downregulates ICAM1 expression by inhibitingp300 recruitmentIn our experiments, NANOG was shown to inhibit ICAM1expression. It was previously reported that ICAM1 expression was downregulated by ICAM1-targeting miRNA (miR296-3p) in PCa [39], however, NANOG overexpression didnot increase miR-296-3p expression (Additional file 1:Figure S5C). To investigate how NANOG downregulatesICAM1 transcription, we assessed the ability of NANOG tobind the ICAM1 promoter region. NANOG ChIP qPCRanalysis was performed to detect binding between NANOGand the ICAM1 promoter region (Fig. 5 A), revealing thatNANOG binding was significantly increased in GN-DU145cells compared with that in WT- and GFP-DU145 cells.These results suggest that NANOG binds to the ICAM1promoter region. Next, to investigate the mechanism bywhich NANOG controls ICAM1 transcription, ChIPseqanalysis was performed on WT-, GFP- and GN-DU145 cells(Fig. 5 B and Additional file 1: Figure S4B). RNAseq analysis(Fig. 3 A) showed remarkably decreased ICAM1 transcription levels in GN-DU145 cells compared with those in WTand GFP-DU145 cells; according to these results, histone
Saga et al. Journal of Experimental & Clinical Cancer ResearchC20Page 8 of 131.5****ICAM1/18S(Relative expression)NANOG ChIP-qPCR(Relative ratio)A(2019) 38:41615105*1.00.5N.S.0.00WTGFP(C646 AM5ICAM4ZGLP1 FDX1LRAVER1ICAM3Fig. 5 ICAM1 expression is regulated by p300 (a) ChIP qPCR analyses of NANOG expression in WT-, GFP-, and GN-DU145 cells (n 3, **P 0.0001,Tukey-Kramer test). (b) ChIPseq and RNAseq analyses of the region surrounding the ICAM1 gene locus in WT- (black), GFP- (green), and GNDU145 (red) cells. (c) ICAM1 expression levels in GFP- and GN-DU145 cells treated with or without C646 (n 3, *P 0.01, **P 0.0001,Tukey-Kramer test)H3 lysine 27 acetylation (H3K27Ac), a known transcriptionactivation marker, was decreased on the ICAM1 gene inGN-DU145 cells (Fig. 5 B). H3K27 acetylation is induced byp300 histone acetyltransferase, a transcription coactivator[40]. In fact, p300 bound to the ICAM1 promoter region inWT- and GFP-DU145 cells, while significantly decreasedp300 binding in this region was observed in GN-DU145cells (Fig. 5 B). Next, GFP- and GN-DU145 cells were cultured with a p300 inhibitor (C646); GN-DU145 cells maintained a low level of ICAM1 expression in both thepresence and absence of C646, while the ICAM1 expressionin GFP-DU145 cells was inhibited by C646 in a dosedependent manner (Fig. 5 C). Therefore, p300 contributedto the regulation of ICAM1 transcription. To exclude thepossibility that an extra GFP protein fused with NANOG toinhibit the p300 association, ICAM1 expression wasdetected in DU145-overexpressing GFP-P2A-NANOG(GN-P2A) cells, which were divided into GFP and NANOGportions via P2A cleavage [41] (Additional file 1: FigureS5D). Because GN-P2A-DU145 cells expressed ICAM1 atlow levels, like GN-DU145 cells (Additional file 1: Fig. S5D),the GFP protein likely did not inhibit the p300 associationin the ICAM1 promoter region. Taken together, theseresults suggested that NANOG overexpression induced theNANOG association and p300 dissociation to/from theICAM1 promoter region and consequently inhibitedICAM1 transcription.ICAM1 downregulation is a critical mechanism by whichcells escape NK cell attackUp to this point, ICAM1 downregulation was shown toinduce NK cell resistance in exogenous NANOGovere
CIC-like phenotypic cancer cells, which exhibit high tumorigenic activity, have been identified in various tumor tissues and cultured cancer cells [15-19]andhaveadis-tinctive gene expression profile unlike that of normal can-cer cells [20, 21]. In particular, the upregulation of stem cell factors,e.g.,NANOG,OCT4andSOX2,aredistinguishing