Transcription
After-School Programs in Public Elementary Schoolswww.ed.govAfter-School Programs inPublic Elementary SchoolsFirst Lookies.ed.gov2009NCES 2009-043U.S. DEPARTMENT OF EDUCATION
After-School Programs inPublic Elementary SchoolsFirst LookFebruary 2009Basmat ParsadLaurie LewisWestatPeter TiceProject OfficerNational Center for Education StatisticsNCES 2009–043U.S. DEPARTMENT OF EDUCATION
U.S. Department of EducationArne DuncanSecretaryInstitute of Education SciencesSue BetkaActing DirectorNational Center for Education StatisticsStuart KerachskyActing CommissionerThe National Center for Education Statistics (NCES) is the primary federal entity for collecting, analyzing,and reporting data related to education in the United States and other nations. It fulfills a congressionalmandate to collect, collate, analyze, and report full and complete statistics on the condition of education inthe United States; conduct and publish reports and specialized analyses of the meaning and significance ofsuch statistics; assist state and local education agencies in improving their statistical systems; and review andreport on education activities in foreign countries.NCES activities are designed to address high-priority education data needs; provide consistent, reliable,complete, and accurate indicators of education status and trends; and report timely, useful, and high-qualitydata to the U.S. Department of Education, the Congress, the states, other education policymakers,practitioners, data users, and the general public. Unless specifically noted, all information contained herein isin the public domain.We strive to make our products available in a variety of formats and in language that is appropriate to avariety of audiences. You, as our customer, are the best judge of our success in communicating informationeffectively. If you have any comments or suggestions about this or any other NCES product or report, wewould like to hear from you. Please direct your comments toNational Center for Education StatisticsInstitute of Education SciencesU.S. Department of Education1990 K Street NWWashington, DC 20006-5651February 2009The NCES World Wide Web Home Page address is http://nces.ed.gov.The NCES World Wide Web Electronic Catalog is http://nces.ed.gov/pubsearch.Suggested CitationParsad, B., and Lewis, L. (2009). After-School Programs in Public Elementary Schools. (NCES 2009–043). NationalCenter for Education Statistics, Institute of Education Sciences, U.S. Department of Education. Washington,DC.For ordering information on this report, write toU.S. Department of EducationED PubsP.O. Box 1398Jessup, MD 20794-1398or call toll free 1-877-4ED-Pubs or order online at http://www.edpubs.org.Content ContactPeter Tice(202) 502-7497peter.tice@ed.gov
AcknowledgmentsThe authors would like to recognize the respondents from public elementary schools who provideddata on after-school programs upon which the report is based. We also thank the Westat staff for theirvarious contributions, including data collection, computer programming, research support, and editorialand word processing support.iii
This page intentionally left blank.
ContentsPageAcknowledgments .iiiList of Tables .viAppendix A Tables .viiFirst Look Summary . 1Introduction. 1Selected Findings . 2Tables. 5References. 17Appendix A: Standard Error Tables .A-1Appendix B: Technical Notes. B-1Appendix C: Questionnaire . C-1v
List of TablesTable1234567891011PageNumber of public elementary schools and percent reporting that formal afterschool programs were located at the school, by type of program and selectedschool characteristics: 2008.5Percent of public elementary schools reporting that one or more stand-aloneacademic instruction/tutoring programs were located at the school, by type ofprogram and selected school characteristics: 2008.6Percentage distribution of public elementary schools reporting the number offormal after-school programs that were located at the school, by selected schoolcharacteristics: 2008 .7Total enrollment in formal after-school programs at public elementary schoolsand percentage distribution of enrollments in various types of programs,by selected school characteristics: 2008 .8Percentage distribution of public elementary schools with fee-based stand-aloneday care programs reporting the number of hours per week that the programoperated at the school, by selected school characteristics: 2008 .9Percentage distribution of public elementary schools with various types ofstand-alone academic instruction/tutoring programs reporting the number ofhours per week that the program operated at the school, by selected schoolcharacteristics: 2008 .10Percentage distribution of public elementary schools with 21st CenturyCommunity Learning Centers (21st CCLCs) reporting the highest grade servedby the Center and the Center’s hours of operation, by selected schoolcharacteristics: 2008 .11Percentage distribution of public elementary schools with various types of afterschool programs reporting that transportation home was provided for students inthe program: 2008.12Percent of public elementary schools with various types of after-schoolprograms reporting that transportation home was provided for some or allstudents in the program, by selected school characteristics: 2008.13Percentage distribution of public elementary schools with various types of afterschool programs reporting the extent to which various factors hindered studentsfrom participating in the program: 2008.14Percent of public elementary schools reporting that their students attendedvarious types of formal after-school programs at another location, by selectedschool characteristics: 2008.15vi
Appendix A TablesTable1a2a3a4a5a6a7a8a9a10a11aPageStandard errors for the number of public elementary schools and percentreporting that formal after-school programs were located at the school, by typeof program and selected school characteristics: 2008 .A-3Standard errors for the percent of public elementary schools reporting that oneor more stand-alone academic instruction/tutoring programs were located at theschool, by type of program and selected school characteristics: 2008 .A-4Standard errors for the percentage distribution of public elementary schoolsreporting the number of formal after-school programs that were located at theschool, by selected school characteristics: 2008.A-5Standard errors for the total enrollment in formal after-school programs atpublic elementary schools and percentage distribution of enrollments in varioustypes of programs, by selected school characteristics: 2008 .A-6Standard errors for the percentage distribution of public elementary schools withfee-based stand-alone day care programs reporting the number of hours perweek that the program operated at the school, by selected school characteristics:2008 .A-7Standard errors for the percentage distribution of public elementary schools withvarious types of stand-alone academic instruction/tutoring programs reportingthe number of hours per week that the program operated at the school, byselected school characteristics: 2008 .A-8Standard errors for the percentage distribution of public elementary schools with21st Century Community Learning Centers (21st CCLCs) reporting the highestgrade served by the Center and the Center’s hours of operation, by selectedschool characteristics: 2008.A-9Standard errors for the percentage distribution of public elementary schools withvarious types of after-school programs reporting that transportation home wasprovided for students in the program: 2008.A-10Standard errors for the percent of public elementary schools with various typesof after-school programs reporting that transportation home was provided forsome or all students in the program, by selected school characteristics: 2008.A-11Standard errors for the percentage distribution of public elementary schools withvarious types of after-school programs reporting the extent to which variousfactors hindered students from participating in the program: 2008.A-12Standard errors for the percent of public elementary schools reporting that theirstudents attended various types of formal after-school programs at anotherlocation, by selected school characteristics: 2008 .A-13vii
This page intentionally left blank.
First Look SummaryIntroductionHow school-age children spend their time after school is a topic of interest among educators,policymakers, researchers, and parents. Many parents choose to have their children attend after-schoolprograms, which may provide diverse services such as academic instruction, cultural enrichment, safe places tostay, and adult supervision for children (Carver and Iruka 2006; James-Burdumy et al. 2005; Kleiner, Nolin,and Chapman 2004). Prior research on the topic indicates that before- and after-school day care programswere more prevalent at elementary schools than secondary or combined schools in 2004 (44 percent versus 5and 14 percent, respectively), and half of all public elementary schools offered after-school academicinstruction programs for students who needed academic assistance (Strizek et al. 2006).This study provides a national profile of various types of formal after-school programs physicallylocated at public elementary schools in 2008. Examples of formal after-school programs include extended daycare programs, academic instruction/tutoring programs, and 21st Century Community Learning Centers.Formal after-school programs exclude clubs or activities that are offered as school-sponsored extra curricularactivity. In this report, stand-alone programs refer to after-school programs that focus primarily on a singletype of service (e.g., only day care) while broad-based programs refer to after-school programs that provide acombination of services (i.e., multiple activities such as academic enrichment and cultural activities). Thisreport further categorizes after-school programs into four types. Fee-based stand-alone day care programs refer to after-school day care for which parents paidfees. These programs operate primarily to provide adult supervision for students after school,although the programs may incorporate homework help, recreational activities, and culturalenhancement activities such as arts and crafts. Stand-alone academic instruction/tutoring programs focus exclusively on academic instructionor tutoring to improve student performance in core academic subject areas such as math, reading,and science. Programs include the Supplemental Educational Services (SES) in schools that did notmake Adequate Yearly Progress (AYP), other stand-alone programs that focus on improvingacademic standards of students who are at risk of school failure, and programs that may provideadditional academic exposure for students who are doing well in school. 1 The 21st Century Community Learning Centers (21st CCLCs) are administered through thefederally funded 21st CCLC Program to provide academic enrichment opportunities, includinginstruction in core academic subjects and a broad array of enrichment activities, to complementregular academic programs. These broad-based after-school programs have a core academiccomponent and additional components in areas such as art, music, drama, technology education,and counseling. 21Supplemental Educational Services (SES) are a component of Title I of the Elementary and Secondary Education Act as reauthorized by the NoChild Left Behind Act (NCLB). Under this legislation, schools that did not make Adequate Yearly Progress (AYP) are required to provide extraacademic assistance for eligible children. For more information, go to oc.2Under Title IV of the Elementary and Secondary Education Act (ESEA), the 21st Century Community Learning Center (21st CCLC) Programprovides funds for 21st CCLCs to offer academic enrichment opportunities during non-school hours for children, particularly students whoattend high-poverty and low-performing schools. The program is designed to help students meet state and local student standards in coreacademic subjects, offer students a broad array of enrichment activities that can complement regular academic programs, and provide literacyand other educational services to the families of participating children. For more information, go tohttp://www.ed.gov/programs/21stcclc/index.html.1
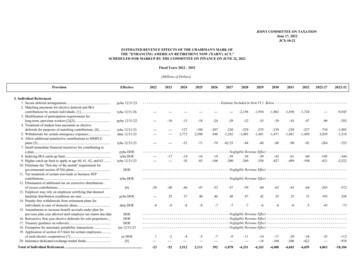
Other types of formal stand-alone or broad-based after-school programs include a variety ofstand-alone and broad-based after-school programs that do not fit into the above-named categories.For example, some broad-based programs may be former 21st CCLCs that continue to offer thesame kinds of services, often as fee-based programs. Examples of stand-alone after-schoolprograms other than fee-based day care and academic instruction/tutoring programs include thosethat focus exclusively on topics such as fine arts or violence prevention.For each of the first three types of programs—fee-based stand-alone day care programs, stand-aloneacademic instruction/tutoring programs, and 21st CCLCs—the survey collected basic information on studentenrollment and program schedule. To provide current information about some of the key issues surroundingafter-school program offerings, the survey also collected information about transportation home for students,whether students from other schools attend the program, and the extent to which selected factors reportedlyhinder students from participating in the programs. The survey also collected similar information about allother types of formal after-school programs, including data on the number of programs, student enrollment,transportation home for students, and factors reported to hinder student participation. To complete the pictureof student participation in after-school programs, the survey asked schools whether their students attend afterschool programs at other locations.The National Center for Education Statistics in the Institute of Education Sciences conducted the surveyin spring 2008 using the Fast Response Survey System (FRSS). FRSS is a survey system designed to collectsmall amounts of issue-oriented data from a nationally representative sample of schools, with minimal burdenon respondents and within a relatively short period of time. Questionnaires were mailed to approximately1,800 public elementary schools in the 50 states and the District of Columbia. The unweighted surveyresponse rate was 91 percent, as was the weighted response rate. Data were adjusted for questionnairenonresponse and weighted to yield national estimates that represent all public elementary schools in the UnitedStates.Because the purpose of this report is to introduce new NCES data through the presentation of tablescontaining descriptive information, only selected findings are presented. These findings have been chosen todemonstrate the range of information available from the FRSS study rather than to discuss all of the observeddifferences; they are not meant to emphasize any particular issue. The findings are based on self-reported datafrom public elementary schools. Some of the survey responses (e.g., small, moderate, and large extent) werenot defined for respondents.All specific statements of comparisons made in the bullets have been tested for statistical significance atthe .05 level using Student’s t-statistics to ensure that the differences are larger than those that might beexpected due to sampling variation. Adjustments for multiple comparisons were not included. Many of thevariables examined are related to one another, and complex interactions and relationships have not beenexplored. Tables of standard error estimates are provided in appendix A. Detailed information about thesurvey methodology is provided in appendix B, and the questionnaire can be found in appendix C.Selected FindingsThis section presents key findings on after-school programs at public elementary schools. Of the estimated 49,700 public elementary schools in the nation, 56 percent reported that one ormore after-school programs were physically located at the school in 2008 (table 1). Forty-sixpercent of all public elementary schools reported a fee-based stand-alone day care program, 43percent reported one or more stand-alone academic instruction/tutoring programs, and 10 percentreported a 21st CCLC.2
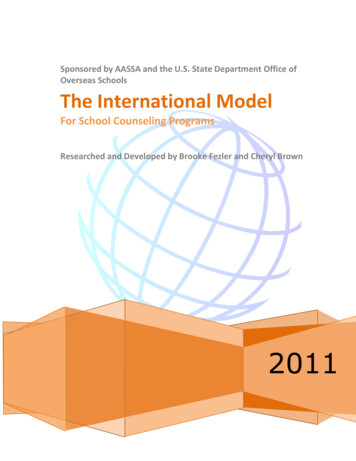
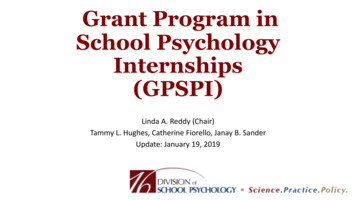
One-tenth of public elementary schools indicated that they provided SES (table 2). Theseprograms, required to be offered by schools that do not make Adequate Yearly Progress under theNo Child Left Behind legislation, were reported by 20 percent of city schools, 21 percent of highminority schools, and 23 percent of high poverty schools. Eighteen percent of all public elementary schools reported one formal after-school program, 23percent reported two programs, 14 percent reported three or more programs, and 44 percentindicated that no formal after-school programs were located at the school (table 3). Public elementary schools reported an estimated 4 million enrollments in formal after-schoolprograms at public elementary schools (table 4). These include duplicated enrollments because astudent could be counted more than once if he/she enrolled in more than one program. Fee-basedstand-alone day care accounted for 34 percent of the total enrollments in after-school programs,stand-alone academic instruction/tutoring programs accounted for 39 percent, 21st CCLCsaccounted for 11 percent, and other types of formal after-school programs accounted for 16 percent. Of the schools that offered fee-based stand-alone day care, 23 percent indicated that the programoperated less than 15 hours per week, 52 percent reported that the program operated 15 to 19 hoursper week, and one-fourth indicated that the program operated for 20 or more hours per week(table 5). Among schools that offered various types of stand-alone academic instruction/tutoringprograms, the proportion reporting that the programs operated for 5 or more hours per week rangedfrom 29 to 34 percent (table 6). Of the schools that offered 21st CCLCs, 21 percent indicated thatthe program operated less than 10 hours per week, 35 percent reported that the program operated 10to 14 hours per week, and 45 percent reported that the program operated for 15 or more hours perweek (table 7). Forty-one percent of public elementary schools with 21st CCLCs reported that their 21st CCLCprovided transportation home for students; 37 percent of the schools with stand-alone academicinstruction/tutoring programs reported providing transportation home; 4 percent of the schools withfee-based stand-alone day care reported providing transportation home; and 24 percent with othertypes of after-school programs indicated that the school provided transportation home for students(tables 8 and 9). Among public elementary schools with fee-based stand-alone day care that was operated by theschool or district, 38 percent indicated that cost to parents hindered student participation in theprogram to a moderate or large extent, 23 percent reported that the lack of/inadequate transportationhindered student participation to a moderate or large extent, and 21 percent indicated thatinsufficient slots hindered student participation to a moderate or large extent (derived from table10). Thirteen percent of the schools with 21st CCLCs reported that the lack of/inadequatetransportation hindered student participation in the program to a moderate or large extent, and 29percent indicated that insufficient slots hindered student participation in the program to a moderateor large extent. Forty-six percent of public elementary schools reported that their students attended fee-based standalone day care at another location, 22 percent reported that students attended stand-alone academicinstruction/tutoring programs, 3 percent reported that students attended 21st CCLCs, and 8 percentreported that students attended other types of formal after-school programs at another location(table 11).3
This page intentionally left blank.
Table 1.Number of public elementary schools and percent reporting that formal after-schoolprograms were located at the school, by type of program and selected schoolcharacteristics: 2008Percent of schools with:Selected characteristicAll public elementary schools .Fee-basedstand-aloneday 21st CenturyCommunityLearningCenterOther typesof formalstand-aloneor broadbased 612131222Total numberof publicelementaryschoolsAny formalafter-schoolprogram49,700Enrollment sizeLess than 300.300 to 499.500 or more .School localeCity.Urban fringe .Town .Rural.RegionNortheast .Southeast .Central.West .Percent minority enrollmentLess than 6 percent .6 to 20 percent .21 to 49 percent .50 percent or more.Percent of students eligible for free orreduced-price lunchLess than 35 percent .35 to 49 percent .50 to 74 percent .75 percent or 773159201Other types of formal after-school programs are after-school programs other than fee-based stand-alone day care, stand-alone academicinstruction/tutoring programs, and 21st Century Community Learning Centers.NOTE: Percents do not sum to 100 because schools could report more than one formal after-school program.SOURCE: U.S. Department of Education, National Center for Education Statistics, Fast Response Survey System (FRSS), “After-SchoolPrograms in Public Elementary Schools,” FRSS 91, 2008.515101522
Table 2.Percent of public elementary schools reporting that one or more stand-alone academicinstruction/tutoring programs were located at the school, by type of program andselected school characteristics: 2008Selected characteristicAll public elementary schools .One or more standalone academicinstruction/tutoringprogramsType of stand-alone academic instruction/tutoring programOther stand-aloneacademicOther types ofinstruction/stand-aloneSupplementaltutoring programacademicEducationfor students whoinstruction/Services (SES)need assistancetutoring 545212826344477814Enrollment sizeLess than 300.300 to 499.500 or more .School localeCity.Urban fringe .Town .Rural.RegionNortheast .Southeast .Central .West.Percent minority enrollmentLess than 6 percent .6 to 20 percent .21 to 49 percent .50 percent or more.Percent of students eligible for free orreduced-price lunchLess than 35 percent .35 to 49 percent .50 to 74 percent .75 percent or more.29424845836743838959234416NOTE: Percentages are based on the estimated 49,700 public elementary schools in the nation. Percents do not sum to the percent of publicelementary schools with academic instruction/tutoring programs because schools could report more than one type of program.SOURCE: U.S. Department of Education, National Center for Education Statistics, Fast Response Survey System (FRSS), “After-SchoolPrograms in Public Elementary Schools,” FRSS 91, 2008.6
Table 3.Percentage distribution of public elementary schools reporting the number of formalafter-school programs that were located at the school, by selected school characteristics:2008School characteristicAll public elementary schools .No program1 program2 programs3 or 7172025321481118Enrollment sizeLess than 300.300 to 499.500 or more .School localeCity.Urban fringe .Town .Rural.RegionNortheast .Southeast .Central .West.Percent minority enrollmentLess than 6 percent .6 to 20 percent .21 to 49 percent .50 percent or more.Percent of students eligible for free orreduced-price lunchLess than 35 percent .35 to 49 percent .50 to 74 percent .75 percent or more.NOTE: Percentages are based on the estimated 49,700 public elementary schools in the nation. Detail may not sum to totals because ofrounding.SOURCE: U.S. Department of Education, National Center for Education Statistics, Fast Response Survey System (FRSS), “After-
After-School Programs in After-School Programs in Public Elementary Schools Public Elementary Schools NCES 2009-043 U.S. DEPARTMENT OF EDUCATION ies.ed.gov First Look www.ed.gov