Transcription
University Turbine Systems Research2012 Fellowship ProgramFinal ReportPrepared for:General Electric CompanyGas Turbine AerodynamicsMarion Building300 Garlington RdGreenville, SC 29615, USAPrepared by:Shelby E NelsonDepartment of Mechanical EngineeringUniversity of Nevada, Las Vegas4505 S. Maryland ParkwayLas Vegas, NV 89154Date Submitted:August 9, 2012
ContentsAbstract . 3Introduction . 3Part-Span Shroud Cascade . 4ICEM Meshing . 5Pressure Ratio Sweep . 6Next Generation Gas Turbine Phase I Rig . 7Tip Clearance Study . 8Squealer Tip. 10Reynolds Number Sensitivity . 12MATLAB Script . 13Conclusion . 14Acknowledgements. 152
AbstractEngineers on the Gas Turbine Aerodynamics team at GE Energy create state-of-the-arttechnology that goes into high performing industrial gas turbines. To create such advancedmachines, computational fluid dynamics tools are used to analyze the inner workings of theturbine. These tools model the turbine quite well; however, they must be validated with actualtest data. Engineers create turbine rigs with different experimental configurations to testcertain aspects that go into a design. These rigs are important because engineers need tounderstand if their use of computational fluid dynamics is true to the physics of what is actuallyhappening.IntroductionComputational fluid dynamics (CFD) is used by engineers in Turbine Aero to understand howthe fluid moves through the turbine which allows for a better design. To perform CFD, meshingthe fluid domain of the problem is required. After meshing, boundary conditions are applied tothe model, such as total pressure at the inlet and exit. Then a CFD program solves fluidsequations, such as the Navier-Stokes equations, over a period of specified iterations until a finalvalue is reached. Once this final value is reached, the problem is converged and the case isready for post-processing.Post-processing involves examining the results from CFD. Different programs can be used forpost-processing cases which allow for visualizing the flow by either a graphical contour plot ofthe airfoil or through basic line plots made in Excel or MATLAB. CFD results can be compared torig test data in order to validate the model used for CFD. An accurate representation of the CFDmodel is important because engineers must understand the fluid mechanics of the turbine todesign for the optimum efficiency.Three major projects are explained in this report. For the first project, the Part-Span ShroudCascade is meshed in ICEM to show proper meshing techniques. A pressure ratio sweep wasperformed using CFD to analyze the effects of having a part-span shroud in steam turbines. Thecases are post-processed and the bladerow efficiency is plotted. For the second project, a studyis conducted on the Next Generation Gas Turbine Phase I Rig to show how changing the tipclearance and Reynolds number affects the performance. The CFD results are compared toactual rig test data. For the third project, a MATLAB script was created to plot the loadingdistribution at one span of a transient case.3
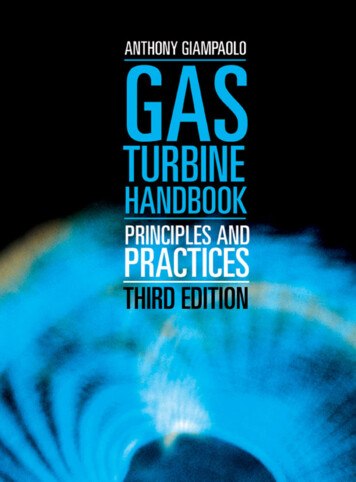
Part-Span Shroud CascadeA part-span shroud is placed in the middle in the latter stage buckets in steam turbines toprovide extra mechanical damping. Although this provides a structural advantage, theengineers concerned with aerodynamics have to optimize the design of the shroud to minimizeloss to the aerodynamic performance. Figure 1 shows two buckets joined together with a partspan shroud.Figure 1 - Example of a Part-Span ShroudTo understand how the aerodynamics is affected in steam turbine buckets with part-spanshrouds, a cascade test rig is being built. Figure 2 shows a cross-section of a typical cascade testrig. The blades shown above are in the green section of the diagram. The boundary conditionsgoing into the inlet will be carefully matched to the conditions in an actual turbine. After thistest is conducted, the results will be compared to the CFD pre-test predictions. This analysis isimportant because it is important to understand part-span shroud applications in steam turbinelast stage buckets.Figure 2 - Test Rig Configuration4
ICEM MeshingMeshing is an important aspect of CFD analysis. Ansys ICEM was used to mesh a twodimensional cross-section of the cascade. To mesh the cascade, ICEM uses an unstructured 2Dtetra grid to randomly fill the shape of the geometry. As seen by Figures 3 and 4, the meshresolution is dense enough to allow for a proper representation of the fluid mechanics. There ishigher resolution around the airfoil to properly capture its curved geometry.Figure 3 - Fine mesh around airfoilFigure 4 -Close-up of mesh around leadingedge of an airfoilBoundary layers must also be considered when meshing. A prism mesh is used on the border ofthe geometry to account for the boundary layer. As opposed to a tetra mesh, a prism mesh is astructured grid where the cells are stacked on top of each other. Figure 5 shows a prism meshon the border of the cascade casing geometry. The cells of the prism mesh seem to decreasesize as the cells get closer to the border of the geometry. This is another technique used tocapture the boundary layer profile on the surface.Figure 5 - Prism mesh example5
Pressure Ratio SweepTo simulate different engine operating conditions, a pressure ratio sweep was done in CFD onthe part-span shroud cascade. An airfoil with a part-span shroud is compared to an airfoilwithout a part-span shroud. Figure 6 is a contour plot of the Mach number of the two differentcases. There is a strong shock on the suction side of the airfoil that can be seen by the redorange color which indicates high Mach numbers. There is also a shock that comes off of thepart-span shroud. The curvature of the shroud causes the flow to be accelerated creatinganother shock. The two shocks are also visible in Figure 7 which is a 2D axial cut downstream ofthe trailing edge for the case with and without the shroud.The cascade was also tested to see how it behaves at various pressure ratio conditions. Figure 8shows a low pressure ratio on the left airfoil, the design point in the middle, and the highpressure ratio on the right airfoil. The lower pressure ratio case has significantly lower Machnumbers than the higher pressure ratio case. The effect of the shock from the part-span shroudseems to be less prominent on the higher pressure ratio case. The shock near the trailing edgeis the dominating loss mechanism.Figure 6Case with PSS and withoutPSSFigure 72D Profile Aft of PSSFigure 8Pressure Ratio Sweep6
Next Generation Gas Turbine Phase I RigThe Next Generation Gas Turbine Phase I Rig is a test rig used to validate CFD code that theTurbine Aero team use when designing airfoils. The Phase I Rig is a 1/5 scaled model of the 7FBindustrial gas turbine engine. Figure 9 shows the three stage turbine rig set up. This rig onlytests the turbine section of the complete gas turbine. The compressor section was used at thetest facility to provide the specified turbine inlet conditions.Figure 9As seen by Figure 10, the test rig is an accurate scaled down representation of the actualturbine section of an engine. There are cooling flow circuits to represent the secondary flowthat occurs within an engine.Figure 107
Tip Clearance StudyMuch of the loss that is attributed to a turbine is seen in leakage over the tip of unshroudedblades. Since there must be a clearance from the top of the first stage bucket so that the tip ofthe blade does not rub the casing, flow leaking over the tip of the blade is inevitable. The flowthat leaks over the tip is considered a loss mechanism because the bucket is not extractingwork from this flow.There were two measurement devices in the Phase I Rig that are used to compare to the CFD: atraverse probe and kiel heads. A traverse probe is a device that measures total pressure andtemperature between two nozzles. It traverses the span of the nozzle and measures datacontinuously from the hub to the tip. A kiel head measures total pressure and temperature atdiscrete points on the leading edge of the nozzle.CFD was used to analyze three separate cases: closed clearance, nominal clearance, and openclearance. The data from the traverse probe was compared to the CFD results. The kiel headtotal pressure test data was also compared with the results from CFD seen in Figure 11. Thepoints on the graph are the test data points. The dashed lines represent the CFD at differentclearances. The CFD is represented as a line instead of discrete points because it is an averagetaken at the location of the kiel heads. Although the CFD and the data are not a perfect match,the CFD seems to follow the overall trend of the kiel head data.Figure 118
Figure 12 shows the overall efficiency of the different clearances compared with test datawhere the middle point is the nominal clearance. The CFD curve has a more pessimistic trendthan the actual test data. This can be seen in the slope of the two curves. The CFD predicts amore drastic effect in efficiency as the tip gap increases. A larger tip gap will decrease turbineefficiency.Figure 12To get a visual representation of the flow leaking over the tip, streamlines were plotted usingthe GE in-house post-processing software. Figure 13 shows the streamlines over the tip withthree different planes. The colors represent total pressure with blue being the lowest pressureand orange being the highest pressure. Plane 1 is the most upstream and Plane 3 is the mostdownstream. As shown by the figure, the streamlines coming over the tip create a loss vortexwhere no work is being done on this flow. This is seen by the blue region of low pressure on theplane cuts. As the vortex travels downstream it mixes with the flow that the bucket has donework on.Figure 139
Squealer TipIn the previous section, a flat tip was modeled for simplicity during CFD calculations. However,a squealer tip, a cavity on the top of a bucket, exists on the actual geometry to reduce over tipleakage. The squealer tip traps the fluid leaking over the tip in the squealer cavity making it amore torturous path for the fluid which decreases the overall leakage.The squealer tip geometry was modeled in CFD. A contour plot of the loss in the bucket is seenin the figures below. Figure 14 shows the loss with the squealer tip geometry, and Figure 15shows the loss with the simplified flat tip geometry. Streamlines are added to give a visualrepresentation of how the flow travels over the tip. The flow leaking over the tip creates avortex seen by the red high-loss circular region near the upper right corner of the 2D cut. Thisred region is greater on the bucket with the flat tip geometry implying that the squealer tipgeometry decreases the over tip leakage.Figure 14 - Squealer Tip LossFigure 15 - Flat Tip Loss10
The overall efficiency trend of the squealer tip was also compared with the flat tip and testdata. Figure 16 shows that the performance of the squealer tip is better than the simplified flattip model, but it has a steeper slope than the data and the flat tip model which means that thesquealer tip is more sensitive to change in clearance than the flat tip or test data. Since the testdata was taken from the rig which has the squealer tip geometry, it was expected that thesquealer tip geometry should better match the trend of the test data. This unexpected resultcould be grid related. Further investigation must be done to account for this counter-intuitiveresult.Figure 1611
Reynolds Number SensitivityA Reynolds number sensitivity sweep was conducted by changing the inlet pressure andkeeping the same pressure ratio across the turbine. The goal was to compare the data acquiredin the rig test to the results from the CFD cases and to plot the overall efficiencies. During thetest, the rig was operated at a range from a low Reynolds number, or a low inlet pressure, to ahigh Reynolds number, or high inlet pressure. To compare the results from the test, the fourcases were modeled with CFD. The CFD was performed using a fully turbulent model.The loading diagrams were compared for each of the cases to make sure that the pressureratios and corrected speed are the same with only Reynolds number varying between eachcase. Due to its proprietary nature, these results cannot be discussed any further.Figure 17 shows the efficiency trend of the data compared with the results of CFD. The red dotsare the test points and the black line represents the CFD. The CFD matches the rig test datafairly well. A possible reason for the CFD not matching the data perfectly is because the initialassumption that that the rig is fully turbulent may not be entirely correct. A transition modelmight be a better assumption. The next step would be to model the different cases using atransition model and plotting the overall efficiency with the rig test data.Figure 1712
MATLAB ScriptThe traditional way of post-processing cases is to take data from the CFD results and plot thedata in Excel. Creating loading diagrams, for example, is time consuming because each data filehas to be imported into Excel and plotted. This can be especially cumbersome for transientcases where there are multiple moments in time at different spans of the airfoil. For a transientcase, there is a directory for each span. Within each directory, there are different data files foreach different moment in time for that span. Within each data file, there are columns of datathat must be plotted. A tool that will allow the user to choose which columns from the data fileto plot and which spans to plot is needed.A script was written in MATLAB to plot the loading diagram at each time step on one graph.This is useful to see how the surface loading at each time step. As can be seen in Figure 18, theloading varies over time due to the effects of the upstream and downstream bucket. Currently,this program can only read in files from the directory where the code is executed. In the future,the code will be generalized to read in multiple time step files from a certain number ofdirectories specified by the user. The code will also have user inputs so the user will be able toplot other information besides loading plots.Figure 1813
ConclusionThe three major projects that were reported on offered different conclusions. For the part-spanshroud cascade, it was possible to get a decent mesh. The next step would be to perform a CFDanalysis and compare the results with test data after the test is conducted. The pressure ratiosweep that was performed using CFD offers a valid pre-test prediction to compare with actualresults from the test. These results will help the engineers understand the effects of having apart-span shroud in steam turbines.The tip clearance and Reynolds number sensitivity study done with CFD on the Next GenerationGas Turbine Phase I Rig compares relatively well to the rig test data. Some adjustments can bemade in the CFD model to better match the test data. Modeling the actual bucket geometry inCFD gave an expected higher performance than the flat tip, but lead to a steeper slope that willneed to be further investigated. Also instead of running the cases with a fully turbulentassumption for the Reynolds number sweep, a transition model assumption can be used andcompared with the data.The MATLAB script successfully plotted the transient loading distributions at one span, but willlater need to be generalized to be a suitable tool to use for a variety of cases. There will beinputs for the user to choose which particular parameters to plot.Overall, the results from the three projects performed during the UTSR fellowship will helpengineers continue to understand the fluid mechanics inside the turbine. These results will alsohelp perfect the design tools used to design better performing gas turbines.14
AcknowledgementsI would like to thank the University Turbine Systems Research fellowship program and GEEnergy for giving me the opportunity to work in the gas turbine field. Before I came to GEEnergy, I had a basic understanding of gas turbines that I gained in my turbomachinery classthat I took at school. Working with the engineers on the Turbine Aero team has allowed myclassroom knowledge to become less abstract theory and more practical. Actually experiencingengineering outside of a classroom through my UTSR fellowship allowed me to gain a deeperunderstanding and appreciation of the gas turbine field. Inspired by the knowledge I havegained at GE Energy on the Turbine Aero team, I am looking forward to starting a career in thegas turbine field.I would also like to thank Gunnar Siden for allowing me to work on the Turbine Aero team, mymentor, Sylvain Pierre, for giving me industry and graduate school advice, Neil Ristau for hisguidance through my assignments, and the entire Turbine Aero team for answering all myquestions and helping me understand gas turbines beyond what I would learn in the classroom.15
Meshing is an important aspect of CFD analysis. Ansys ICEM was used to mesh a two-dimensional cross-section of the cascade. To mesh the cascade, ICEM uses an unstructured 2D tetra grid to randomly fill the shape of the geometry. As seen by Figures 3 and 4, the mesh resolution is dense enough to allow for a proper representation of the fluid .