Transcription
Market Insight 2022Excess Capital Yield: A Better Framework for Value InvestingHighlightsVoya’s large cap value team believesthat excess capital yield (ECY) providesa holistic view of the amount of capital acompany has available to create value.We apply our ECY framework to evaluatestocks from a relative value perspectiveand construct a diversified portfolio with ahigher yield than the benchmark.AuthorsJames Dorment, CFAHead of Value Team andPortfolio ManagerDavid Zujkowski, CFAHead of Fundamental Analytics Excess capital yield (ECY), a recently developed metric, supplements traditionalvaluation measures. ECY provides a more holistic view of company’s ability to create value and generatesbetter returns and risk efficiency than traditional value metrics. Decomposition of ECY by skilled analysts is a key component of alpha generation.Adapting value investing to market changesValue investing, which was first developed by Graham and Dodd in the 1920s, hasstruggled to remain relevant over the past decade as mega-capitalization growth stockshave broadly outperformed value stocks. At Voya, we never stopped believing in valueinvesting but recognize that successful value investors must evolve with the changingmarket environment. Over the past several years, we have enhanced our large cap valuestrategy from a cornerstone focus on dividends to a framework we call “excess capitalyield” (ECY). In our view, excess capital yield is a more dynamic and effective framework,as it carries a broader, more consistent and less volatile relative performance profile thanmore conventional valuation measures. To illustrate these points, we first show how ECY iscalculated and incorporated into our investment process. Next, we show how it has beensuccessful over time, both on a standalone basis and compared to other value metrics.ECY widens the lens on value creationHistorically, the Voya large cap value strategy focused on dividend paying stocks, whichis a popular investment philosophy, rooted in academic literature. History tells us that thecombination of steady income and capital appreciation creates the potential to deliverattractive returns over a full market cycle. This remains true today, but is not withoutpitfalls. More important, dividend yield is an output, not an input, which is why the Voyavalue team has evolved its investment philosophy to ECY. We believe that ECY providesa more holistic view of the amount of capital a company has available to create value, notjust in the form of dividends but also in terms of mergers and acquisitions (M&A), sharebuybacks and internal investments.It’s important to note that the ECY focus is not solely on the raw number calculated, butrather on the decomposition of excess capital. The ECY analysis sparks a debate aboutthe state of the balance sheet, sales, margins and earnings power of a company over thenext several years and a company’s ability to convert those earnings into shareholderreturns. ECY is not a static output; it is a dynamic, forward-looking measure that seeks toquantify the “dry powder” available to management to create value in the form of dividendgrowth, share repurchases, accretive M&A and/or organic investment.For financial professional or qualified institutional investor use only. Not for inspection by, distribution or quotation to, the general public.
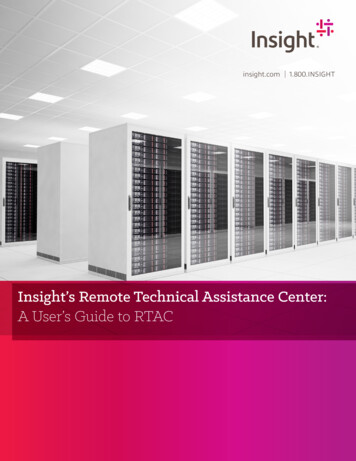
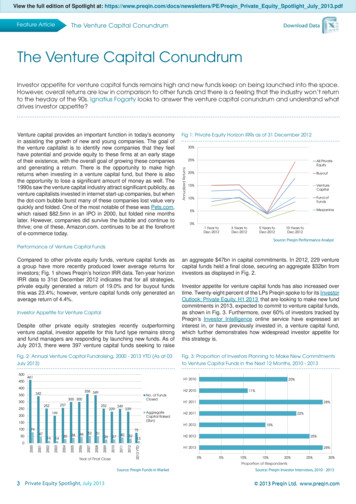
Market Insight 2022Excess Capital Yield: A Better Framework for Value InvestingCalculating excess capital yieldThe success of the Voya Large Cap Valuestrategy comes from the triangulation ofECY with relative value measures andqualitative, differentiated insights from ourexperienced team of sector analysts.To determine excess capital, we add free cash flow to cash on the balance sheet and netout dividends. We then employ a balance sheet optimization to capture the competitiveadvantage afforded to companies through the state of the balance sheet. Our analysiscarries out this optimization by comparing a firm’s leverage to that of its peers. Firms withlower leverage have more ability to deploy capital in the pursuit of supplemental valuecreation, while those with higher leverage have less ability to do so. To find the yield, wedivide the raw excess capital number by a company’s market capitalization. This yield isanalyzed on a sector-by-sector basis. Figure 1 illustrates this calculation process.Figure 1. Voya’s method of calculating ECYCashFree italMarketCapitalizationExcessCapitalYieldSource: Voya Investment ManagementECY generates better returns than other value metricsTo quantify the benefits of excess capital yield, we evaluated the factor performance ofECY on both a standalone basis (year-over-year and sector-by-sector) as well as relative toother valuation metrics. We evaluated the full Russell 1000 Value universe (ex-real estateinvestment trusts (REITS) and utilities) from 2013–2021. REITS and utilities were excludedsince neither sector aspires to generate cash, thus making the ECY metric less applicable.1To gauge the impact of ECY, we calculated the quintile spread returns of various valuationmetrics (Figure 2). Our analysis showed that excess capital yield was the strongestperforming factor, followed by free cash flow yield and dividend yield.Figure 2. Cumulative, cap-weighted quintile spread returns, R1000V ex-REITsand utilities2.52.01.51.00.520132013201420152016Excess Capital YieldBook YieldFree Cash Flow YieldDividend Yield20172018201920202021Earnings YieldSource: FactSet, analysis by Voya Investment Management, data from 01/31/2013 through 12/31/2021. Past performance isno guarantee of future results.Next, we lengthened the history, excluding financials in addition to REITs and utilities, andevaluated the same factors. Financials were excluded due to lack of data for the sectorprior to 2013. Again, excess capital yield emerged as the strongest factor (Figure 3).1Our REITs and utilities analysts recognize this and therefore ECY is not a driving factor in their decision-making.
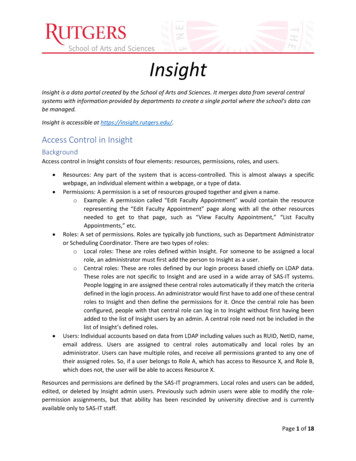
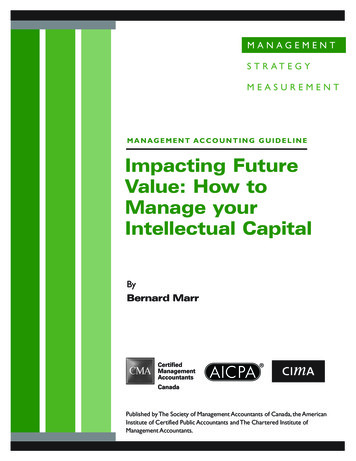
Market Insight 2022Excess Capital Yield: A Better Framework for Value InvestingFigure 3. Cumulative, cap-weighted quintile spread returns, R1000V ex-financials, REITsand 012Excess Capital YieldBook YieldFree Cash Flow YieldDividend Yield201420152016201820192021Earnings YieldSource: FactSet, analysis by Voya Investment Management, data from 01/31/2007 through 12/31/2021. Past performance isno guarantee of future results.ECY offers better risk efficiency than other value metricsExcess capital yield also generated these superior historical returns with lower volatilityresulting in the strongest Sharpe ratio compared to these other value metrics (Figure 4).Figure 4. R1000V ex- financials, REITs and utilities — cap-weighted performanceExcess capitalyieldBookyieldEarningsyieldFree cash flowyieldDividendyieldAnnualized return6.98(2.16)(0.51)4.350.95Annualized volatility210.3714.8712.0611.1013.55Return/Std Dev0.67(0.15)(0.04)0.390.07Source: FactSet, analysis by Voya Investment Management, data from 01/31/2007 through 12/31/2021. Past performance isno guarantee of future results.Behind the metric: quality and the avoidance of value trapsAt the root of a framework such as excess capital yield, there is a fundamental explanationas to why companies that exhibit an ability to generate excess capital offer fertile groundupon which our analysts can focus their efforts. It is the presence of excess capital thathelps to skew the risk-reward opportunity in a stock, thus amplifying the upside of beingright about the company and mitigating the downside if the thesis proves to be wrong.Said differently, it adds a quality element to the strategy and helps avoid value traps,i.e., companies that appear attractive based on conventional valuation metrics, but thatpresent insurmountable, fundamental flaws.To illustrate this point, we measured the correlation of ECY with profitability, high leverage,growth, momentum and beta (Figure 5). ECY was most closely correlated with highprofitability, a strong quality metric; and showed a strong negative correlation to highleverage, an “anti-quality” metric.2Volatility annualized standard deviation of quintile spread returns.
Market Insight 2022Excess Capital Yield: A Better Framework for Value InvestingFigure 5. Correlation of ECY and other valuation metrics with Axioma style factors15-year aExcess Capital Yield0.35(0.59)0.060.04(0.01)Book Yield(0.18)(0.19)(0.06)(0.20)0.22Earnings (0.12)(0.05)Earnings Yield NTM0.210.020.16(0.12)0.01Free Cash Flow Yield0.32(0.06)0.000.00(0.02)Dividend Yield*0.040.18(0.29)(0.05)(0.24)Source: Correlation analysis by Voya Investment Management, based on factors provided by Axioma Inc. Data range:12/29/2006 To 12/31/2021. Past performance is no guarantee of future results.ECY demonstrates robust, persistent resultsAs with any back-test, one needs to examine the methodology used, the breadth anddepth of the analysis and whether the results are robust and show some persistenceacross multiple market regimes. At Voya, our quantitative research team employs a highlydisciplined and rigorous approach in identifying potential alpha drivers, but also in testingtheir validity across a myriad of scenarios. In addition to the results above, we examinedthe performance of each metric on year-by-year and sector-by-sector bases to evaluatethe breadth and depth of ECY with similar results (see Appendix).While these results are encouraging, the framework of excess capital yield was not builtjust upon a strong back-test. Rather, it is a truly “quantamental” metric, initially created toprovide a holistic, forward-looking view of the capital that management has at its disposalto create value.Key benefits of ECYThe benefit of focusing on excesscapital yield comes not from themetric itself, but from the analysis andconversation it sparks.The success of ECY is linked to two key benefits:1.Alpha: as demonstrated in this primer, ECY historically has exhibited stronger andmore consistent factor performance than traditional measures of valuation2.Framework: the components of ECY provide analysts with insights into what levers acompany has at its disposal to generate future earningsThe second feature is vital, and while this qualitative element is hard to capturenumerically, we would be remiss if we failed to note that ECY is much more than a screenthat can be used by rigid, quantitatively focused strategies. The true value-add comesfrom the experience of our fundamental analysts, who have the skill and knowledgeneeded to decompose the number and interpret its meaning in the context of theirrespective sectors.In our view, a proper value-oriented strategy should be both dynamic, i.e., capable ofaccounting for differences across businesses and market regimes; as well as flexible, i.e.,complementary to the individual approach utilized by fundamental analysts. The successof the Voya Large Cap Value strategy is a direct result of this philosophy, and is linked toboth excess capital yield and the manner in which we are able to practically apply ECYand triangulate it against both other relative value measures and qualitative, differentiatedinsights from our experienced team of sector analysts.
Market Insight 2022Excess Capital Yield: A Better Framework for Value InvestingAppendix: calendar year returnsFigure 6. Cap-weighted performance, R1000V ex-REITs and utilitiesJan 2007–Dec 2021YearExcess capitalyieldBookyieldEarningsyieldFree cash 4)(6.38)2021*17.070.864.4514.582.99Source: FactSet, analysis by Voya Investment Management* 2021 through November only, rebalanced monthly. Past performance is no guarantee of future results.Figure 7. Cap-weighted performance, R1000V ex-financials, REITs and utilitiesJan 2007–Dec 2021YearExcess capitalyieldBookyieldEarningsyieldFree cash 72)2021*18.802.2015.2819.7212.61Source: FactSet, analysis by Voya Investment Management* 2021 through November only, rebalanced monthly. Past performance is no guarantee of future results.
Market Insight 2022Excess Capital Yield: A Better Framework for Value InvestingFigure 8. R1000V cap-weighted, quintile spread return by sectorJan 2007–Dec 2021Excess capitalyieldBookyieldEarningsyieldFree cash flowyieldDividendyieldCommunication Services2.063.61(14.95)(21.16)(1.02)Consumer Discretionary3.25(3.44)(3.34)(4.12)(5.45)Consumer .3110.32Financials2.91(0.56)(1.15)3.690.91Health .550.42Information .86)0.39SectorSource: FactSet, analysis Voya Investment Management, analysis period Jan 2007 – Dec 2021, rebalanced monthly.Past performance is no guarantee of future results.DisclaimerPast performance does not guarantee future results.The principal risks are generally those attributable to investing in stocks and related derivative instruments. Holdings are subject to market, issuer and other risks, and their values mayfluctuate. Market risk is the risk that securities or other instruments may decline in value due to factors affecting the securities markets or particular industries. Issuer risk is the risk that thevalue of a security or instrument may decline for reasons specific to the issuer, such as changes in its financial condition.The Voya Large Cap Value strategy employs a quantitative model to execute the strategy. Data imprecision, software or other technology malfunctions, programming inaccuracies and similarcircumstances may impair the performance of these systems, which may negatively affect performance. Furthermore, there can be no assurance that the quantitative models used in managingthe strategy will perform as anticipated or enable the strategy to achieve its objective.This information is proprietary and cannot be reproduced or distributed. Certain information may be received from sources Voya Investment Management (“Voya IM”) considers reliable; Voya IMdoes not represent that such information is accurate or complete. Certain statements contained herein may constitute “projections,” “forecasts” and other “forward-looking statements” whichdo not reflect actual results and are based primarily upon applying retroactively a hypothetical set of assumptions to certain historical financial data.Actual results, performance or events may differ materially from those in such statements. Any opinions, projections, forecasts and forward-looking statements presented herein are valid onlyas of the date of this document and are subject to change. Voya IM assumes no obligation to update any forward-looking information.Voya Investment Management has prepared this commentary for informational purposes. Nothing contained herein should be construed as (i) an offer to sell or solicitation of an offer to buy anysecurity or (ii) a recommendation as to the advisability of investing in, purchasing or selling any security. Any opinions expressed herein reflect our judgment and are subject to change. Certainof the statements contained herein are statements of future expectations and other forward-looking statements that are based on management’s current views and assumptions, and involveknown and unknown risks and uncertainties that could cause actual results, performance or events to differ materially from those expressed or implied in such statements. Actual results,performance or events may differ materially from those in such statements due to, without limitation, (1) general economic conditions, (2) performance of financial markets, (3) interest-ratelevels, (4) increasing levels of loan defaults, (5) changes in laws and regulations, and (6) changes in the policies of governments and/or regulatory authorities.The Russell 1000 Value index measures the performance of those Russell 1000 index companies with lower price-to-book ratios and lower forecast growth values. Indexes do not reflectfees, brokerage commissions, taxes or other expenses of investing. Investors cannot invest directly in an index. 2022 Voya Investments Distributor, LLC 230 Park Ave, New York, NY 10169 All rights reserved.CMMC-ECYLCVALUE 123121 ex123123 IM1898308For qualified institutional investor use only. Not for inspection by, distribution or quotation to, the general public.voyainvestments.com
Decomposition of ECY by skilled analysts is a key component of alpha generation. Adapting value investing to market changes . FactSet, analysis by Voya Investment Management, data from 01/31/2013 through 12/31/2021. . disciplined and rigorous approach in identifying potential alpha drivers, but also in testing their validity across a myriad .