Transcription
Ginnie Mae’s IssuerRisk Analytics andRisk ManagementProcesses
GINNIE MAE Session OverviewWhat we will cover today An overview of Ginnie Mae’s analytical approaches and risk managementprocesses Case study – a tale of two Issuers Deeper dive into two of Ginnie Mae’s analytical tools Preview of coming counterparty policy development1
GINNIE MAE New ParadigmParadigm ShiftOver the past 10 years, Ginnie Mae has developed a series of risk tools andcapabilities to evaluate and manage counterparty and portfolio risk.Furthermore, Ginnie Mae continues to evolve its risk framework to addressrisks that arise outside of the compliance with Ginnie Mae’s financial andoperational requirements. Ginnie Mae is committed to being moretransparent about our risk framework and the tools we utilize to assessIssuer risk. Some basic tenets of our risk philosophy include: The size of our portfolio and the variety of Issuer profiles leads us toadopt a risk management framework unique to the companies in ourprogram; We attempt to avoid a one size fits all approach which can createunintended limitations on program participation and can causeunnecessary restrictions on all Issuers; and We prefer targeted efforts of working with Issuers to improve their riskprofile.2
GINNIE MAE All Issuers Subject to OversightIssuer Assessment Tools and Techniques – All IssuersPerformance Focused Issuer Risk Grades (“IRG”) and Potential Future Exposure (“PFE”) – to bediscussed later Issuer Operational Performance Profile (“IOPP”) – Self serve “scorecard”available to Issuers to compare performance against peers as well asestablished benchmarks over a range of operational performance metrics.Compliance Focused Threshold monitoring – insurance matching, Net Worth and Liquidity(quarterly and audited), delinquencies Fidelity and Errors and Omissions Insurance requirements Compliance Reviews – On-site review of compliance with Ginnie MaeGuide3
GINNIE MAE Targeted OversightIssuer Assessment Tools and Techniques – Elevated FocusSize or Complexity Driven Targeted on-site reviews Monthly or quarterly Spotlight Issuer calls Issuer Liquidity MeetingsPerformance Driven Issuer Watchlist Enhanced monitoring plans Commitment authority reviews (quasi Issuer Risk Committee) Notice of Violations and resolution Imposition of unilateral requirements (MBS Guide 3-8) Special situation management (Pre default)4
GINNIE MAE Issuer WatchlistIssuer WatchlistSimilar to other takers of counterparty or credit risk, Ginnie Mae maintains awatchlist that highlights where additional oversight of an Issuer is warranted.How does an Issuer get on the watchlist? Rated in the lower range of Issuer Risk Grades; Breaches of compliance thresholds or high levels of findings on most recentCompliance Review; Discretionary inclusion (e.g. regulatory action, outsized PFE)Watchlist Management Overview Ginnie Mae actively works with watchlist Issuers to resolve identifiedchallenges; Factored into decisions surrounding levels of Commitment Authority,Transfers of Issuer Responsibility and Acknowledgement Agreements; Issuers cannot remain on the Watchlist in their current state for an indefiniteperiod.Measured progress against prescribed target goals must beachieved.5
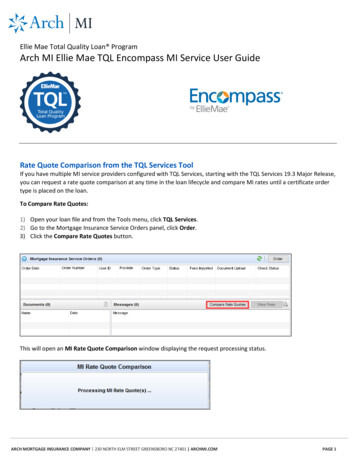
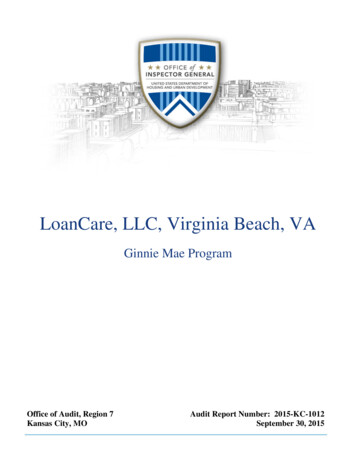
GINNIE MAE Case StudyTwo Similar Issuer Profiles?Issuer 1Issuer 2 1,000,000,000 1,000,000,000Required Net Worth1 6,000,000 6,000,000Required Liquidity2 1,000,000 1,000,000UPB Should Ginnie Mae focus on compliance with net worthand liquidity as a means to manage Issuer default risk? Should these compliance metrics drive commitmentauthority and TIR decisions?1( 2.5MM 35bps210bpsof UPBof UPB)6
GINNIE MAE Case StudyHow about now? Do they look the same?Issuer 1Issuer 2Cash 2,000,000 3,000,000MSRs 11,000,000 10,000,000Loans Held for Sale 10,000,000 10,000,000 23,000,000 23,000,000Warehouse Payable 9,500,000 8,500,0001MSR Financing (65% Adv. Rate) 7,150,0000 16,650,000 8,500,000 6,350,000 14,500,000Yes (105.8%)Yes (241.7%)Yes (200%)Yes (300%)B/SAssetsLiabilitiesEquityIn compliance with Net Worth?In compliance with liquidity?1 1mmin excess investment in WH that can be turned into cash assuming 95% advance rate7
GINNIE MAE Case StudyHow about now? Do they look the same?Issuer 1Issuer 2 1,000,000,000 1,000,000,00027.5 bps / 4x33.3 bps / 3x5806854.75% ( 47.5mm)2.25% ( 22.5mm)Secured Debt / Total Assets (w/WH)72.4%37%Secured Debt / Total Assets (wo/WH)55% (B equivalent)0% (Aa/A equivalent)MSR to Equity173.2%70%Cash to DQ90 UPB4.21%13.33%Monthly sFee to DQ 90 P&I196.5%246.7%Portfolio CharacteristicsUPBWASF / MSR MultipleWA FICODQ90 Selected Financial Ratios1Forillustration, monthly P&I is sized at 50bps of outstanding UPB8
GINNIE MAE Highlighted Risk AnalyticsWe don’t think the risk is the sameWe have provided an overview of some of the numeroustechniques, tools and processes in both the Office of Issuer andPortfolio Management (“OIPM”) and the Office of Enterprise Risk(“OER”) that are leveraged to better analyze our Issuer’s risk profile.In the spirit of increased transparency to our Issuers, today we willdive a little deeper into two of these tools: Issuer Risk Grade Model (“IRG”) / Rating Framework Potential Future Exposure (“PFE”)9
GINNIE MAE Risk Grade BackgroundIssuer Risk Grade Modeling / Rating Framework RationaleWhy do we rate our Issuers? To identify those Issuers that may require additional oversightand enhanced monitoring; To improve workflow for credit sensitive decisions coming fromGinnie Mae (e.g. Commitment Authority, TIR,Acknowledgement Agreements); To provide input for modeling of Ginnie Mae’s required capitaland liquidity to manage potential Issuer defaults; and To inform potential financial eligibility requirement changes tothe Ginnie Mae MBS Guide.10
GINNIE MAE Risk Grade ProtocolIssuer Risk Grade Framework MechanicsHow do we rate our Issuers?Step 1:Determine if the institution is publicly rated or non-publicly rated.For publicly rated Institutions, the Aggregate Rating is calculated by selecting the lesser of the Institution’sMoody’s, S&P and Fitch LT Issuer rating (ignoring /-).Step 2:The Aggregate Rating flows down to become the Standalone Risk Grade. Non-publicly Ratedinstitutions receive a synthetic Standalone Risk Grade. Mortgage Banks and Housing Finance Authorities – Ginnie Mae calculates a CAEL based rating from aninternal model which assesses four factors: Capital Adequacy, Asset Quality, Earnings, and Liquidity Commercial Banks - Score derived from Moody’s RiskCalc and CreditEdge synthetic rating data.Step 3:Consider the Parental Support Risk Grade by taking Stand Alone Risk Grade of the ImmediateParent and assigning it a value of one notch below. For example, if an immediate parent of an Issuer is rated A ,the Parental Support Risk Grade would be BBB.Step 4:The greater of the Parental Support or Standalone Risk Grade is selected to obtain the FinalAssigned Risk Grade.Step 5:Optionally, the Final Assigned Risk Grade may be overridden (up or down) based on credit reviewrecommendations from Ginnie Mae’s Counterparty Risk Analysis Division.11
GINNIE MAE Risk Grade EquivalentsIssuer Risk Grade Ratings and EquivalentsRating aCC/Ca/CGinnie MaeEquivalent Rating212345678Watchlist1 /- are not consideredRisk Grade 8 has been calibrated to previous Issuer defaults under the Ginnie Mae program212
GINNIE MAE Risk Grade ComponentsIssuer Risk Grade Model ComponentsWhat does the CAEL based model evaluate for mortgage banks? Capital Adequacy, some sample metrics include: Leverage ratio MSR / Tangible Net Worth Asset Quality, some sample metrics include: MSR / Total Assets At Risk Assets (non MSR assets that have inherent interest rate or credit risk)/ Total Assets Earnings, some sample metrics include: Free cashflow / DQ Fixed Installment Control (“FIC”) Pre-tax Operating Margin Liquidity, some sample metrics include: Liquid assets / DQ FIC Liquid assets / Total liabilities Secured debt / Total assets13
GINNIE MAE PFE BackgroundPotential Future Exposure (“PFE”) RationaleWhy do we measure PFE? To size the potential exposure to Ginnie Mae should an Issuerdefault; To measure relative risk taking by the Issuer against their financialcondition; To provide input for modeling of Ginnie Mae’s required capital andliquidity to manage potential macro Issuer defaults; and To inform potential financial eligibility requirements (10bps ofliquidity), pooling requirements (25bps minimum sFee) and riskfactors (portfolio concentrations) changes to our Guide.14
GINNIE MAE PFE MethodologyPotential Future Exposure (“PFE”) ExplainedWhat is PFE? Ginnie Mae leverages a stochastic, Monte Carlo simulation modelto forecast monthly cash in-flows and out-flows for each Issuer’sportfolio over 10,000 potential paths for each loan; The net cashflow over the life of the portfolio is calculated underexpected and stressed environments; PFE is not a fair value / MSR concept!15
GINNIE MAE PFE Inputs and OutputsPotential Future Exposure (“PFE”) ComponentsWhat risk factors are included in the calculation of PFE? Issuer specific collateral data (e.g. UPB, FICO, Note rate, etc); Probability of borrower default; Probability of voluntary prepayment; Competing hazard / cure rate / amortization methodologies; Expense and recoveries; Issuer buyout behavior; and Net cashflow – Monthly / Annual / Life of portfolio ( / Bps for comparabilitywith peers)16
GINNIE MAE Future of Counterparty Risk ManagementFuture Analytics, Coverage Model and Policy InitiativesAnalytics In the Pipeline Issuer Stress Testing – Ginnie Mae Performed The stress testing framework (alpha version) forecasts an Issuer’s financialperformance over the next eight quarters under a base and an adversescenario and provides the following outputs: Balance Sheet, Income Statement and Cashflow Statement over the evaluation period;Projected Issuer Risk Grade (Ginnie Mae’s proprietary risk rating method) over the evaluationperiod;Projected Issuer compliance with Ginnie Mae and Government Sponsored Enterprise (“GSEs”)net worth, liquidity and capitalization requirements over the evaluation period;Projected compliance with a series of common warehouse covenants; andProjected risk of insolvency. Planned Request For Information (beta version) to provide transparency andseek industry feedback Future evolution may include Issuer prepared stress tests based on GinnieMae provided parameters17
GINNIE MAE Future of Counterparty Risk ManagementFuture Analytics, Coverage Model and Policy InitiativesExpansion of Counterparty Coverage Model – Ginnie Mae willincreasingly focus on a broader set of non-Issuer counterparties thatparticipate in the Ginnie Mae eco-system: Sub-servicers (highly concentrated) Custodians (in addition to operational oversight today) Sponsors / Trustees Secured Parties under AAs (ability to cure) Warehouse, Corporate or Asset Backed Debt lenders (e.g.customer concentrations, regulatory limits, etc.) Capital Partners (e.g. PEGS, Hedge Funds, REITS, KPs) investedin either Ginnie Mae Issuers or servicing strips18
GINNIE MAE Future of Counterparty Risk ManagementFuture Analytics, Coverage Model and Policy InitiativesPolicy InitiativesShort Term All Participants Memo (“APM”) planned for July 2019. Highlightsinclude: Ratings requirements for largest Issuers;Changes to eligible assets;Introduction of a secured debt test;Changes to eligible assets for compliance with liquidity requirements; andGreater guidance on approval factors for TIRLong Term Exposure limits Living wills / resolution planning Stress tests19
UPB Required Net Worth1 Required Liquidity2 6 Two Similar Issuer Profiles? Issuer 1 1,000,000,000 6,000,000 1,000,000 Issuer 2 1,000,000,000 6,000,000