Transcription
Section 1 - Program ProductivityPurpose: To provide program “productivity” trend data in terms of headcount, enrollment andgraduate data.Data: The data is provided using duplicated across terms and unduplicated formats. Duplicateddata counts a student every term s/he is enrolled in the program. Unduplicated data counts thestudent only in the first term s/he is enrolled in the program.Headcount enrollment (HC). For each term, headcount is the number of students enrolledin the program. Table 1 uses the duplicated format and each student enrolled in theprogram in the term is counted. Table 2 uses the unduplicated format and students areonly counted in the first term they are enrolled in the program.Full Time Equivalent (FTE). 1 FTE student equates to 12 credit hours. The total credithours taken by students enrolled in the program in the indicated term is divided by 12 toproduce the FTE hours in the table.Graduates. Program graduates are based on an unduplicated format and only counted inthe term that they graduated in the program.Use: Trend enrollment (Headcount, FTE, and graduate data) provides a basis for assessing theproductivity and sustainability of the academic program and answer and raise such questions as:Are a sufficient number of students actively enrolling in the program to justify itscontinuation?Is Headcount enrollment (HC) evidencing an increase/decrease over time; is/was this anexpected trend; is this something that needs to be addressed through planning/furtherresearch?Is the program producing sufficient graduates to meet job market requirements?FTE is an indicator of the number of credit hours students are taking. Are students in theprogram generating sufficient FTE? Is there an increasing/decreasing trend?Table 1 exhibits the program’s Headcount, FTE and Graduates by term, providing a by termsnapshot of the program’s overall productivity. Headcount and FTE are based on the duplicatedformat and Graduates are based on the unduplicated format. This tableTable 2 exhibits unduplicated Headcount and FTE data for students enrolled in the program forthe first time, providing an indicator of program vitality based on the trend of the influx of newstudents into the program. Ideally the number of new students enrolling in the program will befairly consistent or consistently increasing over time. The FTE for the students starting theprogram in a given term provides an indicator of the potential time frame for that cohort ofstudents to complete the program. Students starting out with less than a full academic load takeusually take longer to graduate.
TABLE 1- HC and FTE by Term for MarketingDuplicated Across TermsYear2007200820092010FALLEnrolled FTE GRADS163 148.512174 150.25150 126.73145 116.7 .SEMESTERSPRINGSUMMEREnrolled FTE GRADS Enrolled FTE GRADS165 143.21887 52.66154 129.11672 46.7141581271788 49.17160 130.1 .79 46.2 .SOURCE: CERS Official Files
TABLE 2 - HC and FTE by Start Term 4SUMMERFTEEnrolled FTE45.820 13.843.218 13.738.721 13.540.212 7.3Source: CERS Official FilesNote: Start term is 1st time student was in the program
Section 2 Enrollment by Courses TypePURPOSE: To provide information on the type of course mix that program students enroll in.DATA: Duplicated data counts a student every term s/he is enrolled in the program.Unduplicated data counts the student only in the first term s/he is enrolled in the program.The Course Types are defined as follows:Major Courses- The total number of students enrolled in the program that term enrolledin at least 1 major course and not enrolled in any DVS Courses. Major Courses aredefined as those core discipline courses that are actually controlled by the programMajor & DVS Courses - The total number of students enrolled in the program that termenrolled in at least 1 major course and at least 1 DVS course.Total Non-Major Courses Only- The total number of students enrolled in theprogram that term not enrolled in any major courses. Non-Major courses are definedas courses that are not controlled by the program.Curricula Only- The total number of students enrolled in the program that term enrolledonly in Non-major courses and no DVS courses. Curricula courses are defined as nondvs academic courses that are not owned by the program.Curricula and DVS Courses- The total number of students enrolled in the program thatterm enrolled in at least 1 Non-major and at least 1 DVS course.DVS Only Courses- The total number of students enrolled in the program that termenrolled only in DVS courses. DVS courses are defined as English, Math, and Readingcourses numbered 0 or 100.USE: Table3 (duplicated) provides overall information about the courses program students aretaking. The sequence of program course offerings is a large determinant of when and whatcourses students take. The question to ask is “Does the course mix match what I expected?” (i.e.,Is the percentage of students enrolled and not taking any major courses higher or lower than yourexpectation?)Table 4 (unduplicated) provides information on the initial readiness of the students enrolled inthe program for the first time. A consistent high number of students enrolled in DVS coursesimplies a potentially longer time for the student to graduate, a higher potential for attrition, and ahigher need for support, from both the program and other college offices
TABLE 3- Enrollment of Marketing Students By Type Courses By TermDuplicated Across TermsEnrolledEnrolled EnrolledTotalCurricula Enrolled EnrolledMajor MajorNon-Major CoursesDVSCurriculaTotal HC Courses & DVSOnlyOnlyOnly& DVSFall 2007-081637548464911Spring 2008-09319148161551251614Summer 2008-091596529277411Fall 2008-0917466159367917Fall 2009-101506777656812Spring 2009-10158648867655Summer 2009-1088322544554Fall 2010-1114558681571113Spring 2010-111606339476513Summer 2010-1179242534913Category Definitions:MAJOR COURSES- Enrolled in at least 1 major course & no DVS CoursesMAJOR & DVS - Enrolled in at least 1 major crse and 1 DVS courseTotal NON-MAJOR Only: Enrolled only in Non-major and/or DVS coursesCURRICULA ONLY-Enrolled only in Non-major courses and no DVS coursesCURRICULA & DVS - Enrolled in at least 1 Non-major and 1 DVS courseDVS ONLY- Enrolled only in DVS coursesSource:CERS Official Opening Extracts
TABLE 4- Enrollment of Marketing StudentsBy Type Course By Start TermEnrolledEnrolled EnrolledTotalCurricula Enrolled EnrolledMajor MajorNon-Major CoursesDVSCurriculaTotal HC Course & DVSOnlyOnlyOnly& DVSFall 2007-0865274342176Spring 2008-09994710423273Summer 2008-093818.201424Fall 2008-09682174024511Fall 2009-1057176342077Spring 2009-1048172292144Summer 2009-10216213832Fall 2010-11552033213712Spring 2010-1144162261727Summer 2010-11123.98.1Category Definitions:MAJOR COURSES- Enrolled in at least 1 Major course & no DVS CoursesMAJOR & DVS - Enrolled in at least 1 Major and 1 DVS courseTotal NON-MAJOR Only: Enrolled only in Non-major and/or DVS coursesCURRICULA ONLY-Enrolled only in Non-major courses and no DVS coursesCURRICULA & DVS - Enrolled in at least 1 Non-major and 1 DVS courseDVS ONLY- Enrolled only in DVS coursesSource:CERS Official Opening Extracts
Section 3 Program Course Section SizePURPOSE: To provide information on the use of faculty and classroom resources basedon the section size of courses offered in the referenced terms.DATA: Major courses are defined as those courses that are discipline specific and“owned” by the program. In most cases the 3 character prefix for the course is identifiedwith the Associate Degree program; for example the ACCounting program “owns” thecourses beginning with the ACC prefix; therefore table 5 for the Accounting programwould only include the ACC courses. In those programs where the prefixes are shared bymultiple programs, the specific courses are assigned to the correct major. The ComputerTechnology and Telecommunications Management programs both own CPT and ISTprefix courses. Only the courses than each program owns is considered a MAJOR course.USE: The data provides a mechanism for reviewing course offerings and identifyingpotentials for improving the use of resources based on section sizes. If there is a trend ofmultiple sections of the same course with small enrollments being offered in the sameterm, it may indicate a needed analysis to determine the reasons.Table 5-A provides a display of the “Average” section size for each course by term. Thestandard is 12-20 students per section. This table provides a quick reference to evaluateyour overall section loads.Table 5-B provides a display of the exact section size. This table will quickly indicate ifthere is a trend in offering sections with smaller numbers and please note, there aresituations where it is necessary to conduct sections with smaller than standard sizes.Sometimes the course may be a clinical or worksite course and thus the smaller numbersare justified.
TABLE 5-A - Average Section Size for MKT rce: CERS Official Opening FilesNote: Red numbers indicate average section size below standard.
Table 5-B Number of Sections by Section Size for MKT SectionsCourse /Section Size20072008200920102011FALL SPR SUM FALL SPR SUM FALL SPR FALL SPR SUM FALLMKT101 ontinued)Source: CERS Official Opening FilesNote: Number in Section Size Column is the size of the section. Numbers in the term column indicate how mant section of that size were taught that term
Table 5-B Number of Sections by Section Size for MKT SectionsCourse /Section Size20072008200920102011FALL SPR SUM FALL SPR SUM FALL SPR FALL SPR SUM FALLMKT101 .31.1.321.MKT110 .17.1.20.1.11.24.1.(Continued)Source: CERS Official Opening FilesNote: Number in Section Size Column is the size of the section. Numbers in the term column indicate how mant section of that size were taught that term
Table 5-B Number of Sections by Section Size for MKT SectionsCourse /Section Size20072008200920102011FALL SPR SUM FALL SPR SUM FALL SPR FALL SPR SUM FALLMKT120 1.19.1.121.1.23.1.27.1.1.29.1.MKT240 23.1.(Continued)Source: CERS Official Opening FilesNote: Number in Section Size Column is the size of the section. Numbers in the term column indicate how mant section of that size were taught that term
Table 5-B Number of Sections by Section Size for MKT SectionsCourse /Section Size20072008200920102011FALL SPR SUM FALL SPR SUM FALL SPR FALL SPR SUM FALLMKT260 T270 .27.1.30.1.Source: CERS Official Opening FilesNote: Number in Section Size Column is the size of the section. Numbers in the term column indicate how mant section of that size were taught that term
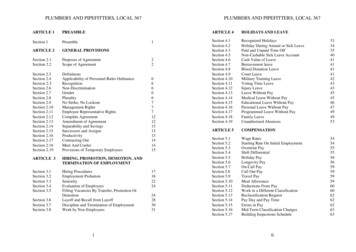
Section 4 Post Graduate OpportunitiesPURPOSE: To provide information on post graduate success in terms of employment and continuededucation and employment projections.DATA:The Graduate follow-up survey (GFUS) provides data on program graduates and post graduateemployment The state requires that 50% of all graduates be employed in a job related to theirdegree or be enrolled in college full-time in the fall term following graduation. The MTC standard is90%. This percentage is based on the number of the program graduates who respond favorably tothe survey divided by the total number of program graduates.Employment Projections: The employment projection and salary data is derived from multiplesources- EMSI and state and federal agencies. The college contracts EMSI, an econometricmodeling company, for the development of industry and occupational projections within the MTCservice area. The data is reliable but all forecast models are based on past events and anticipatedfuture events; unforeseen events can negate the validity of projections. EMSI uses over 90 regional,state and federal data sources and updates their projections whenever new data is available, at leasttwice a year.USE: Table 6A provides information from the GFUS to answer the questions:(1) Are a sufficient percent of the graduates of the program securing employment in their field? Ifnot, why not? (Jobs in this field being eliminated; recession; graduates need different skill sets thanwhat they are getting; .)(2) If a large percent of the program graduates are continuing their education, is it an expected eventor do the graduates need additional skill sets to gain employment?Employment Projections: The employment projections provide “a” picture of future employmentand salary and projected salary information. This data answers questions about the programs futureviability. Is the job market for graduates of this program increasing, decreasing or static? Is thesalary ( projected salary) for program graduates sufficient to encourage students to spend theresources to get a degree/diploma in this program?
Table 6APlacement Rate Information for MKT GraduatesNumber and Percentage of GraduatesEmployed or Continuing EducationUnduplicated CountAvailableforEmployment and 236%YearSource: MTC Job Placement ReportEmployed inRelated FieldContinuingEducationEmployed orCont. Educ.
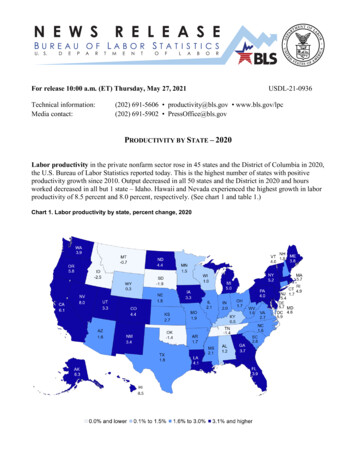
Employment Projections SummaryRegion InfoRegion: MTC service areaDescription: official service areaCounty Areas: Fairfield, South Carolina (45039), Lexington, South Carolina (45063), Richland, South Carolina(45079)Selected OccupationsOccupationMarketing managers (SOC 11-2021)Market research analysts (SOC 19-3021)First-line supervisors/managers of non-retail sales workers(SOC 41-1012)Advertising sales agents (SOC 41-3011)Education LevelDegree plus work experienceBachelor's degreeWork experience in a related fieldModerate-term on-the-job trainingExecutive SummaryBasic Information2011 Occupational Jobs2021 Occupational JobsTotal ChangeTotal % ChangeOpenings2011 Median Hourly Earnings3,5344,03149714.09%1,255 21.97Economic Indicators2011 Location Quotient2021 Location Quotient0.840.84Source: EMSI Complete Employment - 2011.4Occupational Change Summary
RegionRegional TotalState TotalNational 73,63814%19%1,2557,8442011MedianHourlyEarnings 21.97 20.36304,27817%690,967 26.242021ChangeJobs4,03122,9692,043,843Source: EMSI Complete Employment - 2011.4Occupational BreakdownSOCDescriptionCode11-2021 Marketing managers19-3021 Market research analystsFirst-line supervisors/managers of41-1012non-retail sales workers41-3011 Advertising sales agentsTotal2011Jobs4493262021 OpeningJobss4941423991602011 Median HourlyEarnings 32.78 21.452,3412,680824 20.54418459128 18.843,5344,0311,255 21.97Source: EMSI Complete Employment - 2011.4
Occupation DistributionCountyRichland, SC (45079)Lexington, SC (45063)Fairfield, SC (45039)2011 Jobs2,0541,371110Source: EMSI Complete Employment - 2011.4Data Sources and CalculationsOccupation DataOrganizing regional employment information by occupation provides a workforce-oriented view of the regionaleconomy. EMSI's occupation data are based on EMSI's industry data and regional staffing patterns taken fromthe Occupational Employment Statistics program (U.S. Bureau of Labor Statistics). Wage information is partiallyderived from the American Community Survey. The occupation-to-program (SOC-to-CIP) crosswalk is based onone from the U.S. Department of Education, with customizations by EMSI.Location QuotientLocation quotient (LQ) is a way of quantifying how concentrated a particular industry, cluster, occupation, ordemographic group is in a region as compared to the nation. It can reveal what makes a particular region uniquein comparison to the national average.State Data SourcesThis report uses state data from the following agencies: South Carolina Employment Security Commission, LaborMarket Information Department.
Section 5 RetentionPurpose: To provide program retention data to help evaluate the program’s productivity, success andproblems with moving students to completion.Data: The data is cohort based. Both the Fall and Spring cohorts are determined by the first time astudent is enrolled in the program. Each cohort is tracked through the Fall 2008 semester. Eachcohort contains categories reflecting categorized by the type courses the students took in their 1stsemester in the program.Categories:Major Courses- The total number of students enrolled in the program that term enrolled in at least 1major course and not enrolled in any DVS Courses. Major Courses are defined as those core disciplinecourses that are actually controlled by the programMajor & DVS Courses - The total number of students enrolled in the program that term enrolled in at least1 major course and at least 1 DVS course.Total Non-Major Courses Only- The total number of students enrolled in the program that term notenrolled in any major courses. Non-Major courses are defined as courses that are not controlled by theprogram.Curricula Only- The total number of students enrolled in the program that term enrolled only in Nonmajor courses and no DVS courses. Curricula courses are defined as non-dvs academic courses that arenot owned by the program.Curricula and DVS Courses- The total number of students enrolled in the program that term enrolled in atleast 1 Non-major and at least 1 DVS course.DVS Only Courses- The total number of students enrolled in the program that term enrolled only in DVScourses. DVS courses are defined as English, Math, and Reading courses numbered 0 or 100.Retention events tracked are: (1)Enrolled (still in the major), (2)Graduated ( in the major), (3)Changed major , (4) Graduated ( in non-cohort major). The starting cohort is “adjusted “for anystudents who change majors or graduate in another major (Adjusted Cohort Starting CohortChange Major – Grad other major). The total retention ratio for each term is calculated asGraduated in major Enrolled in majorAdjusted CohortNotes: Each student is counted in only one category and one retention event per term. Studentschanging major (including grads) are removed from the cohort. However, if a student who wasremoved from the cohort re-enrolls and graduates from the cohort program, s/he is reentered into thecohort and counted as a graduate. Graduate counts are cumulative.Use: Trend analysis. Are the grad/retention rates consistent across time? Are there certaincategories of students who have lower grad/retention rates? Where are the largest decreasesin the retention rates?FTE is an indicator of the number of credit hours students are taking. Are students in theprogram generating sufficient FTE? Is there an increasing/decreasing trend?
Table 7- Retention Tracking for - MKTCohort 20071Start CohortFall 07 to Spring 08Fall 07 to Fall 08Fall 07 to Spring 09Fall 07 to Fall 09Fall 07 to Spring 10Fall 07 to Fall 10Fall 07 to Spring 11Fall 07 to Fall 11Major OnlyMaj & DVSCurriculmCurric & DVSDVS OnlyMajor OnlyMaj & DVSCurriculmCurric & DVSDVS OnlyMajor OnlyMaj & DVSCurriculmCurric & DVSDVS OnlyMajor OnlyMaj & DVSCurriculmCurric & DVSDVS OnlyMajor OnlyMaj & DVSCurriculmCurric & DVSDVS OnlyMajor OnlyMaj & DVSCurriculmCurric & DVSDVS OnlyMajor OnlyMaj & DVSCurriculmCurric & DVSDVS OnlyMajor OnlyMaj & DVSCurriculmCurric & DVSDVS 212142742167New Major21421214212153242732327323264174128242641Grad in New Adjusted Cohort Retain in Grad in Major % Retain GradMajorMajorin 0200015000
Table 7- Retention Tracking for - MKTCohort 20081Start CohortFall 08 to Spring 09Fall 08 to Fall 09Fall 08 to Spring 10Fall 08 to Fall 10Fall 08 to Spring 11Fall 08 to Fall 11Major OnlyMaj & DVSCurriculmCurric & DVSDVS OnlyMajor OnlyMaj & DVSCurriculmCurric & DVSDVS OnlyMajor OnlyMaj & DVSCurriculmCurric & DVSDVS OnlyMajor OnlyMaj & DVSCurriculmCurric & DVSDVS OnlyMajor OnlyMaj & DVSCurriculmCurric & DVSDVS OnlyMajor OnlyMaj & DVSCurriculmCurric & DVSDVS 15New Major211101123121331213512145141451Grad in New Adjusted Cohort Retain in Grad in Major % Retain GradMajorMajorin 060000400001706351500002023250600004000Table 7- Retention Tracking for - MKTCohort 20091Start CohortFall 09 to Spring 10Fall 09 to Fall 10Fall 09 to Spring 11Fall 09 to Fall 11Major OnlyMaj & DVSCurriculmCurric & DVSDVS OnlyMajor OnlyMaj & DVSCurriculmCurric & DVSDVS OnlyMajor OnlyMaj & DVSCurriculmCurric & DVSDVS OnlyMajor OnlyMaj & DVSCurriculmCurric & DVSDVS Only1762077176207717620771762077New Major00241213412164121641Grad in New Adjusted Cohort Retain in Grad in Major % Retain GradMajorMajorin 0500154133050001131115031033062033
FALL SPRING SUMMER. Enrolled FTE Enrolled FTE Enrolled FTE 2007 65 63.9 50 45.8 20 13.8 2008 68 60.2 49 43.2 18 13.7 2009 57 52.7 48 38.7 21 13.5 . Major Courses- The total number of students enrolled in the program that term enrolled in at least 1 major course and not enrolled in any DVS Courses.