Transcription
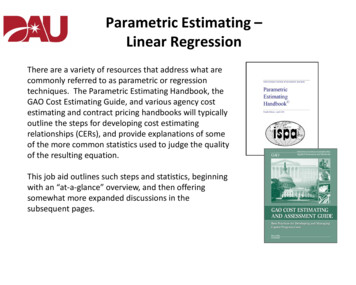
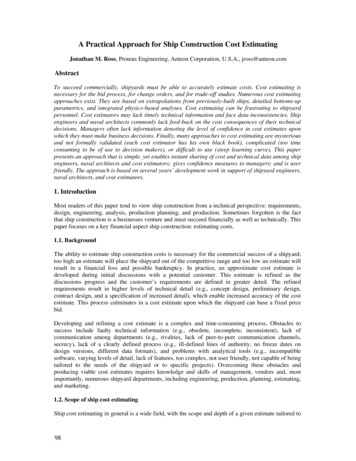
Education Estimating Conference onFlorida College System EnrollmentEXECUTIVE SUMMARYThe Education Estimating Conference on Florida College Enrollment met on August 7, 2013, to review actualFlorida College System full-time-equivalent (FTE) enrollment for FY 2012-13 (FTE-3). The actual FTEenrollment for FY 2012-13 was presented in comparison to the March 8, 2013, estimate as well as to the actualFTE for FY 2011-12.The March 8th estimate anticipated a Florida College System total FTE enrollment reduction of 5.2% (from totalenrollment of 372,050 in FY 2011-12 to 352,613 in FY 2012-13). The actual decline was 5.9% (from totalenrollment of 372,050 to an actual enrollment of 350,109 FTE in FY 2012-13) representing a loss of 21,941FTE from FY 2011-12.The actual FY 2012-13 Upper Division enrollment increased to 11,399 or 17.3% over FY 2011-12 FTE of9,722.For all Lower Division programs, FTE enrollment decreased by 23,620 FTE (or 6.5%), from 362,329 FTE inFY 2011-12 to 338,709 actual FTE in FY 2012-13. Upper Division FTE accounted for about 2.6% of totalenrollment in FY 2011-12, increasing to a total of 3.3% of total enrollment in FY 2012-13. Lower Divisionenrollment declines occurred in all program areas including Advanced and Professional, PostsecondaryVocational, College Preparatory, Educator Preparation Institutes, Postsecondary Adult Vocational,Apprenticeship, Adult Basic Education, Adult Secondary/GED Preparatory, and Vocational Preparatory.The Conference Principals adopted the FY 2012-13 actual enrollment numbers as presented by the Division ofFlorida Colleges without modification. In addition, the Division of Florida Colleges provided a preliminaryprojection of FTE enrollment for FY 2013-14.Florida College System FTE EnrollmentLower DivisionUpper DivisionTotalFY 2011-12Actual362,3299,722372,050FY 2012-13March 2013Estimate340,92411,689352,6131Changefrom FY2011-12Actual-5.9%20.2%-5.2%FY 2012-13Actual338,70911,399350,109Changefrom FY2011-12Actual-6.5%17.3%-5.9%
FLORIDA COLLEGE SYSTEMENROLLMENT ESTIMATING CONFERENCE SUMMARYFTE ENROLLMENT: FUNDED-30, LOWER AND UPPER DIVISION2011-12FTE3ACTUALC12012-13FTE2ACOLL ADJESTIMATESC2FTE3 2012TOFT2A 2013FTE3 2012TOFT2A 2013CHANGE% CHANGEC1 TO C2C1 TO C22012-13FTE3FTE3 2012TOFTE3 2013FTE3 2012TOFTE3 2013FT2A 2013TOFTE3 2013FT2A 2013TOFTE3 2013CHANGE% CHANGECHANGE% CHANGEC1 TO C3C1 TO C3C2 TO C3C2 TO 08.6-21,941.8-5.9%-2,504-0.7%A
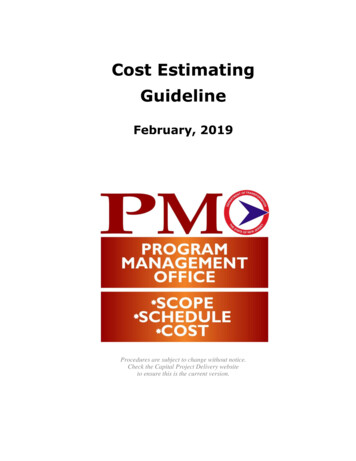
FLORIDA COLLEGE SYSTEMFTE ENROLLMENT: FUNDED, LOWER AND UPPER DIVISION2012-13 0.062.711399.2CCTCMIS: FTECOL, CO3F29C - 08/01/2013SOURCE: 7321.48691.51318.38113.921618.2222787.61:31 073.5350108.6
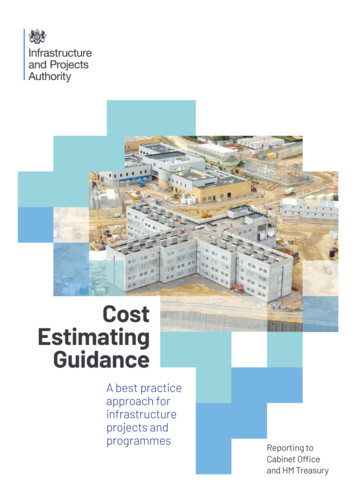
FLORIDA COLLEGE SYSTEMFTE ENROLLMENT PROJECTIONS: FUNDED, LOWER AND UPPER LEVELDIVISION PROJECTIONS WITH COLLEGE ADJUSTMENTS2013-14UPPERDIVISIONEASTERN FLORIDABROWARDCENTRAL FLORIDACHIPOLADAYTONAEDISONFLA SC AT JAXFLORIDA KEYSGULF COASTHILLSBOROUGHINDIAN RIVERFLORIDA GATEWAYLAKE SUMTERSTATE COLLEGE FLMIAMI DADENORTH FLORIDANORTHWEST FLAPALM BEACH STATEPASCO-HERNANDOPENSACOLAPOLKST. JOHNS RIVERST. PETERSBURGSANTA FESEMINOLE STATESOUTH 040.00.070.012329.0CCTCMIS: FTEPRJ, PRJCCF29 - 07/30/2013SOURCE: PJC30C2014C2:32 7.011980.014825.02006.010284.030293.0352957.0
THE FLORIDA COLLEGE SYSTEMENROLLMENT ESTIMATING CONFERENCEAUGUST 7, 2013 MEETING PACKETFlorida Department of EducationPage 1 of 35
FLORIDA COLLEGE SYSTEMFTE ENROLLMENT: FUNDED-30, LOWER AND UPPER DIVISIONDIVISION ESTIMATES WITH COLLEGE ADJUSTMENTS2012-13 FTE-2AADOPTED MARCH 8, 2013 BY ENROLLMENT ESTIMATING .0CCTCMIS: FTECOL, CO2AF29C - 03/11/2013 12:16 PMSOURCE: 11291.030293.0352613.0Page 2 of 35
FLORIDA COLLEGE SYSTEMFTE ENROLLMENT: FUNDED, LOWER AND UPPER DIVISION2012-13 0.062.711399.2CCTCMIS: FTECOL, CO3F29C - 08/01/2013SOURCE: 1:31 PMPage 3 of 35
FLORIDA COLLEGE SYSTEMENROLLMENT ESTIMATING CONFERENCE SUMMARYFTE ENROLLMENT: FUNDED-30, LOWER AND UPPER DIVISION2011-12FTE3ACTUALC12012-13FTE2ACOLL ADJESTIMATESC2FTE3 2012TOFT2A 2013FTE3 2012TOFT2A 2013CHANGE% CHANGEC1 TO C2C1 TO C22012-13FTE3FTE3 2012TOFTE3 2013FTE3 2012TOFTE3 2013FT2A 2013TOFTE3 2013FT2A 2013TOFTE3 2013CHANGE% CHANGECHANGE% CHANGEC1 TO C3C1 TO C3C2 TO C3C2 TO 08.6-21,941.8-5.9%-2,504-0.7%CCTCMIS: 7/31/2013SOURCE: FN30C3, FN30C3, FN30C2APage 4 of 35
THE FLORIDA COLLEGE SYSTEMFTE ENROLLMENT: FUNDED-30, LOWER AND UPPER DIVISIONS2012-2013 FTE-3USING 2012-13 DEFINITION OF FUNDED FTECOLLEGEEastern Florida State CollegeBroward CollegeCollege of Central FloridaChipola CollegeDaytona State CollegeEdison State CollegeFlorida State College at JacksonvilleFlorida Keys Community CollegeGulf Coast State CollegeHillsborough Community CollegeIndian River State CollegeFlorida Gateway CollegeLake-Sumter State CollegeState College of Florida, Manatee-SarasotaMiami Dade CollegeNorth Florida Community CollegeNorthwest Florida State CollegePalm Beach State CollegePasco-Hernando Community CollegePensacola State CollegePolk State CollegeSt. Johns River State CollegeSt. Petersburg CollegeSanta Fe CollegeSeminole State College of FloridaSouth Florida State CollegeTallahassee Community CollegeValencia CollegeSYSTEM% CHANGE 2012-13 OVER 17.3%-4.9%POSTSEC 93796-12.9%POSTSECADULTADULTADULT SEC/GEDVOCAPPRENT -5.9%CHANGE OVER 1YEARCHANGE OVER 2YEARSCHANGE OVER 3YEARSCHANGE OVER 4YEARSCHANGE OVER 5YEARSCHANGE OVER 6YEARS2011-12 TO 2012-132010-11 TO 2012-132009-10 TO 2012-132008-09 TO 2012-132007-08 TO 2012-132006-07 TO ,720% CHANGE2007-088.2%OVER 2006076.0%% CHANGE2011-12OVER 201011% CHANGE2010-11-0.9%OVER 200910% CHANGE2009-105.7%OVER 200809% CHANGE2008-099.9%OVER 200708Source: J:\Daisy\from CCTCMIS\2012-13 FTE-3\CO3F29C*Beginning in FY 2010-11, enrollment in CWE programs is no longer included and upper division is included for funding purposes. This entire chart excludes CWE and includes upper division for comparison purposes.J:\Finance\Work\Meetings & Presentations\Enrollment Estimating Conference\2013\August 7 meeting\2012-13 FTE 3 enrollment and 6-yr comparison upper and lower SRS 8-1-13Page 5 of 35
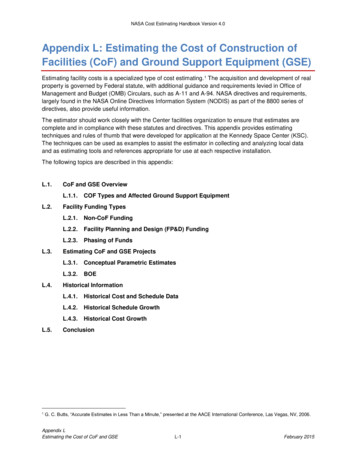
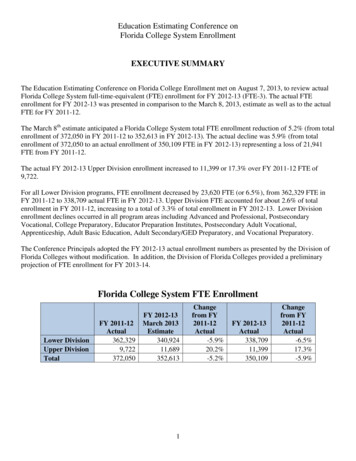
Florida College System2012-13 FTE-3 Over 2011-12 FTE-3 Change in FTE by Program AreaUPPER DIVISION (3.3% of total FTE)1,678ADULT SEC/GED PREP (0.4% of total FTE)-99EPI (0.2% of total FTE)-118ADULT BASIC (1.4% of total FTE)-442POSTSEC ADULT VOC (2.8% of total FTE)-447VOC PREP (0.2% of total FTE)-554APPRENT (1.0% of total FTE)-687POSTSEC VOC (16.8% of total FTE)-3,278COLLEGE PREP (10.2% of total FTE)A & P (63.6% of total FTE)-6,602-11,394-11,500 -10,500 -9,500 -8,500 -7,500 -6,500 -5,500 -4,500 -3,500 -2,500 -1,500-5005001,500Change in FTEJ:\Finance\Work\Meetings & Presentations\Enrollment Estimating Conference\2013\August 7 meeting\2012-13 FTE 3 enrollment and 6-yr comparison upper and lower SRS 8-1-13Page 6 of 35
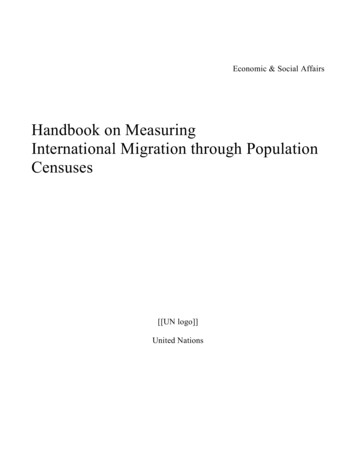
COUNTER-CYCLICAL HEADCOUNT ENROLLMENT PATTERNComparison of Florida Employment Rate to Florida College System Headcount Enrollment100.0900,000880,00098.0EMPLOYMENT RATEUNDUPLICATED \Meetings & Presentations\Enrollment Estimating Conference\2013\August 7 meeting\Counter Cyclical chart 8-1-13680,000Page 7 of 35FCS HeadcountFlorida Employment Rate840,000
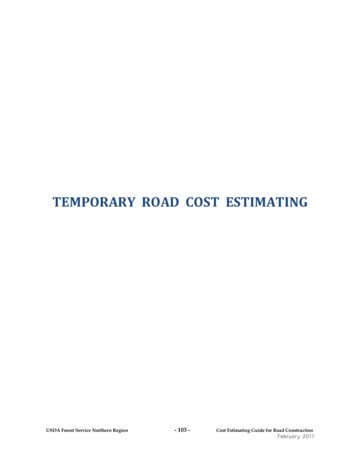
Florida College SystemFTE History - Grand Total, All \Finance\Work\Meetings & Presentations\Enrollment Estimating Conference\2013\August 7 meeting\FTE HISTORY 30 CREDIT HOUR - 12 YEARS SRS 8-1-13Page 8 of 35
Florida College SystemFTE History - Lower \Finance\Work\Meetings & Presentations\Enrollment Estimating Conference\2013\August 7 meeting\FTE HISTORY 30 CREDIT HOUR - 12 YEARS SRS 8-1-13Page 9 of 35
Florida College SystemFTE History - Upper 9-102010-112011-122012-13J:\Finance\Work\Meetings & Presentations\Enrollment Estimating Conference\2013\August 7 meeting\FTE HISTORY 30 CREDIT HOUR - 12 YEARS SRS 8-1-13Page 10 of 35
Florida College SystemFTE History - Postsecondary VocationalFlorida College SystemFTE History - Advanced & 040,00030,000100,00020,00050,00010,000002001-02 2002-03 2003-04 2004-05 2005-06 2006-07 2007-08 2008-09 2009-10 2010-11 2011-12 2012-132001-02 2002-03 2003-04 2004-05 2005-06 2006-07 2007-08 2008-09 2009-10 2010-11 2011-12 2012-13Florida College SystemFTE History - College PreparatoryFlorida College SystemFTE History - Educator Preparation 005,000200002001-02 2002-03 2003-04 2004-05 2005-06 2006-07 2007-08 2008-09 2009-10 2010-11 2011-12 2012-132001-02 2002-03 2003-04 2004-05 2005-06 2006-07 2007-08 2008-09 2009-10 2010-11 2011-12 2012-13Florida College SystemFTE History - Postsecondary Adult VocationalFlorida College SystemFTE History - 00002001-02 2002-03 2003-04 2004-05 2005-06 2006-07 2007-08 2008-09 2009-10 2010-11 2011-12 2012-1302001-02 2002-03 2003-04 2004-05 2005-06 2006-07 2007-08 2008-09 2009-10 2010-11 2011-12 2012-13J:\Finance\Work\Meetings & Presentations\Enrollment Estimating Conference\2013\August 7 meeting\FTE HISTORY 30 CREDIT HOUR - 12 YEARS SRS 8-1-13Page 11 of 35
Florida College SystemFTE History - Continuing Workforce EducationFlorida College SystemFTE History - Adult 0004,0006,0003,0004,0002,0002,0001,000002001-02 2002-03 2003-04 2004-05 2005-06 2006-07 2007-08 2008-09 2009-10 2010-11 2011-12 2012-132001-02 2002-03 2003-04 2004-05 2005-06 2006-07 2007-08 2008-09 2009-10 2010-11 2011-12 2012-13Florida College SystemFTE History - Adult Secondary / GED PreparationFlorida College SystemFTE History - Vocational 01,5002,0001,0001,000500002001-02 2002-03 2003-04 2004-05 2005-06 2006-07 2007-08 2008-09 2009-10 2010-11 2011-12 2012-132001-02 2002-03 2003-04 2004-05 2005-06 2006-07 2007-08 2008-09 2009-10 2010-11 2011-12 2012-13Florida College SystemFTE History - Special Disabled Adult90080070060050040030020010002001-02 2002-03 2003-04 2004-05 2005-06 2006-07 2007-08 2008-09 2009-10 2010-11 2011-12 2012-13J:\Finance\Work\Meetings & Presentations\Enrollment Estimating Conference\2013\August 7 meeting\FTE HISTORY 30 CREDIT HOUR - 12 YEARS SRS 8-1-13Page 12 of 35
THE FLORIDA COLLEGE SYSTEMHISTORICAL DATAFTE HISTORYFlorida Department of EducationPage 13 of 35
FLORIDA COLLEGE SYSTEMFTE ENROLLMENT: FUNDED-30, LOWER AND UPPER DIVISION2012-13 12,28010,94730,074350,109CCTCMIS: FTECOL, CO2AF29C - 02/22/2013 1:27 PMSOURCE: FN30C2ANotes:The Special Disabled Adult category was no longer reported starting in 2005-06.The EPI (Educator Preparation Institute) category began reporting in 2005-06.The Upper Division category began reporting in 2002-03.The CWE (Continuing Workforce Education) category was no longer reported starting in 2010-11.J:\Finance\Work\Meetings & Presentations\Enrollment Estimating Conference\2013\August 7 meeting\FTE HISTORY 30 CREDIT HOUR - 12 YEARS SRS 8-1-13Page 14 of 35
FLORIDA COLLEGE SYSTEMHISTORICAL FTE ENROLLMENT: LOWER AND UPPER DIVISION2011-12 ,43012,55015,1702,41612,21931,531372,050CCTCMIS: FTECOL, CO3F29C - 07/24/2012 10:59 AMSOURCE: FN30C3Notes:The Special Disabled Adult category was no longer reported starting in 2005-06.The EPI (Educator Preparation Institute) category began reporting in 2005-06.The Upper Division category began reporting in 2002-03.The CWE (Continuing Workforce Education) category was no longer reported starting in 2010-11.J:\Finance\Work\Meetings & Presentations\Enrollment Estimating Conference\2013\August 7 meeting\FTE HISTORY 30 CREDIT HOUR - 12 YEARS SRS 8-1-13Page 15 of 35
FLORIDA COLLEGE SYSTEMHISTORICAL FTE ENROLLMENT: LOWER AND UPPER DIVISION2010-11 1,174375,292CCTCMIS: FTECOL, CO3F29C - 07/15/2011 5:17 PMSOURCE: FN30C3Notes:The Special Disabled Adult category was no longer reported starting in 2005-06.The EPI (Educator Preparation Institute) category began reporting in 2005-06.The Upper Division category began reporting in 2002-03.The CWE (Continuing Workforce Education) category was no longer reported starting in 2010-11.J:\Finance\Work\Meetings & Presentations\Enrollment Estimating Conference\2013\August 7 meeting\FTE HISTORY 30 CREDIT HOUR - 12 YEARS SRS 8-1-13Page 16 of 35
FLORIDA COLLEGE SYSTEMHISTORICAL FTE ENROLLMENT: LOWER AND UPPER DIVISION2009-10 FTE-3 REVISED NOVEMBER 14, 72,63539,916EPI406
Florida College System full-time-equivalent (FTE) enrollment for FY 2012-13 (FTE-3). The actual FTE enrollment for FY 2012-13 was presented in comparison to the March 8, 2013, estimate as well as to the actual FTE for FY 2011-12. The March 8th estimate anticipated a Florida College System total FTE enrollment reduction of 5.2% (from total