Transcription
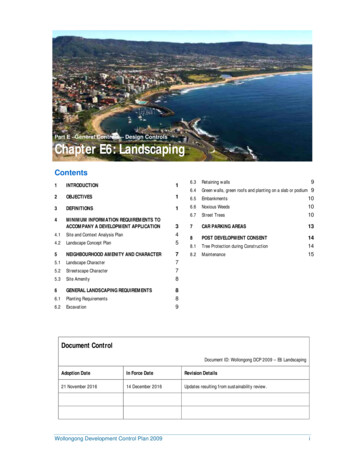
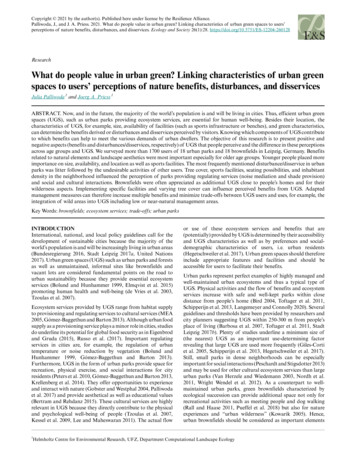
International Journal of the Malay World and Civilisation (Iman) 4(Special Issue 2), 2016: 5 - uantitative Description of Urban Landscape by Analyzing Topography in “Openness” IndexA Case Study in Tokyo Yamanote RegionPenerangan Kuantitatif Berkaitan Landskap Bandar dengan Menganalisis Topografi Index “Keterbukaan”Satu Kajian Kes di Rantau Yamanote TokyoYusaku Takano & Yoh SasakiABSTRACTAlthough land use in megacity is changing rapidly, topography condition is relatively stable. To understand the characteristicsof topography and its effect to the formation of urban landscape, it is important to discuss not only about natural environmentsustainability, but also socio-cultural identity in the area. The topography of Tokyo is generally clarified as two zones, thewest side called “Yamanote” which is the highland eroded by small rivers and valleys, and the east side called “Shitamachi”which is the alluvial land. There are some differences in urban landscape and socio-economical phenomena between thesetwo areas which are influenced by topographical characteristics. Especially Yamanote area, labyrinthine street networksare formed by narrow and curved valleys, green spaces are preserved in steep land, while each place has unique landscape.Usually, these characteristics are discussed in fuzzy and qualitative sense, but in this paper, we present these characteristicsby quantitative methods and indexes. We specifically analyzed such topographical characteristics in Tokyo Yamanote areaby “Openness” index where slope can be described in broader scale. Furthermore, we described two characteristics of builtenvironment by Space Syntax theory for street network pattern and GIS data for land use property included green area. Bylayering these three characteristics, the uniquely of areas could be identified. This method might be important to be appliedin actual planning.Keywords: Topography analysis; openness; space syntax; TokyoABSTRAKWalaupun guna tanah di bandar raya berubah dengan sangat cepat, keadaan topografi dalam keadaan stabil. Untuk memahamikarektaristik dan kesan pembentukan landskap bandar, adalah sangat penting untuk membincangkan identiti sosiobudayadi kawasan itu serta kelestarian alam semula jadi. Topografi di Tokyo secara umum terbahagi kepada dua zon. Bahagianbarat dinamakan “Yamanote” yang mana tanah tinggi yang terhakis oleh sungai-sungai kecil dan lembah, dan sebelah timurdipanggil “Shitamachi” yang merupakan tanah lanar. Terdapat beberapa perbezaan dalam landskap bandar dan fenomenasosioekonomi antara kedua-dua kawasan yang dipengaruhi oleh ciri-ciri topografi. Terutama kawasan Yamanote, rangkaianjalan labirin terbentuk oleh lembah sempit dan melengkung, kawasan hijau dipelihara di tanah curam, manakala setiaptempat mempunyai landskap yang unik. Biasanya, ciri-ciri ini akan dibincangkan dalam erti kabur dan kualitatif, tetapi dalamkertas kerja ini, kami membentangkan ciri-ciri ini dengan kaedah kuantitatif dan indeks. Kami secara khusus menganalisisciri-ciri topografi seperti di kawasan Tokyo Yamanote oleh “Keterbukaan” indeks di mana cerun boleh digambarkan dalamskala yang lebih luas. Tambahan pula, kami diterangkan dua ciri-ciri persekitaran yang dibina oleh teori Space Syntax untukcorak dan GIS data rangkaian jalan untuk kegunaan tanah harta termasuk kawasan hijau. Oleh itu lapisan ketiga-tiga ciriciri yang unik kawasan dapat dikenal pasti. Kaedah ini mungkin penting untuk diaplikasikan dalam perancangan sebenar.Kata kunci: Analisis topografi; keterbukaan; space syntax; TokyoIntroductionTOPOGRAPHY IN TOKYOIt is well known that Tokyo is one of the largestMegacities in the world. Its urban area hasevolved in relation to the surrounding topographicconditions, since the foundation of Edo (the formername of Tokyo) in the 17th century. Figure 1 showsthe topography of Tokyo1, where blue indicates thelower elevations, brown and yellow indicate thehigher elevations. The territory of Edo in the premodern age can be seen in Figure 1 (the limits aredenoted within the red colored line).The topography of Tokyo is generally classifiedinto two zones; the west side known as “Yamanote”
6Yusaku Takano & Yoh Sasaki(composed highland eroded by small rivers andvalleys), and the east side known as “Shitamachi”(alluvial land), and some differences in the urbanconfiguration exist between the two zones. Forexample, most of the street patterns in Shitamachiare shaped as regular grid blocks, which have beenenabled because of the flat landform, whereasthe main street pattern in Yamanote is irregular,complicated, and organic, because of the steep andconcavo-convex landform. This difference has thusinfluenced the land use within each area, and thesocio-economic and cultural identity of each partof the city has tory of EdoAnalysis AreaFIGURE1. Topography in the center of TokyoFIGURE2. Satellite Image of TokyoSTUDY AIMSMuch research has referred to topographicalcharacteristics and street patterns in a qualitativeway. As a representative example, Humihiko Maki etal. 2 studied the characteristics of topography, streetpatterns and buildings, focusing particularly on theoriginality of Edo and Tokyo, and pointed out thatthe street pattern of Tokyo lacks centrality within itssystem, which is a common future of Japanese castletowns. In place of centrality, the study relates thatJapanese towns have the characteristic of “Oku”;which means “depth” in Japanese.Such ideas, and those of other studies, arehighly suggestive, but they use qualitative means todescribe their findings. Therefore, the developmentof methods and indices for the analysis of suchphenomena is considered necessary. Because ofthe result of the recent progress in remote sensingtechnology techniques and the disclosure of precisegeographical information data, the use of GISenables a broad and detailed analysis of topography.In addition, certain methods have been designed toanalyze the spatial configuration of urban space,and Space Syntax theory is an example of such amethod. The purpose of this study is to present a wayof describing these characteristics using quantitativemethods and indices.LAND USE IN TOKYOThe fundamental structure of Tokyo’s urban area wasformed in the 17th Century, and has been graduallyextended during the pre-modern age. Following theindustrialization and modernization of the late 19thcentury, the urban area was subsequently rapidlyextended and densely developed.Unfortunately, the Great Kanto Earthquakeof 1923, and the air attacks of the 2nd World Warin the mid 1940’s had completely burned anddestroyed Tokyo. However, the rehabilitationprojects implemented after these two disastersensured that the fundamental structure of Tokyowas not drastically changed, and certain reasonsexist for this adherence to the original structure. Themajor reasons are, of course, financial and political;the country was not financially able to constructan entirely new infrastructure. However, anotherdominant reason was that the basic condition ofthe topography strongly constrained the urbanconfiguration.
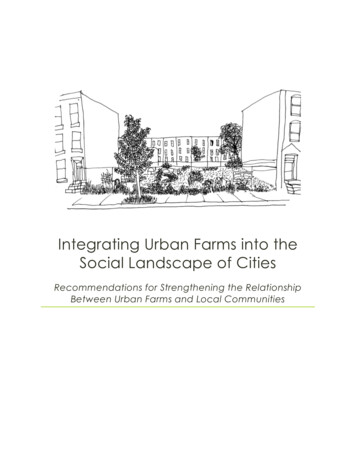
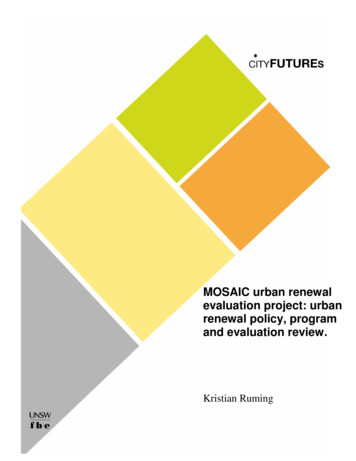
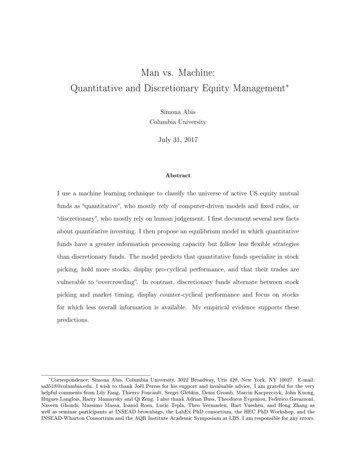
Yusaku Takano & Yoh Sasaki 7Figure 2 shows a current satellite image of thesame area shown in Figure 1. The land is seen tobe predominantly covered with buildings, with theexception of a few large green areas, which areassociated with places such as the Imperial Palaceand Meiji-Jingu Shrine.Figure 3 shows the current land use area ratiofor each ward inside the analysis zone of 2006. Themajor land use type appears to be residential and thesecond most common land use type is commercial,(with the exception of streets). However, some wardscannot be categorized using such a generalization.The land use of Chuo, Chiyoda, and Minato Wards isdominated by the existence of offices, and ArakawaWard is relatively dominated by factories (the classiccharacteristic of Shitamachi).FIGURE4. Image of openness (Left; over-ground, Right;under-ground)Distance: L URE0%20%40%60%80%ChuoShitamachiGovernmentCulture & teAgricultureNakanoParkVacant/Parking LotSuginamiStreetToshimaRailwayOTHERSTotalFIGURE5. Image of over/under-ground angle100%3. The current land use area ratioMETHODOLOGYOPENNESS INDEXThe Openness Index was developed by Yokoyamaet al. in 1999 to analyze topographical conditionsof mountainous areas, with a particular focus onthe risk of landslides3. The study developed twotypes of indices; over-ground openness which isthe characteristic to describe sky extent over thepoint; and under-ground openness which is thecharacteristic to describe underground extent. Figure4 shows images of the indices.The process of calculating the indices ofopenness are summarized as follows:1. To calculate the over-ground angle φ, or theunder-ground angle ψ, in the optional searchingdistance range L; a distance of 100m was setin this study. Figure 5 shows an image of theover-ground angle and the under-ground angle.2. Openness is calculated by the average of groundangles of eight directions in each point.Dimension of the openness is in degrees. Ifthe landform of a point is convex, the readingof over-ground openness is higher, and if thelandform of a point is concave, the over-groundopenness is lower. In this study, we firstlyapply over-ground openness to analyze thecharacteristics of valleys and steep lands andthen examine the difference between opennessand slope index. Figure 6 shows two maps ofthe same part of Tokyo: the left hand map showsthe characteristics of slope; the right hand mapshows the characteristics of openness. Thecharacteristics of gradient on a local scale canbe described using the slope index, because theslope index is calculated by the relationshipbetween continuous points. However, by doingso, we can understand the characteristics oftopography on a broader scale and identify theshape of each valley or steep land as a region,but it is not possible to avoid noise from themicroscopic irregularity of landform.
8Yusaku Takano & Yoh Sasaki1) Open space4) Unjustified GraphFIGUREFIGURE6. Slope map and openness mapSPACE SYNTAX THEORY AND AXIAL ANALYSISSpace Syntax theory was devised by Prof. BillHillier and Prof. Julienne Hanson in 1970’s, andwas then developed by their colleagues at TheBartlett, University College London4. According tothe Website of “Space Syntax Network” 5, the SpaceSyntax theory is explained as follow; Space syntaxis a science-based, human-focused approach thatinvestigates relationships between spatial layoutand a range of social, economic and environmentalphenomena.Originally, the uniqueness of Space Syntax usedthe basic components of analysis; convex spaceand axial line, which are based on visibility andaccessibility. The open space of analysis is dividedinto segments by these components, and the relationbetween components is then measured in topologicaldistance. In other words, the Euclidean distance isignored in Space Syntax. In recent studies, however,various methods and indices are developed for muchmore precise and detail analysis.Usually, axial analysis is applied for the analysisof broad scale urban space; particularly for streetnetwork patterns (see Figure 7 for a representativeprocess of axial analysis).2) Convex space and Axial Line3) An Axial Map5) Justified Graph7. The process of making an axial mapThe steps shown in Figure 7 for making an AxialMap are denoted as follows:1. Open space is identified from the original map.2. Open space is divided into convex spaces. Axiallines are then drawn along the convex spacesuntil all convex spaces are stringed by the leastset of the longest axial lines.3. An axial map is produced.4. Axial lines are replaced to the nodes of a graph,and the connections between contiguous linesare replaced to the paths. This figure is calledan “unjustified graph”.5. Nodes of the unjustified graph are ordered bythe depth from each node. The justified graphis made using every node in the graph. Therelationship between axial lines is calculated intopological distance and is known as “depth”.The depth between two lines is the minimumnumber of axial lines passing through one lineto others.6. The Mean Depth (MD) is calculated by theaverage of all the values of depth.In this study, we apply Integration Value, whichis calculated from Mean Depth using the followingequations:RA Dk 2(𝑀𝑀𝑀𝑀 1)𝑘𝑘 2(𝑘𝑘 𝑧𝑧) 1𝑠𝑠𝑘𝑘 1 𝑘𝑘 22 𝑘𝑘 log 𝑧𝑧RRA 𝑅𝑅𝑅𝑅𝐷𝐷𝐷𝐷(1)(2)(3)
Yusaku Takano & Yoh Sasaki 9Integration Value 1𝑅𝑅𝑅𝑅𝑅𝑅(4)whereMD is Mean Depth andk is the number of axial linesRelative Asymmetry (RA) is calculated bydividing the number of axial lines by MD. RealRelative Asymmetry (RRA) is calculated bydividing Dk by RA. Dk is the coefficient to reducethe system size effect. The Integration Value is thencalculated using the inverse of RRA.Integration Value indicates the potential ofnatural movement. The line has higher accessibilitywhen the Integration Value of the axial line is higher.The Integration Value is then calculated using twotypes of radii; the Global Integration Value, whichis calculated within the whole system, and the LocalIntegration Value, which is calculated within anoptional radius.According to existing research6, the LocalIntegration Value calculated in Radius 3 has thebest correlation with pedestrian density, and theGlobal Integration Value (or the Local IntegrationValue calculated using the higher Radii) has bettercorrelation with the movement of car. In this study,we apply the Local Integration Value in Radius 3 to describe spatial configuration on a pedestrianmovement scale.ABOUT ORIGINAL DATA SOURCESThe original data sources used for analysis are asfollows:1. Digital Elevation Model Data published bythe Geospatial Information Authority of Japan(2003) Used for the analysis of Openness. Themesh size is 5m, and the degree of accuracy is0.1m.2. 1:2500 Scale Digital Topographic Map publishedby Tokyo Digital Map Co. (2004). The shape ofthe street polygon was obtained from this data,which was then used for making the axial map.OVERVIEW OF RESULTSOPENNESSFigure 8 shows a thematic map indicating openness,using a grayscale color gradient. Lighter colorindicates a higher value, and darker color indicates alower value. Using this scale, major steep zones areseen to be continuously distributed along the rivers.ZONING BY VALUES8. Thematic map of over-ground opennessMM’TakadanobabaTSteep zoneFlat zoneT’OpennessFlat zoneElevationOkuboO’Okubo SectionT’TOFlat zoneOOpennessMejiroElevationFIGUREO’Takadanobaba SectionFlat zoneSteep zoneFlat zoneMejiro SectionTakadanobabaMejiroFIGURE9. Openness threshold studyM’OpennessMElevationAs previously discussed, when quantitative indicesare given it is possible to draw a thematic map usingthese values. However, the way of identifying aspecific point tends to be qualitative and arbitrary.To solve this problem, we attempt to identify the“zone” by the value of indices.Concretely speaking, we drew the contourline of the value by using the function of ArcGIS.By setting an optional threshold for the value, wecan identify specific zones as polygons. By thenlayering polygons with different characteristics(openness and the integration value in this study)the relationship between two characteristics can beclarified.
10Yusaku Takano & Yoh Sasakistreets tends to be higher. In this analysis, almostall the designated main streets are identified ashaving high integration value.3. However, the inner core of the block thatis surrounded by main streets has a lowerintegration value, particularly in the Yamanotearea.FIGURETo identify significant zones using the valueof the integration value, we set two thresholds:the Integration Value 3.0 for identifying thehigher integration zone and the integration value 2.0 for identifying the lower integration zone.Figure 12 shows the distribution of the higherand lower integration zones. It is evident that theareas representing the lower integration zonesare relatively smaller than those of the higherintegration zone.10. Distribution of steep zonesIn order to identify steep zones by the valueof openness, we examined the threshold of certainsections, and elevation and openness were measuredin three sections (as samples) (Figure 9). When thethreshold was set as 88 degrees, it was possible toidentify a valley in the Takadanobaba Section, and aslope in the Mejiro Section as a steep zone. There isa shallow concave area in the middle of the Okubosection, measuring approximately 2 m in height and100 m in width but this is not identified as a steepzone in this study. Figure 10 shows the steep zonesand flat zones in the analysis area. The shape of steepzones traces the line of the river and valley, and thiscan be seen particularly in Minato Ward and ShibuyaWard in the southern part of ACE SYNTAX (INTEGRATION VALUE)FIGUREFigure 11 shows an axial map indicating integrationvalues (Radius 3). The red color indicates a higherintegration value and the blue color indicates alower integration value. The characteristics of streetpatterns are summarized as follows;1. In general, integration value of a grid shapedstreet pattern tends to be higher, because thegrid pattern is an efficient street pattern in theviewpoint of accessibility. Thus, in this analysis,Shitamachi to the east and Suginami area to thewest have higher integration values becausethey are towns designed with a dominant gridpattern.2. Because the line shape of lines in the mainstreets tends to be linear, the axial lines on mainstreets tend to be longer and connect with moreother lines. Thus, the integration value of mainLegendIV R 3港区11. Axial map (integration value radius 3)大田区LegendIV 3.0IV 2.0FIGURE12. Integration value polygons
Yusaku Takano & Yoh Sasaki 11CASE STUDYR E L AT I O N B E T W E E N O P E N N E S S A N DINTEGRATION VALUEUsing a regular shape grid to build streets withinstraight lines and blocks is generally easier if thelandform of the city is plain. Thus, zones with higherintegration value zones tend also to be distributed onflat zones. In other words, the points where these twozones layer each other have the potential of beingremarkable places within a city.Figure 13 and Figure 14 show maps layeringthe two zones: the higher/lower integration valuezone and the steep zone. The red-colored polygonsshow the higher integration value zone, the blue onesshow the lower, and the gray ones show the steepzones. The star on the map indicates the locationof a railway station; the thick dotted lines indicatethe railway line.Figure 13 shows a map of Shibuya city (oneof the most famous entertainment and commercialdistricts of Tokyo), with its unique topography.Shibuya station is located in the bottom of the valleyand the shops, theaters and offices (the pedestriandestinations) are located along the hill. Becausesome main streets intersect one another near thestation, a higher integration value zone is identifiedaround the station. This higher integration valuezone also intersects with some steep zones nearthe station. In addition, some lower integrationvalue zones are distributed around the station, andalmost the entire area of each zone intersects withsteep zones.Figure 14 shows a map of the area aroundShinjuku city, where the Tokyo Metropolitangovernment building is located. Shinjuku is alsothe central business and entertainment district. Dueto land adjustment projects and re-developmentprojects, the street pattern around Shinjuku Stationhas been relatively improved to that of a regularshape. Thus, the integration value around the stationis high, and some areas of large higher integrationvalue zones are identified. However, these do nottend to intersect with the steep zone, and areas ofthe lower integration value zones with steep zonesare located at relatively large distance from ShinjukuStation.These structural differences in the topographyand the street pattern may, therefore, influencethe characteristics of the landscape. Both Shibuyaand Shinjuku are the representative commercial,business and entertainment districts of Tokyo, butthe characteristics of the landscape and the imageof town are quite different from each other. It isevident that single elements such as a building, sign,or street is unique, and is a primary factor definingthe image of the city, whereas the characteristicsof topography and street pattern identified in thisstudy are not as predominantly visible. However, itis clear that these characteristics too are importantfactors, because they are based on the shape ofground, and therefore influence the fundamentalimage of the city.FIGURE13. Layering map in ShibuyaFIGURE14. Layering map in ShinjukuCONCLUSIONIn this study we applied two quantitative methods,the Openness index for analysis of topographicalcharacteristics, and the Space Syntax Theory forstreet patterns, and presented the way of identifyingspecific zones according to values, as calculated byprevious methods.
12Yusaku Takano & Yoh SasakiAs a result of conducting a case study, wedescribed the different characteristics of spatialconfiguration between two districts: Shibuyaand Shinjuku. Furthermore, the characteristicsof landscape and an image of the district can beclarified. It is considered that this method could beapplied to other indices of various characteristicsand a quantitative understanding of urban space maybe achieved for application in actual urban planningby using layering in many different kinds of maps.ACKNOWLEDGEMENTI would like to show my greatest appreciation toMr. Takanori Tsunogai. Important parts of this paperare based on his master thesis. Without his idea andgreat contribution, this paper would not have beenpassible. This work was supported by JSPS KAKENHIGrant Number 23-7004.Yusaku TakanoDepartment of Civil and Environmental EngineeringWaseda University*Corresponding Author.Tel: 81-3-5286-3989Fax: 81-3-5286-3989E-mail: ysk.takano@aoni.waseda.jpReceived: 12 July 2015Accepted: 08 January 2016REFERENCESGoogle Earth. 2012. Tokyo Terrain for Google Earth. http://www.gridscape.net/. Access on: 12 February 2012.Hillier, B. 2003. A Theory of the City as Object. Proceedingsof 4th International Space Syntax Symposium.Hillier, B., Hanson, J. 2009. The Social Logic of Space,Cambridge University Press.Maki, H., Wakatsuki, Y., Ono, H., Takatani, T. 1980. Miegakuresuru-Toshi,Kajima-Publishing.Space Syntax Network. http://www.spacesyntax.net/. Accesson: 12 February 2012.Yokoyama, R., Sirakawa, M., Kikuchi, Y. 1984. Representationof topographical features by openness. Journal of theJapan Society of Photogrammetry and Remote Sensing38(4): 26-33.
Bartlett, university college London 4. According to the Website of "Space Syntax Network" 5, the Space Syntax theory is explained as follow; Space syntax is a science-based, human-focused approach that investigates relationships between spatial layout and a range of social, economic and environmental phenomena.