Transcription
Delaware Juvenile Recidivism2003 – 2008 JuvenileLevel III, IV and V Recidivism StudyJune 2009State of DelawareOffice of Management and BudgetStatistical Analysis Center
Delaware Juvenile Recidivism:2003 – 2008 Juvenile Level III, IV and V Recidivism Study.Prepared by the Statistical Analysis Center, Office of Management and Budget, State ofDelaware.Authors:Jorge Rodríguez-Labarca, Senior Analyst,John P. O’Connell, Director.State of Delaware Document Number: 100208-090503.
Table of ContentsExecutive Summary . 1Introduction. 3FY06 Recidivism Summary. 4FY06 12 Month Recidivism Rates. 5Different Measures of Recidivism. 8Total Re-arrest Patterns . 8Comparing Misdemeanor Plus Felony and Felony Only Recidivism Rates . 10Technical Note: Measuring Recidivism . 12Interpreting Recidivism Results: A Caution. 13Level V, IV, and III Felony Recidivism Tables.15Level IV Felony Recidivism Rates . 25Data Sets .63Criminal Justice Information System. 63Juvenile Placement Data. 64DOC Data. 65Level III, IV and V Recidivism Study Dataset. 65Appendix.67Historical Recidivism Rates . 67i
Table of DisplaysLevel V Displays .17Display 1, Level V Felony Recidivism Rates.17Display 2, Ferris School for Boys Felony Recidivism Rates .18Display 3, New Castle County Detention Center Adjudicated Felony Recidivism Rates .19Display 4, Child Mental Health Level V Hold Felony Recidivism Rates.20Display 5, South West Indiana Youth Village Secure Care Felony Recidivism Rates .21Display 6, Stevenson House Detention Center Adjudicated Felony Recidivism Rates .22Display 7, Level V Small Program Felony Recidivism Rates.23Level IV Displays .25Display 6, Level IV Felony Recidivism Rates .25Display 7, Chamberlain Academy, High Impact, Felony Recidivism Rates.26Display 8, Glen Mills Schools Felony Recidivism Rates.27Display 9, Grace Cottage Felony Recidivism Rates.28Display 10, Mountain Manor Treatment Center Felony Recidivism Rates .29Display 11, Mowlds Cottage Felony Recidivism Rates .30Display 12, New Castle County Detention Center Level IV Felony Recidivism Rates.31Display 13, Snowden Cottage Felony Recidivism Rates .32Display 14, South West Indiana Youth Village Drug and Alcohol Felony Recidivism Rates.33Display 15, Springfield Academy Felony Recidivism Rates .34Display 16, Stevenson House Detention Center Level IV Felony Recidivism Rates .35Display 17, Summit Academy Felony Recidivism Rates.36Display 18, Today Inc., New Dawn, Felony Recidivism Rates .37Display 19, VisionQuest, Boot Camp, Felony Recidivism Rates .38Display 20, VisionQuest, Madalyn Program, Felony Recidivism Rates.39Display 21, Youth Services Agency Felony Recidivism Rates.40Display 22, Level IV Small Program Felony Recidivism Rates .41Level III Displays .49Display 22, Level III Residential Felony Recidivism Rates.49Display 23, Cornell Abraxas, Home Based Services, Felony Recidivism Rates .50ii
Display 24, Cornell Abraxas, Intensive Home Based Services, Felony Recidivism Rates. 51Display 25, Camelot Shelter Services Felony Recidivism Rates. 52Display 26, Lead Inc. Home Based Services Felony Recidivism Rates. 53Display 27, Ministry of Caring, House of Joseph II, Felony Recidivism Rates. 54Display 28, Project Stay Free, Day Treatment Program, Felony Recidivism Rates. 55Display 29, Project Stay Free, Intensive Home Based Services, Felony Recidivism Rates. 56Display 30, Providence Service Corporation, Home Based Family Services, FelonyRecidivism Rates. 57Display 31, Psychotherapeutic Children’s Services, Family Support Services, FelonyRecidivism Rates. 58Display 32, Psychotherapeutic Children’s Services, Multisystemic Therapy Program, FelonyRecidivism Rates. 59Display 33, VisionQuest, Family-Centered Intensive Case Management Program, FelonyRecidivism Rates. 60Display 34, Level III Small Program Felony Recidivism Rates. 61Historical Recidivism Displays. 67Display 34, Level V Historical Program Felony Recidivism Rates . 68Display 35, Level IV Historical Program Felony Recidivism Rates . 69Display 36, Level III Historical Program Felony Recidivism Rates . 72Table of ChartsFigure 1, Level V FY06 Re-arrest Recidivism 1 Year After Release, n 177 . 8Figure 2, Level IV FY06 Re-arrest Recidivism 1 Year After Release, n 661 . 9Figure 3, Level III FY06 Re-arrest Recidivism 1 Year After Release, n 1,460 . 9Table of TablesTable 1, Youth Arrested for a Felony within 12 Months of Release from a Level V Episode,FY06 Releases. 5Table 2, Youth Arrested for a Felony within 12 Months of Release from a Level IV Episode,FY06 Releases. 6Table 3, Youth Arrested for a Felony within 12 Months of Release from a Level III Episode,FY06 Releases. 7iii
Table 4, Delaware 12 Month Juvenile Recidivism Rates: A Comparison of MisdemeanorFelony and Felony Arrest Analysis.11Table 5, Percent of Level V Cohorts Through 10 At-Risk Periods.15iv
Executive SummaryThis study of Delaware juvenile recidivism provides a comprehensive summary of re-arrestpatterns when juvenile offenders are released back to the street after concluding a stay in alocked secure facility, a staff secure or a non-secure program. In many cases, a juvenilemoves between programs before being released to the community. For instance, the typicalFerris School for Boys placement episode includes three contiguous placements: (1)admission to the Detention Center, (2) admission to the Ferris School, and (3) transition backto the community through Mowlds Cottage. In this case, time at-risk in the community doesnot start until the juvenile leaves Mowlds Cottage. Time at-risk in the community is adjustedfor subsequent admissions to juvenile facilities and programs and Department of Correctioninstitutions.FY06 Juvenile Recidivism: Level V locked secure facility releases: 43 percent were re-arrested for a felonywithin one year (page 17.) Level IV staff secure programs releases: 40 percent were re-arrested for a felonywithin one year (page 25.) Level III non-secure program releases: 30 percent were re-arrested for a felony withinone year (page 49.)There is an important change regarding how juvenile recidivism is measured and reported inthis report compared to prior years. In past juvenile recidivism reports the youth who wereadjudicated and served more than 10 days in a detention center were all considered to beLevel V offenders. Based on discussions with the Director of the Division of YouthRehabilitative Services, a decision was made to use the Dispositional Guidelines level of thefirst service provided after leaving the adjudicated stay at a detention center as a means todefine the level of the youths' stay at the detention center. If the youth went on to a Level Vprogram, for instance the Ferris School, his detention center stay would be referred to as aLevel V admission. But, on the other hand, if the youth went to a Level IV program such asGlen Mills Schools, he would be referred to as a Level IV youth. In this report, the readerwill see a New Castle and Stevenson House detention center listing under the Level III, LevelIV and Level V recidivism summaries. When the release counts, recidivism rates, andcriminal profiles for the over-all Level III, Level IV and Level V programs as well as the NewCastle and Stevenson House Detention Center summaries are compared to prior years' studies,they will not match.1
Intentionally Blank2
IntroductionThis study provides comprehensive recidivism rates for juvenile offenders released by theDepartment of Services for Children, Youth and Their Families (DSCYF), Division of YouthRehabilitative Services (DYRS) between 2003 and 2008 from out-of-home secure residentialplacements and non-secure programs.1 There are two major levels of security related to outof-home residential placements: secure and non-secure. Under Delaware’s DispositionalGuidelines for Juveniles, youth can be sentenced to these different program levels as well asprobation. The program levels reflect a graduated approach that requires increasinglyintensive programming according to risk and need assessments of each juvenile. The moreintensive programming corresponds to residential secure placements, the less intensive tonon-secure placements: Level V, the most intensive programming available, is comprised of locked secureinstitutional settings like the Ferris School for Boys. Level IV staff secure programs provide 24 hour supervision and general diagnostic,substance abuse and sex offender treatment. Level III programs provide programming in non-secure settings.Most of the programming is provided by contracted private organizations both in Delawareand out-of-state. Recidivism rates are presented for 72 separate institutions, public andprivate residential programs, and Level III programs.The main measure of recidivism used in this study is a felony re-arrest – not a re-convictionor a re-admission – following release from a placement. Re-arrest recidivism rates arereported for six different at-risk intervals: 6, 12, 18, 24, 30 and 36 months. Many juvenilerecidivism studies report truncated results because they stop following juveniles once theyreach the age of majority. This study does not truncate results because Delaware arrests canbe tracked through an offender’s adult years. Its quite common for studies to under reportrecidivism because they do not adjust time at-risk for re-admissions to secure settings. Thisstudy adjusts time at-risk to account for re-admissions to secure juvenile and adult facilitiesand institutions.Juvenile justice policy makers established the use of the felony re-arrest rate as the mainmeasure of recidivism for this series of studies in October of 1998. It was determined that thefelony re-arrest rate tapped some of our most reliable data and that, furthermore, it providesthe possibility for a fairer cross-jurisdictional comparison of recidivism rates. While thefelony re-arrest rate is a viable measure of recidivism, it is preferable to measure recidivismusing multiple measures. Where re-arrest highlights public safety risks to the community, redetention underscores the court’s willingness to remove a juvenile arrestee from the1Due to the use of the latest available placement data for each edition of this report, the release counts,felony recidivism rates, and historical profiles presented in this document are not comparable to informationpresented in previous reports. See page 63 for a detailed explanation of how the datasets and analysis file wereconstructed for this study.3
community, at least temporarily, and re-incarceration would highlight the Family Court’saffirmation of guilt for a new crime.As a means of providing a fuller understanding of juvenile criminal behavior and recidivismtwo additional views of recidivism are provided in the introductory part this study. Inaddition to the main felony re-arrest measure, the full view of all re-arrests (by type of arrest)is examined for FY06; fiscal year – July 1, 2005, to June 30, 2006. Second, the FY03 toFY06 felony plus the misdemeanor re-arrest pattern is examined.FY06 Recidivism SummaryThere were 1,048 individuals released from 1,246 Level V placement episodes during thestudy period from FY03 to FY082. From FY04 to FY06 the 12 month Level V felonyrecidivism rate decreased from 48 percent to 43 percent – a 10 percent decrease in felony rearrest recidivism. The average length of stay in a Level V secure setting increased betweenFY03 and FY08 from 5.5 to 7.5 months. See page 17 for more details on Level V recidivismrates.There were 2,354 individuals released from 4,047 Level IV placement episodes during thestudy period. The recidivism rate decreased from 46 percent in FY03 to 33 percent in FY08 –a 28 percent decrease in felony re-arrest recidivism. The average length of stay in a Level IVsecure setting decreased during this time period from 3.4 to 2.9 months. See page 25 for moredetails on Level IV recidivism rates.There were 3,964 individuals released from 8,782 Level III placements during the studyperiod. The recidivism rate decreased from 35 percent in FY03 to 28 percent in FY08 – a 20percent decrease in felony re-arrest recidivism. The average length of stay in a Level III nonsecure decreased slightly from 2.5 to 2.3 months. See page 49 for more details on Level IIIrecidivism rates.The tables below – Tables 1, 2, 3 – provide the summary FY06 felony re-arrest rates andindividual program detail within each level of sanction. Level IV and Level V recidivism isreported at one year at-risk after release from a secure placement episode. Level IIIrecidivism is reported at one year at-risk from admission to a non-secure program. Theserecidivism results are the most recent available for all three Levels because not all FY07releases have been at-risk for 12 months through the end of the follow-up period on February20, 2009. Table 5, Percent of Level V Cohorts At-Risk Through 10 Post-Release Periods,shows the percentage of each cohort that has gone through a given at-risk period when at-riskperiods are controlled for attrition caused by death and re-admissions to secure settings.24See the explanations of placement episodes on page 12 of this document.
FY06 12 Month Recidivism RatesThe Level V FY06 release cohort recidivism rate at 12 months at-risk for a felony arrest is 43percent. The following table shows the FY06 12 month recidivism rate for Level Vprograms.Table 1, Youth Arrested for a Felony within12 Months of Release from a FY06 Level V EpisodeProgramThe Ferris School for Boys, DEReleased148NumberAt-RiskRecidivism1 YearArrestedRate1296349%New Castle County D.C. Level V, DE66592441%Stevenson House D.C. Level V, DE2321524%Division of Child Mental Health Level V Hold, DE88113%Cornell Abraxas Fire Setter Program, PA22150%20241777643%Level V Episodes33 The recidivism rates presented in this analysis are based on the number of juveniles alive and at-risk in thecommunity at the end of each at-risk period. There were 202 releases during FY06 from Level V episodes.However, three juveniles died within twelve months of their release from a Level V episode and 22 had been readmitted to a secure setting. Since the 177 youth that had been at risk for 12 months had 76 felony re-arrests theFY06 felony recidivism rate is 43 percent ((76/(202 – 3 – 22))*100 43).4 Please note that secure placement episode statistics within a level are not additive. Double counting wouldoccur if an attempt was made to sum to a Level V total because a Level V episode may include admissions tomore than one Level V program and youth may be have been released from more than one Level V episodewithin the same fiscal year.5
The Level IV FY06 release cohort recidivism rate for a felony arrest is 40 percent. Thefollowing table shows the FY06 12 month recidivism rate for Level IV programs.Table 2, Youth Arrested for a Felony within12 Months of Release from a FY06 Level IV EpisodeProgramMowlds Cottage, DENew Castle County D.C. Level IV, DEStevenson House D.C. Level IV, DESnowden Cottage, DEYouth Services Academy, PAGrace Cottage, DEVisionQuest, Boot Camp, PAGlen Mills Schools, PASummit Academy, PASpringfield Academy, SDToday Inc., New Dawn Program, PAChamberlain Academy, High Impact, SDVisionQuest, Madalyn Program, PAClarinda Academy, IAMountain Manor, MDDiversified Treatment Alternatives, PASouth West Indiana Youth Village, INNew Hope, Triad, SCThe Pines, Behavioral Studies Program, VAToday Inc., General, PAManatee Palms Youth Services, FLThe Pines, Adolescent Male Program, TNNew Hope, New Horizon, SCNew Hope, Starting Pointe, SCRiverside Treatment Services, Inc., D.C.The Pines, Project Right Track, SCBenchmark Behavioral Health System, UTChamberlain Academy, General, SDHennepin County Home School, MNVisionQuest, Buffalo Soldiers Academy, PAWay Point Program, SCLevel IV 7764433222211111NumberAt-Risk1 66126640%
The Level III FY06 release cohort recidivism rate at 12 months at-risk for a felony arrest is 30percent. The following table shows the FY06 12 month recidivism rate for Level IIIprograms.Table 3, Youth Arrested for a Felony within12 Months of Release from a Level III Episode, FY06 ReleasesProgramVisionQuest, FCICM, DENumberAt-RiskReleased1 Year435420RecidivismArrestedRate12029%Project Stay Free, Intensive Home Based, DE2892709033%Lead Inc., Home Based Services, DE1691574931%P.C.S., Multisystemic Therapy Program, DE1341312821%Cornell Abraxas, Home Based Services, DE1201192420%Cornell Abraxas, Intensive Home Based, DE1111093128%Project Stay Free, Day Treatment, DE94853642%Providence Srv. Co., Home Based Srvc., DE79762634%Camelot, Shelter, DE36351543%Ministry of Caring, House of Joseph II, DEP.C.S., Family Support Program, DE19181418101.56%New Castle County D.C. Level III, DEDiversified Treatment Alt., Foster Care, DE71714057%0%1,5301,46043930%Level III Episodes5Since only 74 percent of the FY06 House of Joseph II cohort had been at-risk for 12 months at the end ofthe followup period the 12 month recidivism rate is not reported for this program.7
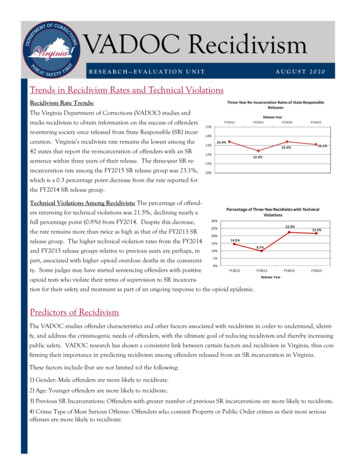
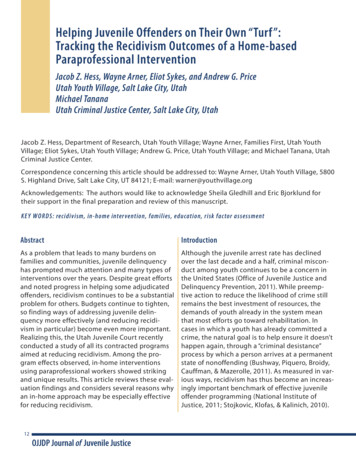
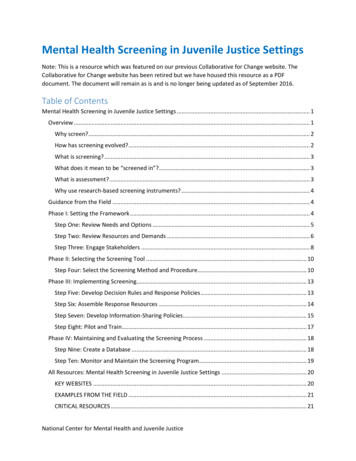
Different Measures of RecidivismMeasuring recidivism as a re-arrest or a re-admission is an important research and policyissue. It is preferable to measure recidivism using multiple measures where re-arresthighlights public safety risks to the community, re-detention underscores the court’swillingness to remove a juvenile arrestee from the community, at least temporarily, and reincarceration highlights the Family Court’s affirmation of guilt for a new crime.This study, at the request of policy makers in October 1998, assesses DYRS recidivism interms of felony re-arrest. This, it is believed, provides the possibility for a fairer crossjurisdictional comparison of recidivism rates. Re-detention information, although not used asan explicit recidivism measure, is reported as a part of the offender profile in this study. Thatis, the reader can compare the relationship between the average number of prior detentionepisodes for a specific release cohort and that cohort’s felony re-arrest rate. No information isprovided in this report regarding re-conviction because the data systems are notsystematically capable of providing this information. While the major purpose of this reportis to provide felony re-arrest recidivism rates for the 16,142 admission – release incidents thatwere tracked between July 2002 and June 2008 from DYRS Level III, Level IV and Level Vprograms and institutions, re-arrest information is also collected for misdemeanors andtechnical or administrative measures. This more extensive arrest information providesvaluable background information regarding juvenile crime patterns after release from DYRSprograms and institutions.Total Re-arrest PatternsThe pie charts below show FY06 re-arrest recidivism rates for released juveniles at-risk atleast 12 months. Three different types of recidivism are displayed in each of these graphs:(1) Recidivism where a felony arrest constitutes the most serious criminal activity afterrelease, and (2) where a misdemeanor arrest constitutes the most serious criminal event, and(3) violation of probation (VOP) arrests.Figure 1, Level V FY06 Re-arrest Recidivism 1 Year After Release, n 177Misdemeanor Arrest24%VOP Arrest5%No Arrest28%8Felony Arrest43%
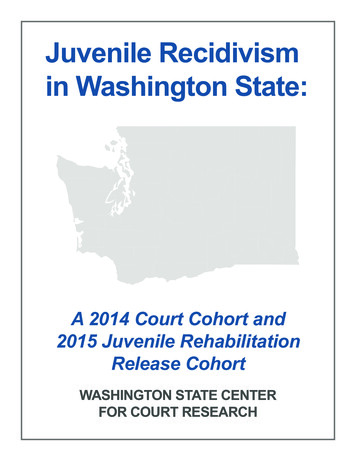
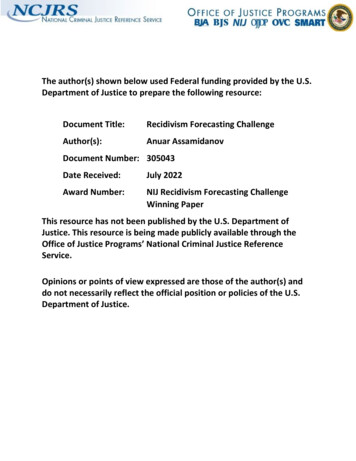
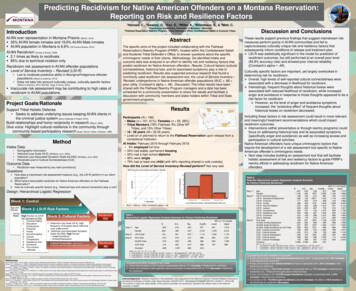
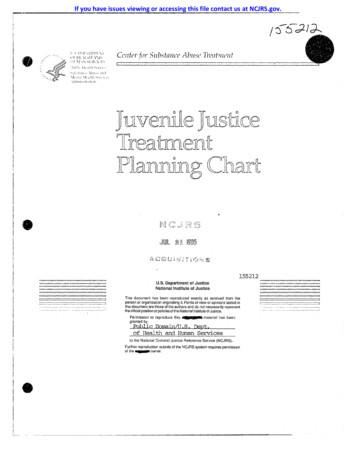
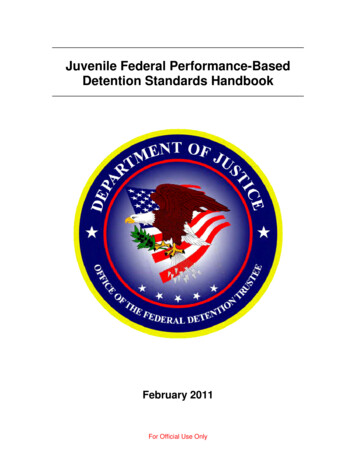
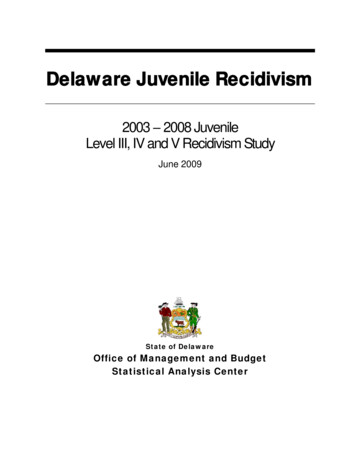
Figure 1 shows the recidivism patterns for the 177 FY06 releases from Level V placementepisodes who had been at-risk for at least one year. Seventy-two percent of the Level Vreleasees were re-arrested within one year. Forty-three percent had felony re-arrests, 24percent had re-arrests where a misdemeanor was the most serious charge, and another fivepercent were re-arrested only for violations of probation.Figure 2 shows the recidivism patterns for the 661 FY06 releases from a Level IV placementepisode who had been at risk for one year. Seventy-seven percent of the Level IV releaseeswere re-arrested within one year. Forty percent had felony re-arrests, 32 percent had rearrests where a misdemeanor was the most serious charge, and another five percent were rearrested only for violations of probation. When the full range of re-arrest recidivism isconsidered, there is little difference between youth released from a Level IV or V program.Figure 3 shows the recidivism patterns for the 1,460 FY06 releases from a Level IIIplacement episode who had been at risk for at least one year. Seventy-two percent of theLevel III releasees were re-arrested within one year. Thirty percent had felony re-arrests, 36percent had re-arrests where a misdemeanor was the most serious charge, and another sixpercent were re-arrested only for violations of probation. Level III releases were just as likelyto be re-arrested in the year following release from a program, but they were also less likelyto be re-arrested for a felony.Figure 2, Level IV FY06 Re-arrest Recidivism 1 Year After Release, n 661No Arrest23%VOP Arrest5%Felony Arrest40%Misdemeanor Arrest32%Figure 3, Level III FY06 Re-arrest Recidivism 1 Year After Release, n 1,460VOP Arrest6%No Arrest28%Felony Arrest30%Misdemeanor Arrest36%9
Comparing Misdemeanor Plus Felonyand Felony Only Recidivism RatesAnother perspective on recidivism is arrests for new crimes only. Proponents of thisperspective exclude arrests for violations of probation. Many violations of probation arrestsare closely associated with intensive supervision programs where juveniles are arrested, notfor breaking the law, but for violating the conditions of their sentencing orders, includingfailing to fully comply with the conditions of the intensive supervision program.In some situations, violations of probation, when added to the recidivism for new crimes canmake an intensive supervision program appear more punitive than it was designed to be. Forexample, the Serious Juvenile Offender program had 38 percent more technical arrests than asimilar group of delinquents that where not part of the program.6 Although some may viewan arrest for a violation of probation as less serious than an arrest for a new crime, an arrestfor a technical violation is just as likely to result in a re-incarceration as a felony arrest (70percent versus 71 percent) and much more likely to result in a re-incarceration than amisdemeanor arrest (70 percent versus 48 percent.)7 Therefore, while conceptually not asserious as a new crime, the impact of a technical violation arrest is just as significant as a newfelony arrest.Table 4, Delaware 12 Month Juvenile Recidivism Rates, shows that the reduction in felonyre-arrest recidivism was the same for Level IV and Level V programs. Between FY03 andFY06, the 12 month Level V felony re-arrest recidivism rate remained flat at 43 percent, withthe exception of FY04 when it spiked to 48 percent. During the same time period, the 12month Level IV felony re-arrest recidivism rate, decreased 28 percentage points – from 46percent to 30 percent. The Level V felony and misdemeanor recidivism rate fluctuated morethan the Level IV felony and misdemeanor during this period. Between FY03 and FY06, thereduction in felony and misdemeanor re-arrest rate was of nine eight percentage points forLevel V and two for Level IV.6710Delaware’s Serious Juvenile Offender Program, SAC, August 2004, p. 24.Ibid, p. 3.
Table 4, Delaware 12 Month Juvenile Recidivism Rates:A Comparison of Misdemeanor-Felony and Felony Arrest AnalysisLevelRelease CohortFelony AnalysisMisdemeanor and Felony AnalysisNumberNumberAt-RiskAt-RiskReleased 1 Year Arrested Rate Released 1 Year Arrested RateLevel IVFY 03FY 04FY 05FY vel VFY 03FY 04FY 05FY 19626122120219025020217783120877644%48%43%43%Note: Analysis excludes arrests for municipal ordinances, non-DUI related traffic offenses and technicalviolations.11
Technical Note: Measuring RecidivismThe FY09 Budget Act, 76 Del. Laws c. 280 § 215, authorizes the Delaware StatisticalAnalysis Center (SAC) with preparing this report. Juvenile justice policy makers requested inOctober 1998 that SAC assess DYRS recidivism in terms of felony re-arrests. Thus, in thisstudy recidivism is defined as a new felony arrest in Delaware. Recidivism is measured whena youth is arrested for a felony in Delaware after being released from a DYRS Level IV or Vplacement episode. Recidivism is reported as the percentage of persons released who are rearrested following release. Arrests for technical violations, misdemeanors, or traffic offensesnot related to driving under the influence or motor vehicle theft are not included in theremainder of this study.Traditionally, recidivism is measured from the date of release from an institution or aresidential placement. This measure is valid for systems that take youth from the street,incarcerate them, and then release them back to the stre
first service provided after leaving the adjudicated stay at a detention center as a means to define the level of the youths' stay at the detention center. If the youth went on to a Level V program, for instance the Ferris School, his detention center stay would be referred to as a Level V admission.