Transcription
The author(s) shown below used Federal funding provided by the U.S.Department of Justice to prepare the following resource:Document Title:Recidivism Forecasting ChallengeAuthor(s):Anuar AssamidanovDocument Number: 305043Date Received:July 2022Award Number:NIJ Recidivism Forecasting ChallengeWinning PaperThis resource has not been published by the U.S. Department ofJustice. This resource is being made publicly available through theOffice of Justice Programs’ National Criminal Justice ReferenceService.Opinions or points of view expressed are those of the author(s) anddo not necessarily reflect the official position or policies of the U.S.Department of Justice.
Recidivism Forecasting ChallengeProblem StatementAnuar AssamidanovThe Recidivism Challenge aims to improve the ability to forecast recidivism using personand place-based variables with the goal of improving outcomes for those serving acommunity supervision sentence. We hope through the Challenge to encourage discussion onthe topics of reentry, bias/fairness, measurement, and algorithm advancement. In addition tothe Challenge data provided, NIJ encourages contestants to consider a wide range of potentialsupplemental data sources that are available to community corrections agencies to enhancerisk determinations, including the incorporation of dynamic place-based factors along withthe common static and dynamic risk factors. NIJ is interested in models that accuratelyidentify risk for all individuals on community supervision. In order to do this, contestants willneed to present risk models that recognize gender specific differences and do not exacerbateracial bias that may exist.Under this Challenge, NIJ is providing a large sample accompanied with rich data amendablefor additional data to be paired with it. NIJ expects that new and more nuanced informationwill be gained from the Challenge and help address high recidivism among persons undercommunity supervision. Findings could directly impact the types of factors considered whenevaluating risk of recidivism and highlight the need to support people in specific areas relatedto reincarceration. Additionally, the Challenge could provide guidance on gender specificconsiderations and strategies to account for racial bias during risk assessment.The Challenge uses data from the State of Georgia about persons released from prison toparole supervision for the period January 1, 2013 through December 31, 2015. Contestantswill submit forecasts (percent likelihoods) of whether individuals in the dataset recidivatedwithin one year, two years, or three years after release.This resource was prepared by the author(s) using Federal funds provided by the U.S.Department of Justice. Opinions or points of view expressed are those of the author(s) and do notnecessarily reflect the official position or policies of the U.S. Department of Justice.
Project OverviewIn this project, I analyzed and predicted the likelihood of recidivism using profile data. Toaccomplish that, I performed Logistic regression, Random Forest Classifier, XGBoost,LightGBM, and Catboost algorithms and evaluated performance. I divided the project intosix main parts. I went through the Exploratory Data Analysis, Feature Engineering, ModelBuilding, Model Evaluation, Feature Importance, and Inference.Exploratory Data AnalysisThe dataset has 53 columns and 18028 rows. The data includes individual- and place-basedvariables that capture the supervision case information, prison case information, priorGeorgia criminal history, prior Georgia community supervision history, Georgia board ofpardons and paroles conditions of supervision, and supervision activities. The columns in thedata are deemed to be a proxy for the already-established profile of respondents. They can beused to accentuate the salience of person-based and place-based recidivism forecasting.Our primary outcome variable is recidivism. The table below shows the percentage andnumber of recidivated people in the sample of the 18028 population. It occurs the percentdecreases by each year from 29.8 to 19 percent. Overall, within three years, 57.9% arerecidivated.This resource was prepared by the author(s) using Federal funds provided by the U.S.Department of Justice. Opinions or points of view expressed are those of the author(s) and do notnecessarily reflect the official position or policies of the U.S. Department of Justice.
Recidivism Year 1Recidivism Year 2Recidivism Year 3Overall5377 (29.8%)3253 (25.7%)1791 (19%)10421 (57.9%)Male4920 (31.1%)2889 (26.5%)1601 (20%)9410 (59.5%)Female457 (20.6%)364 (20.7%)190 (13.6%)1011 (45.6%)Black3198 (31%)1830 (25.7%)1048 (19.8%)6076 (58.9%)White2179 (28.2%)1423 (25.7%)743 (18.1%)4345 (56.3%)Total Number of1802812651939818028Number ofRecidivatedPeople/PercentageObservationTable 1. Descriptive Statistics of the dataI divide the table into gender and race categories to see how the recidivism varies on thosevariables of interest. It occurs that the male population is substantially higher than the female.Recidivism rate conditioning on gender differs 11-7% each year, meaning that the malepopulation tends to re-offend more than the female population. Furthermore, the number ofblack populations recidivated is higher than the white population. However, the percentage ofrecidivism with race category has almost the same value in each year. To sum up, we can seethat recidivism within three years exceeds 40% for each variable in Table 1.Feature EngineeringIn this part, I will explain how I extracted features from raw data, potentially improving theperformance of machine learning algorithms. Overall, in this project, I did not find thatfeature engineering produces substantial improvement in the results, meaning that the powerof model learning and extracting insight was better than the human manipulation of the data.I have done all feature engineering to deal with missing data, converting booleans intointegers, converting categorical variables into a dummy, and converting decimals intointegers.This resource was prepared by the author(s) using Federal funds provided by the U.S.Department of Justice. Opinions or points of view expressed are those of the author(s) and do notnecessarily reflect the official position or policies of the U.S. Department of Justice.
Initially, I converted the outcome variables into a dummy variable. It will transform ourresearch question into the likelihood of recidivism based on the given variables. This dummytransformation gives us a great opportunity to effectively apply classification algorithms likeLogistic Regression, Random Forest, Gradient Boosting, Neural Networks, etc.Regarding missing values, to my knowledge, lightGBM and CatBoost will ignore missingvalues during a split, then allocate them to whichever side reduces the loss the most.However, for other models, manually dealing with missing values improved modelperformance. It seems like if I set missing values to -99, it produces the best results. I did notsee any improvement in imputing missing values to mean, median, or model.ModelIn this part I will briefly explain the machine learning model that I used in this project.Logistic RegressionLogistic Regression is a transformation of a linear regression using the sigmoid function. Thevertical axis stands for the probability for a given classification and the horizontal axis is thevalue of x. It assumes that the distribution of y x is Bernoulli distribution. (1)Random ForestRandom forest is a supervised learning algorithm. The "forest" it builds, is an ensemble ofdecision trees, usually trained with the “bagging” method. The general idea of the baggingmethod is that a combination of learning models increases the overall result. (2)XgboostXGBoost is an optimized distributed gradient boosting library designed to be highly efficient,flexible and portable. It implements machine learning algorithms under the GradientBoosting framework. XGBoost provides a parallel tree boosting (also known as GBDT,GBM) that solve many data science problems in a fast and accurate way. (3)LightGBMThis resource was prepared by the author(s) using Federal funds provided by the U.S.Department of Justice. Opinions or points of view expressed are those of the author(s) and do notnecessarily reflect the official position or policies of the U.S. Department of Justice.
LightGBM is a gradient boosting framework that uses tree-based learning algorithms. It isdesigned to be distributed and efficient with the following advantages: Faster training speedand higher efficiency, Lower memory usage, and Better accuracy, Support of parallel,distributed, and GPU learning, and Capable of handling large-scale data. (4)CatboostCatBoost is an algorithm for gradient boosting on decision trees. It is developed by Yandexresearchers and engineers, and is used for search, recommendation systems, personalassistant, self-driving cars, weather prediction and many other tasks at Yandex and in othercompanies, including CERN, Cloudflare, Careem taxi. It is in open-source and can be usedby anyone. (5)Model BuildingIn this section, I will use the prediction of the third year as a case study to explain how Iapproached this project. So, the outcome variable is the recidivism of the respondent afterthree years post-incarceration. I built several machine learning models and analyzed theirresults.I start with the most basic, a logistic regression, which predicts the likelihood of recidivism.Logistic regression would serve as our baseline. Following that, I have performed RandomForest Classifier, Xgboost, LightGBM, and Catboost algorithms. To evaluate training setperformance, I have implemented Stratified K-fold Cross-Validation Method. This techniqueis a variation of KFold that returns stratified folds. Since there are many categorical variablesin our data, the folds preserve the percentage of samples for each categorical variable.To boost the performance of the algorithms, I have implemented a hyperparameter tuningexercise. I applied the grid search method, which is a process that searches exhaustivelythrough a manually specified subset of the hyperparameter space of the given algorithm. Iused the "pruning" technique to stop training earlier when the learning curve was much worseThis resource was prepared by the author(s) using Federal funds provided by the U.S.Department of Justice. Opinions or points of view expressed are those of the author(s) and do notnecessarily reflect the official position or policies of the U.S. Department of Justice.
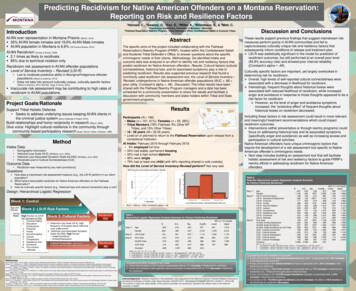
than the best-known result. The algorithm selected parameters based on the ROC-AUCevaluation metrics. I gathered models with optimized hyperparameters into an array. Overall,I have made 19 models: one Logistic regression, three Random Forest Classifiers, and fiveLightGbm, Xgboost, and Catboost.I incorporated these models to make one generalized prediction called the stacking method.Stacking is a way of combining multiple models that introduces the concept of a meta learner(6). This classifier fits base classifiers, each on random subsets of the original dataset, andthen aggregates their predictions to form a final prediction (either by voting or by averaging).The point of stacking is to explore a space of different models for the same problem. The ideais that you can attack a learning problem with varying types of models capable of learningsome part of the problem but not the whole space. So you can build multiple differentlearners and use them to make an intermediate prediction, one prediction for each learnedmodel. Then you add a new model which learns from the intermediate predictions the sametarget. This final model is said to be stacked on top of the others, hence the name. Thus, youmight improve your overall performance, and often you end up with a model which is betterthan any individual intermediate model (7). The main takeaway from all these steps is tocreate a generalized outcome that will not overfit your training set.I split the original dataset into a Training and Holdout dataset. Let training go onwards intothe upcoming loop and save holdout until the last part in the forthcoming loop. I made a forloop with KFold Cross-Validation where k 5. In each iteration, I split the Training datasetinto training and validation datasets. I called them X train, y train, X valid, and y valid.The red parts in Figure 1 represent X train and y train, while the green represents X validand y valid. I trained the current model on X train and y train.I made predictions on the test dataset X valid and evaluate it with the y valid. I extended anarray of the predictions for the whole training dataset. I called them out of sampleThis resource was prepared by the author(s) using Federal funds provided by the U.S.Department of Justice. Opinions or points of view expressed are those of the author(s) and do notnecessarily reflect the official position or policies of the U.S. Department of Justice.
predictions. I run these out of sample predictions for all algorithms stated above. Eventually,I got 19 out of the sample predicted arrays. I used them as new features for the new trainingdataset composed of 19 features and outcome variables. Then, I run Ridge Regression topredicted based on these input variables. I also did the Kfold cross-validation technique thesame as above, but I run a fitted model on the Holdout dataset. I have chosen five folds andcreated five predicted outcome variables from the holdout dataset. After that, I took a meanof these five predicted outcome variables, my final predicted recidivism probability.Figure 1. The illustration of K-Fold Cross Validation and Stacking methodModel EvaluationTo achieve a decent score and find out the best hyperparameters, I run an overall 16015 trialsusing the cutting-edge Python Library of Optuna. Then, I have chosen the best one fromLogistic Regression, three from Random Forest, and five from LightGBM, CatBoost, andThis resource was prepared by the author(s) using Federal funds provided by the U.S.Department of Justice. Opinions or points of view expressed are those of the author(s) and do notnecessarily reflect the official position or policies of the U.S. Department of Justice.
XGboost. The decision from the chosen numbers comes from personal experience workingwith these algorithms.In this part, I would like to explain the results of each model and what score I got. FromTable 2, we can see that the best performance comes from CatBoost. From my observation, Inoticed that fairness and accuracy results are highly correlated with the AUC score.Therefore, we can rely on the AUC score, which comes with each algorithm in PythonLibrary.Model IModel IIModelModel IVModel VTrialsIIILogistic Regression0.66815Random Forest0.6810.6801LightGBM0.6819220.681967 0.682350 0.6824530.682980500CatBoost0.7089760.708665 0.703801 8040.68791000.6875Table 2. AUC result of the algorithmsAs I previously mentioned, I choose all of these algorithms out of sample results to run theStacking method. From this method, we can see that overall it is lower than the bestperforming Catboost method. Assuming stacking will take the best part of each algorithm andperforms generalized result, I have chosen to stack as my outcome.Fold IStackingFold II0.6843 0.6956Fold IIIFold IV Fold V0.70040.7126Overall Metrics0.70731 0.6996Table 3. AUC score of Stacking MethodThis resource was prepared by the author(s) using Federal funds provided by the U.S.Department of Justice. Opinions or points of view expressed are those of the author(s) and do notnecessarily reflect the official position or policies of the U.S. Department of Justice.
InferenceFeature IFeature IIFeature IIIFeature IVFeature VLogisticAge at ReleaseAge atGang AffiliatedAge at Release 43-47Age at ReleaseRegression18-22Release 48 or23-27olderRandomJobs Per YearPercent DaysAvg Days per DrugPrior Arrest Episodes PPSupervision RiskEmployedTestViolation ChargesScore FirstAvg Days perJobs PerPercent DaysSupervision Risk ScoreResidenceDrug TestYearEmployedFirstPUMAJobs Per YearAvg DaysPercent DaysAge at ReleaseSupervision Riskper DrugEmployedForestLightGBMCatBoostScore FirstTestXGBoostPrior Arrest ppGangPrior ConvictionviolationAffiliatedEpisodes MisdViolation InstructionPrior ArrestEpisodes MisdChargesTable 4. AUC result of the algorithmsIn this part, I would like to go over the feature importance analysis. According to the table,we can see that each model has its own top five most important features. Feature importanceis determined by a mean decrease in impurity for decision tree-based models and logs oddcoefficients for Logistic Regression. As we can see, the LightGBM and CatBoost have moresimilarities in features, but the order is not the same. Since the core base of these models isgradient boosting techniques, thus AUC scores are also close.Furthermore, Logistic Regression has completely different features, which is reasonable sinceit has low predictability than the gradient boosting techniques. As can be seen from Table 4,job-related variables like the number of jobs per year and percent days employed have theThis resource was prepared by the author(s) using Federal funds provided by the U.S.Department of Justice. Opinions or points of view expressed are those of the author(s) and do notnecessarily reflect the official position or policies of the U.S. Department of Justice.
highest correlation. The idea comes together with Kevin Schnepel (2018) where he examines“good jobs” and asks how their presence influences recidivism. Prior criminal history recordssuch as prior misdemeanor and violation charges have shown high importance in theXGboost model. Average Days on Parole Between Drug Tests tend to be helpful to achievegood predictability in Catboost and LightGBM. Overall, the main take from these models isthese features are highly correlated with the outcome variable of recidivism.This resource was prepared by the author(s) using Federal funds provided by the U.S.Department of Justice. Opinions or points of view expressed are those of the author(s) and do notnecessarily reflect the official position or policies of the U.S. Department of Justice.
Reference1. Sigmoid Function - an overview ScienceDirect er-science/sigmoid-function2. Random Forest Algorithms: A Complete Guide Built algorithm3. XGBoost Documentation — xgboost 1.5.0-dev documentation.https://xgboost.readthedocs.io/4. Welcome to LightGBM’s documentation! — LightGBM 3.2.1.99 tml5. CatBoost - open-source gradient boosting library. http://catboost.ai/6. Ensemble Methods. Essential Machine Learning Concepts to methods-b644f9c94bc17. Stacking in Machine Learning - ng-in-machine-learning/8. Good Jobs and Recidivism - Kevin -GoodJobsRecidivism-paper-6This resource was prepared by the author(s) using Federal funds provided by the U.S.Department of Justice. Opinions or points of view expressed are those of the author(s) and do notnecessarily reflect the official position or policies of the U.S. Department of Justice.
Recidivism Forecasting Challenge . Anuar Assamidanov. Problem Statement . The Recidivism Challenge aims to improve the ability to forecast recidivism using person- and place-based variables with the goal of improving outcomes for those serving a community supervision sentence. We hope through the Challenge to encourage discussion on