Transcription
Juvenile Recidivismin Washington State:A 2014 Court Cohort and2015 Juvenile RehabilitationRelease CohortWASHINGTON STATE CENTERFOR COURT RESEARCH
SUMMARY OF FINDINGSThis is the second juvenile recidivism report for Washington State, using a court and JuvenileRehabilitation (JR) cohort. The results are relatively consistent with the previous report’sfindings. For this report, the overall recidivism rates were 30.3% for the court cohort andjust under fifty percent (49.6%) for the JR release cohort. The court rate was slightly higherthan in the previous report (28.1%) and lower for the JR release cohort (54.3%). Some ofthat difference comes from data development that occurred between the two reports, but therecidivism rates did change outside of data quality improvements. There are several possiblereasons for these changes in recidivism levels, but we believe they are within the realm ofnormal, year-to-year fluctuations. We will know more as future analyses are completed andbaselines and trends can be identified.There are differences in recidivism rates among the different study cohorts. Juvenile recidivismrates are higher for the groups with more severe case dispositions and sanctions: JR releasecohorts (49.6%), adjudicated court case cohorts (44.0%), and diverted court case cohorts(21.7%). This report does not attempt to say case dispositions and sanctions cause recidivism.The decisions behind sanctioning and dispositions do not occur in a vacuum. The relationshipbetween past offending and criminal sanctioning on current offenses has been identified inprevious research (Durham III, 1987). This is consistent with the stated aims and objectives ofcriminal justice institutions at both the federal and state level (USSC, 2016; Washington CFC,2016), as well as previous court rulings (Kent v. U.S., 1966). So, those who have committedserious offenses or have a record of prior crimes are more likely to receive more severe casedispositions and then are more likely to commit future offenses.In addition to sanction or case disposition, demographic factors were associated with higherrecidivism rates. Males demonstrated higher rates of recidivism, relative to females. Thisfinding is consistent with the previous report and other research (Durose, Snyder, & Cooper,2015; FBI, 2015; Hunt and Dumville, 2016).Analysis of age at first disposition showed, generally, that the younger a person was at theirfirst disposition, the more likely they were to recidivate. This finding, especially among thecourt cohorts, was also consistent with the previous report and other recidivism scholarship(Blumstein, Farrington, and Moitra, 1985; Farrington and Hawkins, 1991; Moffitt, 1993). In thisreport, the relationship between recidivism and age at first disposition was not as consistentin the JR release cohort. This may be explained by the demographic and prior dispositiondifferences between the JR and court cohorts, as well as the relatively small number in each ofthe JR cohort age groups.One issue is that the “Washington standard” recidivism definition developed by the WashingtonState Institute for Public Policy requires a minimum of 30 months to complete the follow-upperiod, comprised of 18 months of “street time” plus 12 months for court processing. To reducethat lag period and allow us to compare Washington’s rates to those in neighboring states, weadded a new recidivism metric: an offense committed within one year of the beginning of thefollow-up period that results in a referral or petition filed in court.1
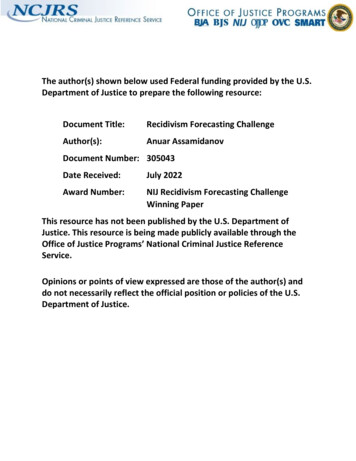
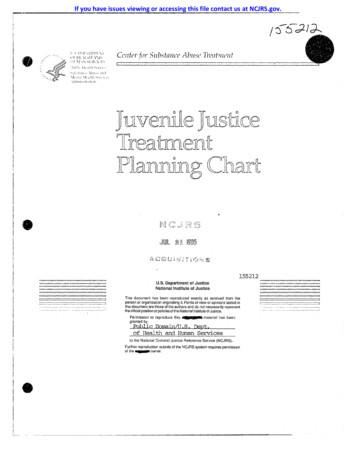
Exhibit 1Comparative RecidivismRatesState12 month hington30.4%32.1%Arizona33.4%The 12-month referral recidivism rate in Washington Statewas 32.1% for juveniles who received a disposition in2014. This is relatively similar, but slightly worse thanseveral nearby states around that same time period. InOregon, juvenile recidivism was 27.4% after 12 monthsof follow-up.1 Other reports have indicated the 12-monthrecidivism rates in Colorado, Idaho, and Arizona were28.7%, 30.4%, and 33.4%, respectively.2 It is difficult isto compare outcomes from other states as there may bedifferences in study populations and research definitionsand methodologies. Nonetheless, these examplessuggest Washington State is about as, but not more,successful as other states at preventing juvenile recidivism.While we believe this study provides an accurate, informative, and relevant picture of the stateof recidivism among juvenile offenders in Washington State, there is room for improvement.In the next report we hope to incorporate additional explanatory variables into the analysisto provide deeper insight into the court and JR populations, their recidivism, and possibleexplanations for these outcomes.How to InterpretWe recommend that courts and stakeholders examine trends, rather than particular years, asindividual years can be anomalous due to variances in the population or study cohort, structuralchanges to laws, changes to court-related practices, or some combination of all of those factors.County-level Analysis Counties with smaller numbers of youth disposed in their courts are more likely to seelarger variations in recidivism rates from year to year. Looking at several years together will help to identify the range of “normal” as well astrends over time.Inter-state Comparisons Inter-state comparisons are complicated by different ways states define and measurerecidivism (Yu, 2014). Most states look only at juveniles released from custody, as opposed to all courtinvolved youth. This approach misses the majority of court-involved juveniles. Washington State has sufficient data and inter-agency cooperation to accomplish thismore ambitious h.gov/audit/14 09rpt.pdf
INTRODUCTIONIn 2018 we published the first Washington State juvenile recidivism study in more than adecade. We aim to continue to update and publish these reports and examine trends, usingcohorts of youth that receive a diversion or adjudication from the courts or are released froma JR facility. Our goal is to provide information to policymakers, juvenile justice stakeholders,researchers, and the general public relative to juvenile justice system performance and possibleareas for intervention.For this study, we followed a cohort of youth that received a court disposition during CY2014and another cohort of youth that were released from a JR facility during CY2015. To betterunderstand different groups of youth, we look at overall recidivism rates, as well as recidivismrates depending upon the type of disposition that the individual received (diversion oradjudication). We also tested for potential associations, such as race/ethnicity, gender, and age,among youth with different dispositions and recidivism.DATA AND METHODSThe qualifying event for inclusion in the court cohort was the first criminal justice cycle3 for whichan individual received a disposition during 2014; for the JR cohort, it was an individual’s firstrelease from JR during 2015.4 Only the most serious disposed charge tied to the 2014 courtdisposition or the 2015 JR release was counted. For youth with more than one court dispositionduring 2014 or more than one JR release during 2015, the first disposition or release qualifiedthem for the study and all follow-up periods are based upon that date. The follow-up periodincludes offenses that may have occurred after the youth had reached the age of majorityand was sentenced as an adult. However, cases where juveniles are tried as adults are notincluded in the court cohort, as those instances often involve long periods of incarceration, arecomparatively few in number, and it is sometimes difficult to track individuals from juvenile toadult custody.Court records came from the Administrative Office of the Courts and JR provided admission andrelease records. We also examined juvenile detention records, obtained from the state’s juveniledetention centers, to calculate whether individuals met the minimum duration of street time forthe follow up period.With access to the youth’s complete Washington court history, we examined the relationshipbetween recidivism and both demographic variables and prior misdemeanor and felonydispositions. We also included records of prior incarceration in the analyses.5 Measures of aprior incarceration included, detention prior to the qualifying offense, pretrial detention relatedto the qualifying offense, and prior incarcerations at a JR facility. Differences in prosecutionand sentencing practices for past and current offenses can result in youth with similar qualifyingoffenses, demographics, and prior misdemeanor and felony dispositions, receiving disparatepunishments. In some cases, prosecution and sentencing differences can send one youthA criminal justice cycle pertains to the period around an offense with a disposition. As such, we filter out multiplecharges with the same case number, offense date, and adjudication date, to not over-count the number of offensescommitted by an individual.4The first disposition of the calendar was taken for each disposition cohort. There were a number of individuals whohad both an adjudication and diversion in the same year, so those categories are not exclusive.5The AOC receives detention data from public juvenile detention centers across the state. They do not receiveregular data from the sole private detention center, Martin Hall. They are also limited in historical detention data, assome public detention centers only began reporting to the AOC more recently.33
to incarceration while a similar youth receives a non-custodial sentence. Our aim is not toanswer those larger questions, but to identify correlations between recidivism and both thedemographic variables and prior misdemeanor and felony disposition variables we do have, sothat areas for further inquiry can be identified.Time spent in JR and local detention was deducted from the interval between the youth’sadjudication date and the date of the most recent data available to us. Only individuals with theminimum follow-up period (18 months)6 of street time were included in the study.We divided our analyses into categories, depending on the qualifying case outcome - alldispositions (convictions, deferrals, and diversions), adjudications only (convictions anddeferrals), and diversions only.7 As indicated below, only some analyses include the JR releasecohort due to multiple factors, including a lack of a consistent case-related identifier between JRand court data, which prevented connecting the JR release cohort to the original disposition.8STUDY POPULATIONIn the following tables, differences in gender, race, age, and qualifying offense are evidentbetween the disposition, adjudication, diversion, and JR release cohorts.Gender, Race/Ethnicity, and AgeThe gender gap varies greatly across the various cohorts from 67.3% male among dispositions,74.6% among adjudications, 62.2% among diversions, and 87.3% among the JR release cohort.The mean age only moves 0.4 years among the court cohorts, it jumps almost a full year withthe JR release cohort. This is not surprising as the JR release cohort has served a sentencesince their court adjudication.9 Notable differences in racial/ethnic percentages across cohortsappeared with White youth, who were 60.5% of the diversion cohort but 51.8% of the JR releasecohort. In contrast, Black youth were 10.1% of the diversion cohort but 18.7% of the JR releasecohort.For the court cohorts, the recidivism clock began on their disposition date. For the JR release cohort it began onthe date of their residential release. For most of the report, recidivism was defined as an offense that occurredwithin eighteen months of their disposition (local) or residential release (JR), and that resulted in an adjudication orconviction within twelve months of the offense date. We also include one table where recidivism was defined as areferral or petition filed within 12 months of their disposition (local) or residential release (JR).7Please note that some individuals received multiple dispositions in the same year. The first offense for each of thethree categories (disposition, adjudication, and diversion) was captured. Therefore, the same individual may appearin multiple categories, if they had multiple offenses resulting in different dispositions during the year.8From past analysis we know that the majority come from adjudications for felony charges, along with revocations fordisposition alternatives or juveniles with extensive criminal histories.9The average JR sentence is 10.4 months in length.64
Exhibit 2Population Demographics: Gender, Race/Ethnicity, and AgeAll Dispositions(N cAsian/Pacific IslanderAmerican Indian/Native AlaskanAgeAge 10Age 11Age 12Age 13Age 14Age 15Age 16Age 17Mean AgeDiversions(N 6,892)Adjudications(N 4,889)JR ReleaseCohort (N .215.9Qualifying OffenseQualifying offense also varied across the cohorts. For example, 1.4% of diversions came fromfelony cases in contrast to 36.9% of adjudications. Adjudications are considered more severedispositions than diversions, so it is expected that there would be more adjudications associatedwith felony cases. Property offenses are the most common offense across all disposition types.Exhibit 3Population Demographics: Most Serious Qualifying OffenseTotal MisdemeanorsOther MisdemeanorAlcohol/Drug MisdemeanorProperty MisdemeanorAssault MisdemeanorTotal FeloniesOther FelonyDrug FelonyProperty FelonyNon-Violent Person FelonyViolent Person FelonyAll Dispositions(N N 951.450.1140.2610.970.180.1Adjudications(N 336.91400.71543.180116.2783.36300.136 of the 11,312 individuals with a disposition in 2014 had an “X” designation or were missing information related totheir gender.11Race is derived using AOC data where the youth’s race is recorded by the police or court and bi-racial andmulti-racial were not options in 2014. 95 of the 11,312 individuals with a disposition in 2014 were missinginformation related to their race and/or ethnicity.105
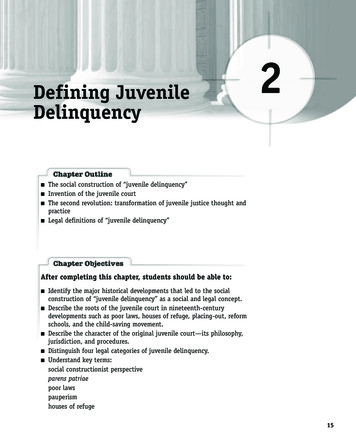
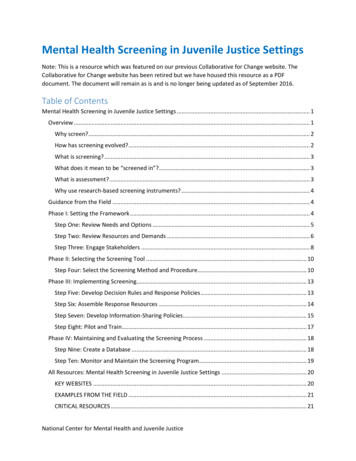
Age at First OffenseFinally, age at first disposition also varied across the cohorts. The most frequent age of firstdisposition for the JR release cohort was 13, but 14 for adjudications, 15 for all dispositions,and 16 for the diversion cohort. This observation is consistent with expected findings. Severalcriminological studies have identified a relationship between early age of onset for criminalbehavior and longer and more severe criminal acts and careers (Blumstein, et. al., 1986; Elliot,1994; Farrington, et. al., 1990; Tracy and Kempf-Leonard, 1996; Wolfgang, 1972).Exhibit 4Population Demographics: Age at First Offense byCase Disposition or JR Release Cohort30.0%Age 8Age 9Age 10Age 11Age 12Age 13Age 14Age 15Age 16Age 1725.0%20.0%15.0%10.0%5.0%0.0%All DispositionsAdjudications OnlyDiversions OnlyJR Release CohortCountyOne of the most noticeable results regarding the study population comes from the differencesin case dispositions among the Washington State counties. Diversions make up the majorityof case dispositions, with approximately 1.4 times as many diversions as adjudications in thisstudy. Among those counties with at least 100 total dispositions, eight counties had a ratio of atleast 1.5 adjudications for every diversion or vice versa. Adams, Benton/Franklin, Grays Harbor,Pierce, Skagit, Snohomish, Spokane, and Whatcom all had a ratio of at least 1.5 diversions forevery adjudication. Conversely, no counties had more than 100 dispositions and at least 1.5adjudications for every diversion.6
Exhibit 5Population Demographics: County12All Dispositions(N lallamClarkCowlitzDouglasFerryGrantGrays wisLincolnMasonOkanoganPacific/WahkiakumPend OreillePierceSan alla 0619270331,1265586563118940239732%Diversions(N cations(N 499637-520-90143692123733810416224348%JR ReleaseCohort (N -2.1-5.27.1-5.42.62.6-7.1Fields with fewer than 10 subjects are omitted to protect confidentiality.7
RECIDIVISM RESULTSThe analyses examine a variety of demographic, offense, and court factors related to the studypopulation and the outcomes analysis. Some clear trends appear below. As noted above,due to difficulties linking JR admissions to qualifying offenses, those analyses based upon aqualifying disposition, prior misdemeanor and felony dispositions, or previous incarcerations donot include the JR release cohort.RecidivismThe most consistent trend was that recidivism rates increased along with the severity of thedisposition - diversions to adjudications to all dispositions to the JR release cohort. Thiswas true regardless of the demographic, prior misdemeanor and felony dispositions, orqualifying offense variable used to filter the results or the type of recidivism measured (overall,misdemeanor, felony, or violent felony).13 All tables after the recidivism outcomes table includeonly statistics for felony and all recidivism.The most inclusive category, all dispositions, had an overall recidivism rate of 30.3% and afelony recidivism rate of 11.3%. The adjudication cohort saw higher rates (44.0% and 20.3%),while the diversion cohort saw lower rates of recidivism (21.7% and 5.4%, respectively). Therecidivism rate for adjudications was at least 2.0 times higher than the diversions recidivism rate,for almost all types of recidivism measured.It is important to note that the 30.3% recidivism rate is a slight increase over last year’s 28.1%figure. It is unclear, at this point, whether this increase is part of a longer term trend or a normalvariation in recidivism rates that will occur from year to year. That answer will become clearer insubsequent reports, as we have more data to analyze.Exhibit 6Recidivism OutcomesAll Dispositions(%)All RecidivismMisdemeanorRecidivismFelony RecidivismViolent 1.744.0JR 44.01.77.39.2Felony recidivism includes any felony offense that occurs after the qualifying adjudication and meets the otherelements of recidivism as defined on p. 3 of this report. Violent felony recidivism includes any assault felony, violentproperty felony except for extortion, robbery-kidnap felony, rape or sexual assault felony, or homicide that occursafter the qualifying adjudication and meets the other elements of recidivism as defined on p. 3 of this report.138
GenderFor both felony and all recidivism categories, males recidivated more than females across allthe court cohorts. Gender had one of the strongest and most consistent patterns of recidivismamong the various factors analyzed. Felony recidivism rates among males were 1.8 to 2.3 timeshigher than those of females across the different court cohorts. The differences between the allrecidivism rates for males and females is higher than that of the felony recidivism rates, whichindicates that males are more likely than females to recidivate with a misdemeanor or felony.Exhibit 7Recidivism Outcomes by GenderMalesFemalesAllDispositions(%)33.723.3All 838.6JR(%)52.231.9AllDispositions(%)13.86.2Felony 2.8JR(%)26.211.6RaceThe relationship between race and recidivism rates is fairly consistent across types of recidivismand different dispositions. Black youth had elevated recidivism rates for the court and JR releasecohorts. Asians and Pacific Islanders had the lowest all recidivism rates for all dispositions anddiverted youth. Relative recidivism rates for Hispanic youth varied across the different courtand JR cohorts. Across racial and ethnic groups, White youth were comparatively less likely toexperience a new felony disposition in the 18 months following their disposition.Exhibit 8Recidivism Outcomes by Race14All Felony --36.921.953.951.117.34.929.719.2JR(%)JR(%)Fields with fewer than 30 subjects are omitted as to not provide potentially skewed or misleading statistics.9
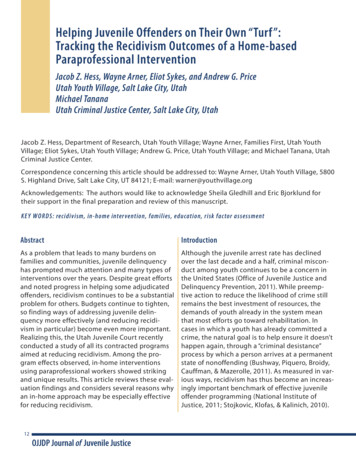
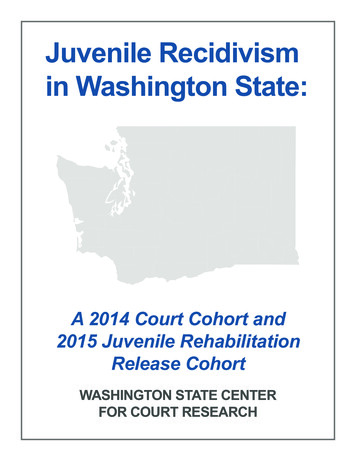
Age at Qualifying OffenseThe court cohorts show a relatively consistent trend across all and felony recidivism.15 Foradjudications and all dispositions, recidivism rates increase until age 13 or 14 and thendecrease until age 17. The diversion cohort’s recidivism rates, across both felony and allrecidivism, appear to peak around age 12 and then fall. For all the court cohorts, the recidivismrates for 15, 16, and 17 year olds are lower than for those younger.Exhibit 9Recidivism Outcomes by Age at Qualifying Disposition16Age 10Age 11Age 12Age 13Age 14Age 15Age 16Age ll .6Adjudications(%)--47.149.152.547.441.837.5Felony RecidivismAllDispositions Diversions 24.413.27.723.312.15.921.511.14.519.79.52.617.4Age at First DispositionAlmost all disposition groups have their highest recidivism rates in either the first or secondage group listed, then show a consistent decrease in recidivism as the age at first dispositionincreases. In some instances, the decrease was dramatic, with all recidivism adjudicationdecreasing from 57.5% for those with a first disposition at age 11 to 26.5% for those with theirfirst disposition at age 17. The JR release cohort did not demonstrate the same patterns as thecourt cohort, with the felony recidivism category showing a similar rate of increase from age 12(22.6%) to age 16 (22.9%). However, the court cohorts follow similar patterns to the previoustable. The recidivism rates peak early (age 11 or 12) and are at half or less the peak rate, forthose whose first offense occurred at age 17. The JR release cohort all recidivism rates do notfall as consistently, nor do they fall by 50% or more from peak rates for the age 16 year olds.However, they do substantially fall from peak rates for those that commit their first offense laterin life.The JR cohort was not included in this analysis because of issues identifying the offense that resulted in the JRcommitment. As such, the age at qualifying offense could not be calculated.16Fields with fewer than 30 subjects are omitted as to not provide potentially skewed or misleading statistics.1510
Exhibit 10Recidivism Outcomes by Age at First Disposition17All RecidivismAge 10Age 11Age 12Age 13Age 14Age 15Age 16Age ony 2.9--Prior Misdemeanor and Felony DispositionsConsistently, the likelihood of recidivism increases with the quantity and severity of priormisdemeanor and felony dispositions. The pattern appears in all disposition cohorts forboth felony and all recidivism groups. Felony recidivism rates among those with prior felonydispositions ranged from 2.2 to 4.6 times higher than felony recidivism rates for those with noprior misdemeanor or felony dispositions. Percentage-wise the greatest increase was in felonyrecidivism rates from all dispositions with no prior misdemeanor or felony dispositions (7.0%) toall dispositions with prior felony dispositions (32.1%).Exhibit 11Recidivism Outcomes by Prior Misdemeanors and Felony Dispositions18All Recidivism1718Diversions(%)23.3Felony 9.420.18.922.5Prior Felony Disposition54.142.654.632.120.432.7Prior Violent FelonyDisposition49.2--48.830.0--30.0No Prior Misdemeanor orFelony DispositionsPrior MisdemeanorDispositionAllDispositions(%)Fields with fewer than 30 subjects are omitted as to not provide potentially skewed or misleading statistics.Fields with fewer than 30 subjects are omitted as to not provide potentially skewed or misleading statistics.11
Previous IncarcerationsThere appears to be a clear relationship between the type of previous incarceration and therecidivism rate. Those with any kind of prior incarceration (qualifying offense pretrial detention,previous offense detentions, or previous JR admissions) had higher recidivism rates than thosewithout any incarcerations and those with a prior JR admission had higher recidivism ratesthan those that had been only in detention across all types of recidivism.19 Felony recidivismrates among those with a prior detention stay ranged from 2.0 to 3.6 times higher than felonyrecidivism rates for those with no prior incarcerations.Exhibit 12Recidivism Outcomes by Incarceration History20All RecidivismFelony lDispositionsDiversionsAdjudicationsNo Prior Incarcerations20.018.726.95.34.39.9Qualifying Offense PretrialDetention43.230.850.019.18.624.2Prior Offense Detention Stays42.631.049.018.48.723.1Any Prior JR Stays60.9--60.547.0--46.4Further examinations of the data reveal consistencies in the relationship between previousincarcerations and recidivism. The table below presents recidivism rates based uponprevious incarceration history for those individuals whose qualifying offense was a propertymisdemeanor.21 The majority of instances find recidivism rates for property misdemeanants tobe within a few percentage points of the overall cohort and the pattern of changes in recidivismrates remains consistent. Those with a prior JR admission had higher rates than those with aprior detention admission and those with no prior incarcerations had the lowest recidivism rates.Exhibit 13Recidivism Outcomes for Property Misdemeanants by Incarceration History22All RecidivismNo Prior IncarcerationsInstant Offense PretrialDetentionPrior OffenseDetention StaysAny Prior JR StaysAllDispositionsDiversions17.8Felony .644.431.853.817.19.423.370.6--69.849.0--45.8The JR cohort was not included in this analysis because of issues identifying the offense that resulted in the JRcommitment and classifying detention episodes accurately.20Fields with fewer than 30 subjects are omitted as to not provide potentially skewed or misleading statistics. Also, theone youth may be included in more than one of the prior incarceration categories.21Property misdemeanors were the modal offense for all court cohorts, representing between 26.9% and 44.4% of thetotal cohort.22Fields with fewer than 30 subjects are omitted as to not provide potentially skewed or misleading statistics.1912
County LevelCounty level analysis of recidivism poses challenges because several counties have a lownumber of juveniles represented in the study. As a result, it is often difficult to draw county levelconclusions. For example, 12 of the 35 juvenile jurisdictions in Washington State had fewer than100 juveniles with dispositions in 2014. The number of counties with more than 100 subjectsper category of analysis decreases further as the dispositions are disaggregated. For example,less than one-half of jurisdictions (14) had more than 100 subjects in the adjudicated cohort, andno jurisdiction had more than 100 subjects in the JR release cohort.13
Exhibit 14Recidivism Outcomes by County23All 32.7Felony 4.028.239.1--12.75.118.3--Lincoln10.0-----
This is the second juvenile recidivism report for Washington State, using a court and Juvenile Rehabilitation (JR) cohort. The results are relatively consistent with the previous report's findings. For this report, the overall recidivism rates were 30.3% for the court cohort and just under fifty percent (49.6%) for the JR release cohort.