Transcription
Centre for PanorOmic Sciences – Imaging and Flow Cytometry CoreNovoCyte Advanteon BVR Standard Operation ProtocolBasic Operation1. NovoExpress Software Log InLog into NovoExpress software with your own login name and password. Make sureAuto Login is unchecked.*Please contact Faculty Core Facility Staff to establish a new user account.*Username 0cleaning do not have password. Leave password entry box empty andclick Login.0cleaning account is for cleaning purpose only, DO NOT USE THIS ACCOUNT TOPERFORM EXPERIMENT.NovoCyte Advanteon BVR Operation Manual1
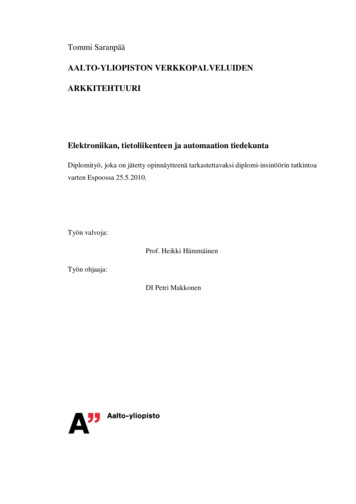
Centre for PanorOmic Sciences – Imaging and Flow Cytometry Core2. Compensation (Perform when needed)Step 1. Select appropriate plate type in the Plate Manager.Step 2. Set-up Compensation Controlsa. In the Home tab of the Menu Bar, click the Auto Compensation button.b. Select Compensation on: Height, Parameter for calculation: Median andcheck the boxes of channels involved. Then click OKNovoCyte Advanteon BVR Operation Manual2
Centre for PanorOmic Sciences – Imaging and Flow Cytometry Corec. Compensation Control Specimen is created in the Experiment Manager panelwith corresponding empty control samples of specific position of the tube rackor plates (e.g. A3: B530 FITC, A3 is the position of the rack or plate and refersto FITC single stain controls).The compensation controls tubes should be placed in the rack or plateaccording to the positions given (i.e. Put FITC single stain tubes in A3position).You may change the position by right-click of the sample name and Rename thecontrol (e.g. A3: B530 FITC can be renamed to B3: B530 FITC, FITC singlestain tube position now changes from A3 to B3).NovoCyte Advanteon BVR Operation Manual3
Centre for PanorOmic Sciences – Imaging and Flow Cytometry CoreStep 3. Compensation Control Acquisitiona. Click Run Plate on the Cytometer Control Panel.b. Select wells of compensation controls. Click Run and then OK to proceed.c. After all controls have been acquired, the compensation matrix is calculatedautomatically.Step 4. Apply Compensation Matrix to Experiment Samplea. Drag the Compensation node under the Compensation Specimen and Dropover the desired sample.NovoCyte Advanteon BVR Operation Manual4
Centre for PanorOmic Sciences – Imaging and Flow Cytometry Coreb. To fine tune the Compensation, click on the plot you want to adjust and click theQuick Compensation button In the Home tab of the Menu Bar OR the quickcompensation icon in the tool bar.Scrollbars appear on any two parameters plots with fluorescent parameters openedon the workspace. Quickly adjust compensation by dragging the scrollbar.NovoCyte Advanteon BVR Operation Manual5
Centre for PanorOmic Sciences – Imaging and Flow Cytometry Corec. To view or adjust the compensation matrix, lick the Compensation Matrixbutton In the Home tab of the Menu Bar and the Compensation Matrix windowwill show.To adjust, check Preview box and adjust the corresponding value. Thecorresponding plots will refresh with updated value real time. Adjust untilsatisfied. Then click OK to apply.Click Restore to restore the Auto-compensation matrix value.NovoCyte Advanteon BVR Operation Manual6
Centre for PanorOmic Sciences – Imaging and Flow Cytometry Core3. Sample acquisition with NovoSampler QStep 1. Create experiment samples from the Plate Managera. Select appropriate Plate type. Choose 40-tube rack for 5-mL flow tubesb. Highlight the position with samples on the plate by holding left Click andDrag AND/OR hold Ctrl and left-click to multi-select specific wells. Blacksquare indicates selected well.NovoCyte Advanteon BVR Operation Manual7
Centre for PanorOmic Sciences – Imaging and Flow Cytometry Corec. Click the New Sample(s) button to create a new sample of Specimen 1.d. Repeat step 1b and 1c to create new sample of Specimen 2 if needed.e. Check Absolute count if absolute counting is required.*Dead volume will increase from 10 L to 30 L with Absolute countchecked.f. Double click Sample 1 on the Experiment Manager until the red arrow ispointing to Sample 1.NovoCyte Advanteon BVR Operation Manual8
Centre for PanorOmic Sciences – Imaging and Flow Cytometry CoreStep 2. Select Channelsa. Click on the “A” and “H” of the parameters panel in Cytometer setting to SelectOR Unselect ALL.b. Check the box of A or H of the interested channels to select. Please alwayscheck A for FSC (H is checked by default).NovoCyte Advanteon BVR Operation Manual9
Centre for PanorOmic Sciences – Imaging and Flow Cytometry CoreStep 3. Conditions Setupa. Set up the data recording stop conditions by checking the box next to thecondition Events and/or Time and/or Volume. Acquisition will stop when ANYone of the selected condition(s) is fulfilled.*Volume is compulsorily selected.EventsTimeVolumeRange of each conditions:Events1 – 10,000,000Time0-60 min; 0-59 SecVolume5 – 5000 L* Volume may be limited to the Plate format. Please refer to the Appendix.b. Select flow rate by click the radio button of Slow (14 L/min), Medium (35 L/min), and Fast (66 L/min) OR use the slider to adjust the flow rate from5 120 L/min.NovoCyte Advanteon BVR Operation Manual10
Centre for PanorOmic Sciences – Imaging and Flow Cytometry Core* Current sample’s flow rate and the corresponding core diameter are shownin the bottom of the panel.c. Set the appropriate threshold by select the appropriate parameters and type in theappropriate number on the Threshold panel.Suggested Threshold on Different cell type:NovoCyte Advanteon BVR Operation Manual11
Centre for PanorOmic Sciences – Imaging and Flow Cytometry Cored. Setup mixing and rinsing conditions under Plate Manager.*For 96-well plate, use 300 rpm.NovoCyte Advanteon BVR Operation Manual12
Centre for PanorOmic Sciences – Imaging and Flow Cytometry CoreStep 4. Draw Plotsa. Click the icon of the interested plot type above the workspaceDotDensity Histogram ContourPlot typeDot plotNumber ofparameters2Density plot2Contour plot2Histogram plot1(x axis only)DescriptionThe intensities of two parameters are represented bythe coordinates of an event (one dot) on the plot.The intensities of two parameters are represented bythe coordinates of an event (one dot) on the plot withcolour-coded density display.The intensities of two parameters are represented bythe coordinates on the plot with contour line to showdensity.The intensity of a parameter is represented along thex-axis, and the number of events at each intensityvalue is represented along the y-axis.NovoCyte Advanteon BVR Operation Manual13
Centre for PanorOmic Sciences – Imaging and Flow Cytometry Coreb. Create the following plots with the following sequence.FSC-H VS SSC-H (Mother population of interest) FSC-H VS FSC-A (Single Cell Gate) Live-Dead VS SSC-A (if applicable) Fluorescence Plots (if applicable)NovoCyte Advanteon BVR Operation Manual14
Centre for PanorOmic Sciences – Imaging and Flow Cytometry Corec. To change the parameters of a plot, mouse over the axis label and right-clickto open the drop-down menu of parameters list. Select the parameter of interest.d. Right-click within a plot to change the plot type if needed.NovoCyte Advanteon BVR Operation Manual15
Centre for PanorOmic Sciences – Imaging and Flow Cytometry Coree. To copy all the settings and plots to other samples in Specimen 1, dragSample 1 and drop over Specimen 1 on the Experiment Manager.f. Click Paste to All.NovoCyte Advanteon BVR Operation Manual16
Centre for PanorOmic Sciences – Imaging and Flow Cytometry CoreStep 5. Save Experimenta. Click File on the Menu bar.b. Click Save As.c. Save the experiment (.ncf) in the folder below.Computer Experiment Data (D: ) User Department YOURFOLDERClick Save.NovoCyte Advanteon BVR Operation Manual17
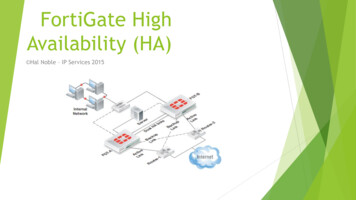
Centre for PanorOmic Sciences – Imaging and Flow Cytometry CoreStep 6. Load tube rack/ platea. Lift the cover of the NovoSampler Q.b. Place the tube rack with your sample tubes or plate on the orbital Shaker withA1 position on the top left-hand corner. Make sure the rack or plate is placedwithin the 4 metal poles.A1c. Put down the cover.NovoCyte Advanteon BVR Operation Manual18
Centre for PanorOmic Sciences – Imaging and Flow Cytometry CoreStep 7. Sample Acquisitiona. Click Mix Sample to perform orbital shaking.b. To run SINGLE well/ tube, double-click on the interested well on PlateManager and the selected position highlight in red.*A2 is selected in the picture.NovoCyte Advanteon BVR Operation Manual19
Centre for PanorOmic Sciences – Imaging and Flow Cytometry Corec. Click Run Single Well on the Cytometer Control Panel.d. To run multiple tubes / wells automatically, click Run Plate on theCytometer Control Panel.e. Double check if the plate type is correct as it state. Click Run to continue, orelse click Cancel and correct the plate type in Plate Manager panel.NovoCyte Advanteon BVR Operation Manual20
Centre for PanorOmic Sciences – Imaging and Flow Cytometry Coref. Select the tubes or wells you would like to be acquired on the Plate View.Selected wells highlight in Blue. Then click Run.g. Click OK to continue.NovoCyte Advanteon BVR Operation Manual21
Centre for PanorOmic Sciences – Imaging and Flow Cytometry Core4. Data Analysis during acquisitionStep 1. Set the appropriate display range of the plot.a. Select the FSC-H Vs SSC-H plot (The colour of the header of the plot will bedarker). Click Auto range button to optimize the data display range.b. To fine tune the data display range, click zoom in / zoom out buttons.NovoCyte Advanteon BVR Operation Manual22
Centre for PanorOmic Sciences – Imaging and Flow Cytometry Corec. Drag on the interested region on the plot if you click zoom in.d. Click within a plot if you click zoom out. The range increases by 20% of thecurrent range. Click repeatedly until the desired range is reached.e. To change the scale of parameters, right click on the coordinate label to openand select the axis scaling (i.e. Linear, Log or Biexponential). Click Setting formore options.NovoCyte Advanteon BVR Operation Manual23
Centre for PanorOmic Sciences – Imaging and Flow Cytometry Coref. If you cannot achieve a desirable range by using the plot range tools, adjustthe Gain of the corresponding channels in Cytometer Control - Parameters.To adjust photodetector gain of one parameter, double click the current Gainnumber of the specified parameter, the photodetector gain adjustment sliderwill show. Drag the slider bar or directly enter the value to change thephotodetector gain.*Gain can only be adjusted during acquisition.Step 2. Gatinga. Draw Gates to gate out the target population on the FSC-H VS SSC-H plot withgating tools.Dot Plot, Density Plot, Contour Plot – All gates suitableHistogram Plot – Range / Bi-range gate suitableNovoCyte Advanteon BVR Operation Manual24
Centre for PanorOmic Sciences – Imaging and Flow Cytometry Coreb. To create rectangular/ elliptical/ range/ bi-range gate, click the correspondingicon and drag in the plot to enclose the target population within the shape.Release the mouse button to create the gate.To create polygonal gate, click the corresponding icon and left click in theplot to create the first vertex of the polygon. Click in a new location to createthe second vertex of the polygon. Continue moving around the targetpopulation and creating vertices until the target population is enclosed. On thelast vertex, double-click to complete the polygon and create the gate.To create quadrant gate, click the corresponding icon and Click in the plot tocreate the center of the quadrants and create the gate. As shown below, thecenter, endpoints, and lines of the quadrant gate can be moved to enclose thecorrect populations.NovoCyte Advanteon BVR Operation Manual25
Centre for PanorOmic Sciences – Imaging and Flow Cytometry Corec. To create gate subpopulation, right-click at the plot header of a plot todisplay a drop-down menu. Select the mother gate and create a new gate foryour target.d. The Gate Manager panel displays all gates of the active sample in list modeor tree mode. It provides user interface to modify gate name, color and colorprecedence and also shows gate hierarchy and gate statistics.NovoCyte Advanteon BVR Operation Manual26
Centre for PanorOmic Sciences – Imaging and Flow Cytometry CoreStep 3. Statisticsa. To edit statistics, click the button on the lower right corner of a plot toexpand the plot and display the statistics chart first.b. Right-click within the chart and select the parameters to hide ordisplay.NovoCyte Advanteon BVR Operation Manual27
Centre for PanorOmic Sciences – Imaging and Flow Cytometry Core5. Data ExportStep 1. Export FCS filea. Select the sample, specimen, group, or experiment file node with data to beexported in the Experiment Manager Panel. Right-click the node and selectExport Export to FCS Files The Export Events window will open.b. Choose “All” for the Gate option. Click “ ” button next to entry box of Path.Select your saving destination in Experiment Data Drive (F:/)Experiment Data (D:) user Department Your NAMESelect “FSC3.0” for Format and Click OK.NovoCyte Advanteon BVR Operation Manual28
Centre for PanorOmic Sciences – Imaging and Flow Cytometry CoreStep 2. Export PDF file (optional)a. To Export Plots and Statistics to a PDF, double-click theReport node in the Experiment Manager panel and Report Window will popup.b. Click the PDF button of the tool bar.Select your saving destination in Experiment Data Drive (D:/)D:/user/Your department/Your NAMEc. Click Savebuttons on the top left-hand corner of the window when youfinish your experimentNovoCyte Advanteon BVR Operation Manual29
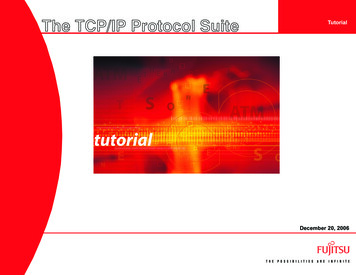
Centre for PanorOmic Sciences – Imaging and Flow Cytometry Core6. System Cleaning (You may use the “0cleaning” account to perform)a. Place tubes of at least 1ml of cleaning solution 1, 2 and 3 and put them in A1A3 of the 40-tube rack respectively.A1 A2 A3b. Click File on the Menu bar.c. Click New New from Experiment File.d. Select Desktop cleaning.ncf . Then click OKNovoCyte Advanteon BVR Operation Manual30
Centre for PanorOmic Sciences – Imaging and Flow Cytometry Coree. Click Run Plate on the Cytometer Control Panel.f. Select all wells. Then click Run. (Click OK to continue).g. Select Desktop cleaning.ncf. Click Save and Yes to overwrite.NovoCyte Advanteon BVR Operation Manual31
Centre for PanorOmic Sciences – Imaging and Flow Cytometry Core7. Re-use Experiment as templatea. Click File on the Menu bar.b. Click New New from Experiment File.c. Select your target experiement file (.ncf) . Then click OKd. Click File Save As to save the new experiment.NovoCyte Advanteon BVR Operation Manual32
Centre for PanorOmic Sciences – Imaging and Flow Cytometry Core8. NovoExpress Software Log outa. Click File on the Menu bar.b. Click LogoutNovoCyte Advanteon BVR Operation Manual33
Centre for PanorOmic Sciences – Imaging and Flow Cytometry CoreAPPENDIXNovoCyte Advanteon BVR Operation Manual34
Centre for PanorOmic Sciences - Imaging and Flow Cytometry Core NovoCyte Advanteon BVR Operation Manual 20 c. Click Run Single Well on the Cytometer Control Panel. d. To run multiple tubes / wells automatically, click Run Plate on the Cytometer Control Panel. e. Double check if the plate type is correct as it state. Click Run to continue, or