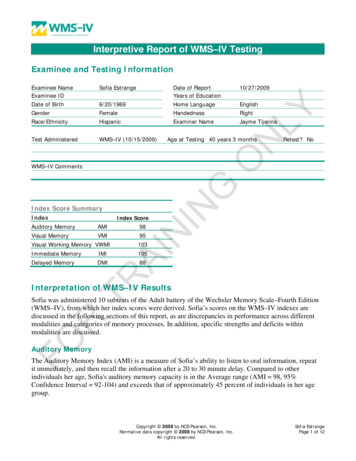
Transcription
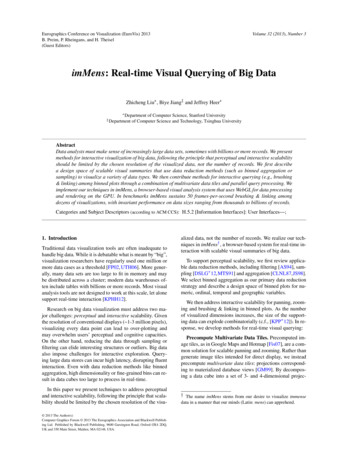
Eurographics Conference on Visualization (EuroVis) 2013B. Preim, P. Rheingans, and H. Theisel(Guest Editors)Volume 32 (2013), Number 3imMens: Real-time Visual Querying of Big DataZhicheng Liu? , Biye Jiang‡ and Jeffrey Heer? Department‡ Departmentof Computer Science, Stanford Universityof Computer Science and Technology, Tsinghua UniversityAbstractData analysts must make sense of increasingly large data sets, sometimes with billions or more records. We presentmethods for interactive visualization of big data, following the principle that perceptual and interactive scalabilityshould be limited by the chosen resolution of the visualized data, not the number of records. We first describea design space of scalable visual summaries that use data reduction methods (such as binned aggregation orsampling) to visualize a variety of data types. We then contribute methods for interactive querying (e.g., brushing& linking) among binned plots through a combination of multivariate data tiles and parallel query processing. Weimplement our techniques in imMens, a browser-based visual analysis system that uses WebGL for data processingand rendering on the GPU. In benchmarks imMens sustains 50 frames-per-second brushing & linking amongdozens of visualizations, with invariant performance on data sizes ranging from thousands to billions of records.Categories and Subject Descriptors (according to ACM CCS): H.5.2 [Information Interfaces]: User Interfaces—;1. IntroductionTraditional data visualization tools are often inadequate tohandle big data. While it is debatable what is meant by “big”,visualization researchers have regularly used one million ormore data cases as a threshold [FP02, UTH06]. More generally, many data sets are too large to fit in memory and maybe distributed across a cluster; modern data warehouses often include tables with billions or more records. Most visualanalysis tools are not designed to work at this scale, let alonesupport real-time interaction [KPHH12].Research on big data visualization must address two major challenges: perceptual and interactive scalability. Giventhe resolution of conventional displays ( 1-3 million pixels),visualizing every data point can lead to over-plotting andmay overwhelm users’ perceptual and cognitive capacities.On the other hand, reducing the data through sampling orfiltering can elide interesting structures or outliers. Big dataalso impose challenges for interactive exploration. Querying large data stores can incur high latency, disrupting fluentinteraction. Even with data reduction methods like binnedaggregation, high dimensionality or fine-grained bins can result in data cubes too large to process in real-time.In this paper we present techniques to address perceptualand interactive scalability, following the principle that scalability should be limited by the chosen resolution of the visu 2013 The Author(s)Computer Graphics Forum 2013 The Eurographics Association and Blackwell Publishing Ltd. Published by Blackwell Publishing, 9600 Garsington Road, Oxford OX4 2DQ,UK and 350 Main Street, Malden, MA 02148, USA.alized data, not the number of records. We realize our techniques in imMens† , a browser-based system for real-time interaction with scalable visual summaries of big data.To support perceptual scalability, we first review applicable data reduction methods, including filtering [AS94], sampling [DSLG 12,MTS91] and aggregation [CLNL87,JS98].We select binned aggregation as our primary data reductionstrategy and describe a design space of binned plots for numeric, ordinal, temporal and geographic variables.We then address interactive scalability for panning, zooming and brushing & linking in binned plots. As the numberof visualized dimensions increases, the size of the supporting data can explode combinatorially (c.f., [KPP 12]). In response, we develop methods for real-time visual querying:Precompute Multivariate Data Tiles. Precomputed image tiles, as in Google Maps and Hotmap [Fis07], are a common solution for scalable panning and zooming. Rather thangenerate image tiles intended for direct display, we insteadprecompute multivariate data tiles: projections corresponding to materialized database views [GM99]. By decomposing a data cube into a set of 3- and 4-dimensional projec-† The name imMens stems from our desire to visualize immensedata in a manner that our minds (Latin: mens) can apprehend.
Zhicheng Liu, Biye Jiang & Jeffrey Heer / imMens: Real-time Visual Querying of Big Datations, imMens flexibly manages data subsets as needed. Using multidimensional projections, imMens can compute aggregations across dimensions to support brushing & linking.Parallelize Data Processing and Rendering. Depending on binning resolution, data tiles may still be quite large,with millions or more values. To speed aggregation, imMensuses a dense indexing scheme that simplifies parallel queryprocessing. To realize this approach in contemporary webbrowsers, imMens uses WebGL to leverage parallel processing on the GPU. We present a two-pass approach that usesWebGL shader programs to first compute aggregate queriesand then render updated visualizations.The contributions of our work are two-fold. First, we introduce the use of multivariate data tiles for pre-processingand dynamic loading of data to enable scalable interaction.Second, the imMens system implements a novel synthesisof binned aggregation, data representation and parallel processing (here using GPU computation) to support interactive visualization of big data. In performance benchmarksimMens sustains near 50 frames-per-second brushing andlinking among dozens of visualizations. This performanceis invariant on data sets ranging from thousands to billionsof records. To our knowledge, imMens is the first system toenable real-time interactive brushing of data sets this large.2. Related Work: Visualizing Big DataA number of prior research projects have focused on improving the scalability of visualization systems.2.2. Scalable Visualization SystemsIn addition to work on visualization design, both researchersand companies have developed large scale visualization systems. Commercial products such as Tableau [Tab] and Spotfire [Spo] translate user interactions into database queries,and can push processing of big data to dedicated databases.The query results are typically aggregates, such that the visualizations are perceptually scalable. This approach has twopotential issues: query latency can be high for large data sets,and there is no guarantee that the result size has a reasonable upper bound. To reduce long query times, some systems prefetch based on the user’s current context [CXGH08,DRW03]. To improve performance, other researchers exploitmodern hardware such as multi-core [RWC 08, PTMB09,HB10b] and GPU [FP02, ME09, ZBDS12] computing.The system most similar to imMens is Kandel et al.’s Profiler [KPP 12]. Profiler employs binned plots to enable interaction with over a million data points. However, Profileruses a single in-memory data cube and sequential query processing to support brushing & linking. As we show in ourbenchmarks, this approach does not scale to larger data sets.Our work extends and integrates these approaches. We assume a client-server architecture in which scalable databasescan be used to precompute multivariate data tiles. imMensthen requests and manages data tiles to address issues of datasize and transfer, and uses parallel processing on the GPUfor real-time querying and rendering on the client.2.1. Scalability of Visual Encodings3. Data Reduction MethodsIn many visualizations, each data record maps to a visualitem, resulting in occlusion and cluttering for high datadensities. In response, researchers have proposed a number of approaches. Pixel-oriented visualization techniquesplot data points as single pixels to maximize screen utilization [Kei00]. Spatial displacement techniques like jittering [TGC03] and topological distortion [KHD 10] reduceocclusion but do not preserve spatial information. For parallel coordinates and scatterplot matrices, dimension reordering can also reduce clutter [PWR04]. Alpha blending (transparency) is often used to encode density and thus combatover-plotting [JS98,JLJC05,UTH06]. Alpha blending effectively performs aggregation in image space, rather than dataspace. Still, each of these techniques requires drawing everydata record, which imposes inherent scalability limits.Our approach to visualizing big data follows an overarching principle: perceptual and interactive scalability shouldbe limited by the chosen resolution of the visualized data,not the number of records. We now survey data reductionmethods that can be used to realize this principle, includingfiltering, sampling, aggregation and modeling.An alternative is to reduce big data to smaller, deriveddata more amenable to visualization [DBC 13]. Data reduction strategies used in information visualization include filtering [AS94], sampling [BS06, DSLG 12, Raf05], binnedaggregation [BBSBA08, CLNL87, EF10, Fis07, HDS 10,KMSH12, KPP 12, RWC 08], and model-fitting. We compare these approaches in more detail in the next section anddescribe a design space for binned plots.3.1. Filtering & SamplingFiltering and sampling techniques select a subset of data,to which standard visualization techniques can be applied.The selected subset, however, may still be too large to visualize effectively and may omit elements of interest. In simple random sampling [Loh09], every data point has the sameprobability of being selected. The sample resulting may notbe representative and can miss important structures or outliers. Systematic sampling sorts data points in a particularorder and selects data points at regular intervals with a random start. Stratified sampling divides a data set into disjointsubgroups or “strata”, and applies simple or systematic sampling within each stratum. However, these methods requirethat specific dimensions be chosen ahead of time, requiringprior knowledge and often costly pre-processing. 2013 The Author(s) 2013 The Eurographics Association and Blackwell Publishing Ltd.
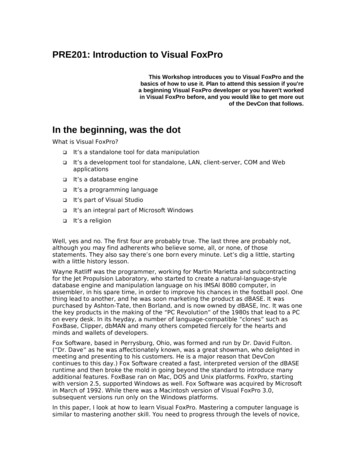
Zhicheng Liu, Biye Jiang & Jeffrey Heer / imMens: Real-time Visual Querying of Big Data(a)(b)Figure 1: A symbol map (a) and heatmap (b) visualizing a dataset of Brightkite user checkins. The symbol map visualizes asample of the data, and the heatmap shows the density of checkins by aggregation. Compared to the heatmap, sampling missesimportant structures such as inter-state highway travel and Hurricane Ike, while dense regions still suffer from over-plotting.3.2. Binned AggregationBinning aggregates data and visualizes density by countingthe number of data points falling within each predefined bin.For a numeric variable, one can define bins as adjacent intervals over a continuous range. For categorical variables, onecan simply treat each value as a bin. Aggregation can alsobe defined at multiple scales over a hierarchy [EF10], withnested, potentially non-uniform, bins. For example, temporal values can be aggregated by day, week, month, quarter,year, and so on. In terms of visualization, histograms andheatmaps are exemplary 1D and 2D binned plots.over this reduced data. However, this approach still suffersfrom the same problems with sampling discussed above. Online aggregation [HHW97, FPDs12] shows continuously updating aggregates and confidence intervals in response to astream of samples. Our approach is compatible with thesetwo methods: one could compute approximate data tiles using the BlinkDB approach, or update data tiles in a streamingfashion via online aggregation. Though not explored here,these methods may provide low-latency results when complete data tiles have not yet been precomputed.4. Designing Binned Plots3.3. Model-based AbstractionAnother reduction strategy is to describe data in terms ofmathematical models or statistical summaries. For example,one might fit a model and visualize the resulting parametersor theoretical density. For scatter plots one can use regression models to fit trend lines; examples for time series datainclude moving averages and auto-regressive models.3.4. Hybrid Reduction MethodsThe above data reduction methods can also be combined. Forexample, a box plot with outliers applies both modeling andfiltering. In this vein, Novotný and Hauser [NH06] performtwo dimensional binning for parallel coordinates and showspecific data outliers along with the bins. To visually summarize large networks, both Bagrow et al. [BBSBA08] andKairam et al. [KMSH12] combine modeling and aggregationthrough multi-scale histograms of network statistics.Database researchers have explored the combination ofsampling and aggregation. To provide fast approximatequeries, BlinkDB [APM 12] builds multi-dimensional andmulti-resolution stratified samples and computes aggregates 2013 The Author(s) 2013 The Eurographics Association and Blackwell Publishing Ltd.In imMens we focus on binned aggregation as our primarydata reduction strategy. Here we present our rationale for using binned aggregation, and discuss the corresponding visualization design space for binned plots.4.1. Why Binned Aggregation?We use binned aggregation because it conveys both globalpatterns (e.g., densities) and local features (e.g., outliers),while enabling multiple levels of resolution via the choiceof bin size. Consider Figure 1, which visualizes a data setof over four million user checkins on Brightkite, a locationbased user checkin service, from April 2008 to October 2010[CML11]. Figure 1(a) shows a symbol map of stratified samples generated by Google Fusion Tables [DSLG 12]. Figure1(b) shows a binned heatmap in imMens, color-coded by thedensity of checkins at different locations. One can see richerinformation in the heatmap, including patterns on inter-statehighways, events outside the US, and a long trail of checkinsspanning the coast of Texas and Gulf of Mexico. These arecheckins made by Brightkite user account “Hurricane Ike”that report the location of the hurricane along its path in2008. Sampling can fail to show such interesting outliers.
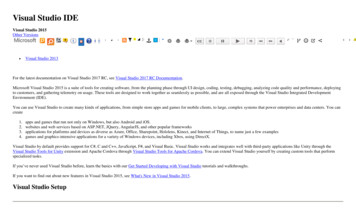
Zhicheng Liu, Biye Jiang & Jeffrey Heer / imMens: Real-time Visual Querying of Big Data4.2. Visualization Design for Binned PlotsWe consider binning schemes for four data types commonlyfound in databases: ordinal, numeric, temporal and geographic. For ordinal and (sorted) categorical data, each distinct value is a bin. We group numeric data into adjacentintervals over a continuous range. Temporal values can bebinned at various levels of granularity: year, month, week,day, hour, etc. For geographic data, we treat 1D nominalunits such as states or countries as unique bins. If locationsare specified as latitude and longitude points, we bin theirprojected spatial coordinates. We primarily use the Mercatorprojection for consistency with existing map tile providers.Table 1 provides a summary of relevant visualization designs organized by data type and number of dimensions.One-dimensional plots for ordinal, numeric, temporal andgeographical dimensions take the form of bar charts, histograms, line graphs and choropleth maps. Two-dimensionalbinned plots are heatmap variants; plots with heterogeneousdata types (e.g., a temporal and an ordinal variable) are alsopossible. We focus on binned plots with up to two data dimensions, encoded spatially. Color is used to encode datadensity and indicate highlights for brushing & linking. Werefrain from additional visual variables such as texture orsize, as they might interfere with visualization interpretation.Multidimensional displays can be constructed in the form ofmultiple coordinated views and trellis plots [BCS96].Figure 2 shows binned scatter plots [CLNL87] of twonumeric dimensions. Unwin et al. describe three binningschemes that can tessellate a plot: triangular, rectangular andhexagonal [UTH06]. Carr et al. [CLNL87] argue for hexagonal bins due to reduced bias in density estimation comparedto rectangular bins; however, Scott [Sco92] shows that thedifferences are marginal. In imMens, we choose rectangular binning for consistency and efficiency of query processing. Applying consistent binning schemes over 1D (e.g., histograms) and 2D plots ensures compatibility when performing linked selections between plots.Statisticians have proposed various heuristics to select binsizes for a numeric range (e.g., Sturges’ formula [Stu26] andScott’s reference rule [Sco79]). These heuristics can varyNumericOrdinalTemporalGeographicHistogramBar ChartLine Graph /Area ChartChoropleth MapBinnedScatter le 1: Example visualization designs for binned plots.(a)(c)(b)(d)Figure 2: Scatter plots with 100,000 data points: (a) traditional, (b) hexagonal bins, (c) rectangular bins and (d) rectangular bins with perceptual (cube root) color adjustment.significantly and their applicability to big data is unclear.In imMens, we treat bin count as an adjustable parameter,bounded by the screen pixels allocated to a plot and available resources. At the limit, we can map one bin to one pixeland include as many bins as memory constraints allow.4.3. Color EncodingFor color encoding, one can map density values to hues, luminance or opacity. We map a non-zero density value x to aluminance (or opacity) value Y [0, 1] using the formula: γ x̂ xmin(1 α)(1)Y α xmax xminHere x̂ denotes the value of x, bounded from above and below by the range parameters xmax and xmin . These parameterscan be determined from the data, or adjusted interactively toexplore value ranges at finer resolutions.Our color encoding employs two techniques to enhanceperception. First, linear changes in Y values may not correspond to perceptually linear changes. The γ parameter can beused to introduce a non-linearity. By default we set γ 13 , asthe cube root approximates perceptual linearity, akin to thelightness channel in the CIELAB color space [Sto03] (compare Figures 2(c) and 2(d)). Second, when visualizing bigdata the maximum density value in a binned plot may be orders of magnitude greater than the minimum non-zero density value. A naïve color ramp can render such bins invisible.To ensure the visibility of outliers, we set a minimum valueof α 0.15 for non-zero densities, based on prior experimental results for luminance contrast [SB09, HB10a]. 2013 The Author(s) 2013 The Eurographics Association and Blackwell Publishing Ltd.
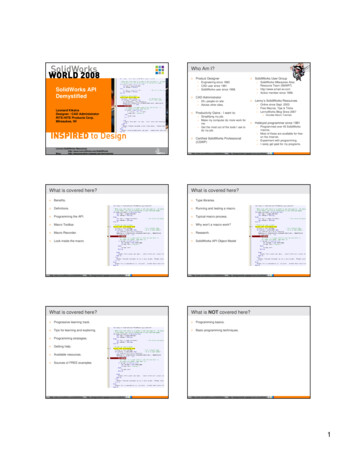
Zhicheng Liu, Biye Jiang & Jeffrey Heer / imMens: Real-time Visual Querying of Big DataFigure 3: Panning and zooming in a binned plot: initial view(left), zooming in (middle), panning to the lower-left (right).5. Enabling Interaction in Binned PlotsInteraction is essential to exploratory visual analysis [HS12],but big data imposes challenges to real-time response rates.While each binned chart type in the previous section visualizes one or two aggregated dimensions, more data resolutionis needed to support interaction. Panning and zooming mayrequire finer grained bins, as in Figure 3.Figure 4: Multiple coordinated views of Brightkite usercheckins in North America. Cyan lines in the heatmap indicate data tile boundaries. Each visualization region is annotated by its backing data dimensions and indices.Brushing & linking, in which selections in one view highlight the corresponding data in other views, requires computing aggregates filtered by an initial data selection. Thesequeries require partially de-aggregated data over which tocompute the filtered aggregation (or “roll-up”). Sendingthese queries to a server incurs latency due to both processing and networking delays, and can easily exceed a 100 millisecond threshold for interactive response [CMN83]. Furthermore, multiple clients might overload the server.A full data cube is often too big to fit in memory and queryin real-time. The size of a cube is i bi , where bi is the bincount for dimension i. As the number of dimensions or binsincreases, the data cube size may become unwieldy. To address this issue, we decompose the full cube into sub-cubeswith at most four dimensions.In this section, we present our method for enabling realtime visual querying in imMens. We use brushing & linkingover the Brightkite data set as a running example. The rawBrightkite data has five dimensions: User, Date, Time, Latand Lon. Figure 4 shows four linked visualizations depicting binned data from different perspectives. The geographical heatmap (X, Y) is based on Mercator-projected Lon, Latcoordinates; the three histograms show monthly (Month),daily (Day) and hourly (Hour) checkin distributions derivedfrom the Date and Time fields. The Jan bin is selected in theMonth histogram. In response, corresponding data are highlighted in orange in the other histograms, and the geographicheatmap shows only checkins in the month of January.5.1. Data Cube Queries to Support InteractionApplying binned aggregation to X, Y, Month, Day and Hour,we form a 5-dimensional data cube (Figure 5(a)). The datacube contains the lowest level of data resolution in thelinked visualizations. To perform brushing & linking fromthe Month histogram to the Day histogram, we can filter thedata cube to only the rows with bin value 0 in the Month dimension (corresponding to January; highlighted in yellow inFigure 5(a)) and perform a roll-up by summing data alongthe Hour, X and Y dimensions. To zoom out, we can aggregate adjacent bins to compute a coarser-grained projection.Panning at the most zoomed-in level involves querying thebins visible in the current viewport. 2013 The Author(s) 2013 The Eurographics Association and Blackwell Publishing Ltd.5.2. From Data Cubes to Multivariate Data TilesThe primary contributor to data cube size is the combinatorial explosion of multiple dimensions. However, for anypair of 1D or 2D binned plots, the maximum number ofdimensions needed to support brushing & linking is four(e.g., between two binned scatterplots that do not share adimension). As a result, we can safely decompose the fullcube into a collection of smaller 3- or 4-dimensional projections. For example, four 3-dimensional cubes can cover allthe possible brushing and linking scenarios shown in Figure4: (X, Y, Hour), (X, Y, Day), (X, Y, Month), (Hour, Day, Month).If we assume a uniform bin count b, this decomposition reduces the total data record count from b5 to 4b3 ; when b 50,the reduction is from 312.5M to 0.5M records.After decomposition, individual sub-cubes may still beprohibitively large if the bin count is high. In some plots,we can treat the bin count as a free parameter, and adjust accordingly. For others – particularly geographic heatmaps –we may wish to zoom in to see fine-grained details, requiring an exponentially increasing number of bins across zoomlevels. To handle large bin counts, we segment the bin rangesto form multivariate data tiles, as illustrated in Figure 5(b).Data tiles are inspired by the notion of map tiles used insystems such as Google Maps and Hotmap [Fis07]. However, data tiles differ in two important ways. First, they provide data for dynamic visualization, not pre-rendered images. Second, they contain multidimensional data to supportquerying as well as rendering. Given a set of data tiles anda query selection (bin range), we can dynamically computeroll-up queries and render projected data. Figure 4 shows geographic tile boundaries highlighted in cyan. We label each
Zhicheng Liu, Biye Jiang & Jeffrey Heer / imMens: Real-time Visual Querying of Big Data(a)(b)Figure 5: (a) A 5-dimensional data cube of Brightkite check-ins; (b) Decomposing a full cube into sub-cubes and data tiles.tile dimension as Dbs -be -z, where D is the binned data dimension, bs represents the starting bin index, be representsthe ending bin index, and z represents the zoom level.The Brightkite visualization in Figure 4 uses 13 data tiles:one tile representing the 3-dimensional projection of month,day and hour (i.e., Month0-11-0 Day0-30-0 Hour0-23-0),and twelve tiles containing 3-dimensional projections forall combinations of the four geographic segments and threehistograms (e.g., X256-511-4 Y512-767-4 Month0-11-0).Multivariate data tiles are precomputed on a server and thenloaded on demand to support client-side visualization.Brushing & linking involves aggregating these data tiles.For example, when the user selects a region in the geographic heatmap, we need to highlight the correspondingcheckin distributions in the three histograms. In the worstcase, the selected geographic region covers bins in all fourmap tiles. To render the highlight in the Day histogram weneed to roll-up the four data tiles containing the X Y Daydimensions and sum the results. Figure 6 shows this process.For interactions like panning and zooming, we dynamicallyfetch data tiles precomputed at different levels of binningresolution, similar to existing mapping services.5.3. Dense vs. Sparse Data Tile StorageData tiles can use either sparse or dense packing schemes.A sparse representation stores indices and values only fornon-zero bins (Figure 7(b)). A dense representation includeszero values, but can store all the data as a simple array if thebin counts for all dimensions are known (Figure 7(c)).‡ If adata tile has many empty bins, a sparse representation can reduce storage costs. For example, a sparse packing is used inProfiler [KPP 12] for full data cubes of up to 5 dimensions.‡ We treat row indices as numbers in a mixed-radix number system [Knu06]. The row index in a k-dimensional data tile can be expressed as V (k 1)R(k 1) V (K 2)R(K 2) . V (0)R(0) , where V (k)is the value of the kth digit, and R(k) is the radix of the kth digit.Figure 6: Brushing & linking from the geographic heatmapto the Day histogram. We aggregate four data tiles along theX and Y dimensions and sum up the projections.Figure 7: Sparse and dense representations of a data tile.However, as the number of data records increases, the density of the data typically also increases. Once the proportionof non-zero bins exceeds a threshold (20% for 4D tiles, 25%for 3D tiles), a dense representation is more efficient becausewe can omit bin indices. In imMens we use dense tiles to exploit these space savings, safeguard worst-case performance,and simplify parallel query processing.5.4. Parallel Query ProcessingA dense representation scheme supports simple, efficientparallel processing when aggregating data tiles. Dense tilesprovide a consistent indexing scheme that enables direct 2013 The Author(s) 2013 The Eurographics Association and Blackwell Publishing Ltd.
Zhicheng Liu, Biye Jiang & Jeffrey Heer / imMens: Real-time Visual Querying of Big Datalookup of any multidimensional bin using a predictable integer index. As a result, aggregation queries can be parallelized easily. For each output bin (summed value), we canuse a simple loop that accesses only the bins needed for thatsummation. These computations can be run in parallel in ashared memory environment without any conflicts, resultingin faster query performance than a sequential scan.Input: c2 , c3 , R2 , R3 , TOutput: sum v at index i of d1 ’s projectionv 0;foreach j R2 doforeach k R3 dov T [i c2 c3 j c3 k];endendAlgorithm 1: Data tile roll-up for a projection index.Consider a 3D data tile T with dimensions (d1 , d2 , d3 ),with respective bin counts (c1 , c2 , c3 ). If users brush a 2Dbinned plot of d2 and d3 to select ranges R2 and R3 , we cancompute the summed value v at index i of the d1 projectionusing Algorithm 1. With this simple roll-up procedure, wecan run the algorithm in parallel for all c1 indices.We note that our summation scheme can be further optimized by the use of summed area tables. If data tiles insteadstore cumulative densities over index ranges, the summationfor an output bin can be computed with a constant numberof lookups. However, in practice we find that our simplerscheme provides good performance, while the use of cumulative densities exacerbates issues of arithmetic overflow.6. Implementation DetailsWe implement our visualization and interaction techniquesin imMens, a browser-based system for interactive visual exploration of big data. Given a visualization definition, imMens loads data tiles from a server and provides an interactive multiple view display of binned plots within standardscompliant web browsers. We use WebGL, a JavaScript variant of the OpenGL ES 2.0 specification, to perform GPUbased computation and render visualizations to HTML5 canvas elements. We also use Leaflet [Lea] to display map image tiles and D3 [BOH11] to render axes and labels. We nowdescribe our scheme for storing data tiles as image texturesand present our querying and rendering pipeline.6.1. Storing Data Tiles as Image FilesBy packing data tiles in an image format, we can directlybind them to the WebGL context as textures and take advantage of existing browser caching facilities. Packing datatiles into images facilitates efficient storage and transfer oftiles and makes the data accessible for parallel processingon the GPU. For each data tile integer value v, we apply the 2013 The Author(s) 2013 The Eurographics Association and Blackwell Publishing Ltd.scheme in Equation 2 to pack it into the 8-bit RGBA channels of a pixel. If the value is smaller than 231 , we can preserve complete information with no precision loss. We setthe highest-order bit in the alpha channel to 1 due to imageformat constraints; we use the PNG file format for its lossless compression and network portability. The PNG specification instructs that fully transparent pixels be assigned thesame RGB values (zero) for better compression. Storing zerovalues in alpha channels thus results in data loss. A 0x80 ((0xFF000000 & v) 24) R (0x00FF0000 & v) 16G (0x0000FF00 & v) 8 B (0x000000FF & v)(2)The maximum supported texture size imposes a constrainton th
tive visualization of big data. In performance benchmarks imMens sustains near 50 frames-per-second brushing and linking among dozens of visualizations. This performance is invariant on data sets ranging from thousands to billions of records. To our knowledge, imMens is the first system to enable real-time interactive brushing of data sets .