Transcription
2020 Philadelphia Defendant SurveyPrepared for The Pew Charitable Trusts by: Chintan Turakhia, SarahGlancey, and James NoackTable Of ContentsProject Overview. 2Sample Design. 2Target Population. 2Sampling Frame. 2Questionnaire/Letter Design and Formatting . 3Questionnaire Design. 3Letter and Postcard Design. 3Survey Formatting . 3Programming . 3Data Collection. 4Data Processing and Quality Control. 5Weighting . 5Weighting Procedures . 5Margin of Sampling Error. 8Response Rate. 8Deliverables . 9About SSRS. 9
Project OverviewThe Pew Charitable Trusts hired SSRS to conduct a study of Philadelphia residents who had civil legalcases adjudicated in Philadelphia Municipal Court in 2018, the latest year for which data was available.The survey’s goal was to better understand Philadelphia residents’ experience as defendants inPhiladelphia’s municipal court system. Defendants were the target population for this study.The 2020 Philadelphia Defendant Survey used a mixed-mode online and mail survey design. Datacollection occurred from Feb. 12 through April 27, 2020, and respondents had the option to complete thesurvey in English or Spanish. Statistical results were weighted to correct specific discrepancies based onthe sampling frame provided. The design effect for this survey is 1.17, and the margin of sampling errorf or the complete set of weighted data is plus or minus 6 percentage points.Details on the sampling, questionnaire design, data collection, processing, and weighting are discussedbelow.Sample DesignTarget PopulationThe target population for this study was Philadelphia residents who had civil legal cases adjudicated inPhiladelphia Municipal Court in 2018. The survey targeted defendants in debt claim lawsuits.Sampling FrameThe sampling frame for this study was defendants in debt claim lawsuits for cases adjudicated in 2018.Pew provided SSRS with the sample database. Pew compiled a list of names and addresses ofdef endants in debt claim lawsuits for the survey from the Philadelphia Municipal Court website.Once SSRS received the sample from Pew, it reduced the file to include only cases from 2018, removedany cases that did not have addresses, and excluded cases that involved trusts or funds, as well as anycase without a defendant. To maximize the contact and study participation rates, SSRS completed thef ollowing sample preparation steps:1. All sample records were run through the NCOA (national change of address) directory. SSRSupdated the sample database with the most recent respondent address based on this look-up.2. Given that the respondents must have resided in Philadelphia County at the time they weresurveyed, SSRS removed all sample records outside Philadelphia County from the samplingf rame.3. SSRS checked for duplicate sample records based on name and address and removed allduplicates.4. To customize mailings to include a Spanish-language version, SSRS flagged all sample recordsthat had a Hispanic surname.Once those steps were complete, SSRS selected a random 7,600 defendants who were mailed theinvitation letter, reminder postcard, and reminder survey packet.
Questionnaire/Letter Design and FormattingQuestionnaire DesignPew developed the questionnaire for this study. SSRS reviewed the questionnaire primarily to identifyproblems in the instrument that might increase respondent burden, cause respondents to refuse orterminate the interview, create problems with respondent comprehension, or pose practical challenges fora hard-copy questionnaire, such as complex skip patterns. Once the questionnaire was finalized, SSRSthen translated the instrument into Spanish.Letter and Postcard DesignPew researchers developed the text for the study invitation letter, reminder postcard, and nonresponderf ollow-up cover letter in consultation with SSRS. These mailing materials were based on similar Pewstudies (i.e., the Philadelphia Movers and Philadelphia Resident surveys). SSRS translated thesematerials into Spanish and formatted the letters and postcards to prepare them for mailing. SSRS sentPew the f inal letters for approval before printing and mailing the material to contacts.Survey FormattingSSRS was responsible for formatting the questionnaire into a self-administered paper instrument. Itf ocused on clarity of format for any skip logic and for overall comprehension of the questionnaire. SSRSalso made efforts in the design to (1) encourage cooperation by offering an easy-to-read, easy-tomaneuver hard copy and (2) reduce the potential for confusion and thereby produce the most accuratedata. SSRS formatted the survey in Word and then worked with its professional printing service. Papersurveys were printed in both English and Spanish and were sent to Pew for approval before materialswere printed and mailed to contacts.ProgrammingPrior to the field period, SSRS programmed the study into its Confirmit platform for web administration inboth English and Spanish. The program was optimized for administration via smartphone or other mobilehandheld devices. SSRS checked the program extensively to ensure that skip patterns followed thedesign of the questionnaire. The web program was checked on multiple devices, including desktopcomputers and handheld mobile devices, and on different web browsers to ensure consistent andoptimized visualization across devices and browsers. SSRS generated unique survey passwords thatwere assigned and provided via mail to potential respondents, who then accessed the web survey directlyusing those passwords. This also gave respondents the ability to return to their surveys later if they choseto suspend their interviews.
Data CollectionSSRS used a sequential web-mail mixed-mode methodology to conduct interviews for this study. Datacollection was conducted in English and Spanish. Eighty-eight percent of the surveys were completedonline, while 12% were completed via mail.All selected sample records received a one-page, single-sided study invitation letter. This letter wasprinted on Pew stationery and was addressed to the respondent name on file. For records flagged with aHispanic surname, the letter was printed double-sided, with one side in English and the other in Spanish.The text of this letter, developed in collaboration with Pew researchers, included a short web link for thesurvey and a PIN to access the online survey. The invitation letter included a 2 cash pre-incentive andof fered a 10 payment upon completion of the survey via a virtual gift card code. The 10 payment wasdisbursed soon after completion of the web survey.Two days after the invitation letter was mailed, all contacts were sent a reminder postcard. The purposeof this mailing was to remind potential respondents to reply to the initial mailing. The postcard did notcontain the survey web link or the target respondent’s PIN.Approximately two weeks after the study invitation letters were mailed, nonresponders were sentquestionnaire packets via first-class mail. This mail option ensured that we were able to reachrespondents who do not have internet access or were unable to complete the survey online. This mailingwas sent in a 6-by-9 envelope and contained: A personalized reminder letter printed in color on Pew stationery, explaining the nature of thesurvey.An eight-page questionnaire booklet in English or, for records flagged with a Hispanic surname,two eight-page questionnaire booklets (one in English and one in Spanish).A postage-paid business reply envelope.Respondents completing the survey via mail instead of online were given a 10 postpaid honorarium as acheck mailed after receipt and verification of completion of the mail questionnaire.To detect any questionnaire, sampling, or response rate issues, SSRS conducted the mailing in twophases. Phase 1 involved mailing up to 1,000 study invitation letters, reminder postcards, andquestionnaire packets. Within approximately two weeks of sending the Phase 1 study invitation letters,SSRS conducted a Phase 2 mailing for the remaining 6,600 cases. Phase 2 records received the samemailing structure as Phase 1 (an invitation letter, a reminder postcard, and a questionnaire packet). Table1 shows the schedule for when each mailing was sent out.When Phase 1 respondents initially began completing the survey, SSRS noticed a higher-than-expectedtermination rate at Q2 (Before we begin, were you sued in Philadelphia Municipal Court in 2018?). SSRSand Pew discussed this and decided to make an update to Q2. On March 2, the wording was updated toread: Before we begin, did you have a court case in Philadelphia Municipal Court in 2018? Furthermore,on March 16, we decided to update the wording again to remove the mention of 2018 (Before we begin,did you have a court case in Philadelphia Municipal Court?), with the hope of continuing to improve thescreen-in rate.
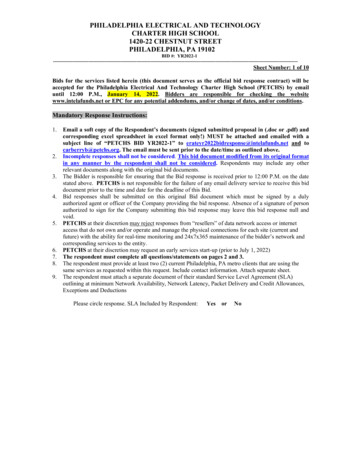
Table 1Contact ScheduleDateFeb. 12Feb. 14Feb. 28March 18March 20April 2MailingPhase 1 invitation letters mailedPhase 1 reminder postcards mailedPhase 1 survey packets mailedPhase 2 invitation letters mailedPhase 2 reminder postcards mailedPhase 2 survey packets mailedData Processing and Quality ControlData f rom both web and paper modes were combined and thoroughly cleaned with a computer validationprogram written by one of SSRS’s data processing programmers. This program established editingparameters in order to locate any errors, including data that did not follow skip patterns, out-of-rangevalues, and errors in data field locations. Back-coding was done for Q25 to sort any “other/specify”responses into prelisted categories where appropriate. And Q27 was fully coded using categoriesdeveloped from scratch.Af ter carrying out quality control procedures, SSRS provided Pew with a clean, processed, and fullylabeled and weighted final SPSS dataset, along with two banners of cross tabulations.WeightingSSRS worked with Pew researchers to determine weighting variables for this study based on theavailable frame data, which included whether a defendant was represented by an attorney, case type,case outcome, Philadelphia neighborhood, and amount sought for the case.Weighting ProceduresData was weighted so that it was representative of the target population of adults age 18 or older living inPhiladelphia who were recent debt claim defendants in Philadelphia Municipal Court. Weighting balancesthe demographic profile of the sample against target population parameters.To handle missing data among demographic variables, SSRS employed a technique called hot decking.Hot deck imputation randomly replaces the missing values of a respondent with those of another, similarrespondent without missing data. The replacement values are further determined by variables predictiveof nonresponse that are present in the entire file. SSRS used an SPSS macro detailed in “Goodbye,Listwise Deletion: Presenting Hot Deck Imputation as an Easy and Effective Tool for Handling MissingData” (Myers, 2011).
Weighting is accomplished using SPSSINC RAKE, an SPSS extension module that simultaneouslybalances the distributions of all variables using the GENLOG procedure.The data was weighted to the following parameters: defendant representation (yes or no), case outcome(won or won by default, judgment by agreement, lost, lost by default, not known, settled, withdrawn), casetype (auto/home remodeling repairs/bad check/commercial paper loans/faulty repairs/incompleteservice/other/real estate, consumer purchase, landlord/tenant-based small claim, motor vehicle, returnsecurity), neighborhood (Center City, North Philadelphia, Northeast Philadelphia, Northwest Philadelphia,Riverwards, South Philadelphia, and West Philadelphia), and amount sought ( 1,205.79 or less, 1,205.80- 2,236.67, 2,236.68- 4,229.27, and 4,229.28 or more).Table 2Raking DimensionsDimensionDef endant attorneyrepresentationCase outcomeValue labelYesNoWon and won by defaultDismissed for no serviceJudgment by agreementLostLost by defaultNot knownSettledWithdrawnCase typeConsumer purchaseMotor vehicleReturn securityAll othersAmount sought(divided into quarters) 1,205.79 or less 1,205.80- 2,236.67 2,236.68- 4,229.27 4,229.28 or morePhiladelphianeighborhoodCenter CityNorth PhiladelphiaNortheast PhiladelphiaNorthwest PhiladelphiaRiverwardsSouth PhiladelphiaWest Philadelphia
Table 3Population Parameters and Weighted and Unweighted Total SampleDistributionCharacteristicValue labelParameterUnweightedWeightedDef %89.3%92.6%Case outcomeWon and won by defaultDismissed for no serviceJudgment by agreementLostLost by defaultNot %7.2%2.2%37.2%19.3%4.1%8.1%Case typeConsumer purchaseMotor vehicleReturn securityAll 1.3%8.3%Amount sought(divided intoquarters) 1,205.79 or less 1,205.80- 2,236.67 2,236.68- 4,229.27 4,229.28 or 5.7%24.4%24.9%PhiladelphianeighborhoodCenter CityNorth PhiladelphiaNortheast PhiladelphiaNorthwest PhiladelphiaRiverwardsSouth PhiladelphiaWest 0.5%13.3%16.5%
Margin Of Sampling ErrorSpecialized sampling designs and post-data-collection statistical adjustments require analysis proceduresthat ref lect departures from simple random sampling. SSRS calculates the effects of these designf eatures so that an appropriate adjustment can be incorporated into tests of statistical significance whenusing this data. The so-called design effect, or deff, represents the loss in statistical efficiency that resultsf rom complex sample designs and systematic nonresponse. SSRS calculates the composite design effectf or a sample of size n, with each case having a weight, w, as:𝑑𝑒𝑓𝑓 𝑛 𝑤2( 𝑤 ) 2The design effect for this survey was 1.17 overall.In a wide range of situations, the adjusted standard error of a statistic should be calculated by multiplyingthe usual f ormula by the square root of the design effect ( deff ) and the square root of the finitepopulation correction ( fpc ). Thus, the formula for computing the 95% confidence interval around anestimate, 𝑝̂, is:𝑝̂ 1.96 𝑑𝑒𝑓𝑓 𝑓𝑝𝑐 𝑝 (1 𝑝)𝑛The survey’s margin of error is the largest 95% confidence interval for any estimated proportion based onthe total sample—one around 50%. For example, the margin of error for the total sample is plus or minus6 percentage points. This means that in 95 out of every 100 samples using the same methodology,estimated proportions based on the entire sample will be no more than 6 p ercentage points away fromtheir true values in the population. It is important to remember that sampling fluctuations are only onepossible source of error in a survey estimate. Other sources, such as measurement error, may contributeadditional error of greater or lesser magnitude.Response RateTable 4 reports the disposition of all sampled records that were contacted. The response rate estimatesthe share of all eligible people who were ultimately interviewed. Response rates are computed accordingto American Association for Public Opinion Research standards.*The response rate for this study was 13.5%.*The American Association for Public Opinion Research, “Standard Definitions: Final Dispositions of Case Codes and Outcome Ratesfor Surveys,” 9th edition (2016).
Table 4Sample DispositionDisposition1. Complete (I)N3082. Eligible, noninterview (R)Ref usal and break-off35353. Unknown eligibility, noninterview (UH)Nothing ever returnedRef used, unknown if eligible6,4586,410484. Not eligible, returned (IN)Did not have a case in Philadelphia Municipal Court in 2018UndeliverableIneligible respondent (deceased, duplicate respondent, etc.)7992385529Total contacted7,600e (I R)/(I R IN)RR3 I/[I R (e*UH)]30.0%13.5%DeliverablesSSRS provided the following deliverables to Pew: Formatted, clean questionnaires (for both web and mail versions)A f inal, clean, fully labeled, weighted SPSS data fileTwo banners of cross tabulations run on final weighted dataA f inal SPSS data file of those who agreed to be re-contactedTopline resultsMethodology reportAbout SSRSSSRS is a f ull-service public opinion research firm managed by a core group of industry-leadingprof essionals. SSRS service offerings include the Omnibus Survey, Probability Panel, and other onlinesolutions as well as custom research programs—all driven by a central commitment to methodologicalrigor. The SSRS team is renowned for its multimodal approach, as well as its sophisticated andproprietary sample designs. Typical projects for the company include complex strategic, tactical, and
public opinion initiatives in the U.S. and in more than 40 countries worldwide. Please visit ssrs.com forf urther inf ormation.
A postage-paid business reply envelope. Respondents completing the survey via mail instead of online were given a 10 postpaid honorarium as a check mailed after receipt and verification of completion of the mail questionnaire. To detect any questionnaire, sampling, or response rate issues, SSRS conducted the mailing in two phases.
![[2020] JMSC Civ 37 IN THE SUPREME COURT OF JUDICATURE OF JAMAICA IN THE .](/img/22/neil-2c-20george-20v-20the-20attorney-20general-20of-20jamaica-2c-20office-20of-20the-20utilities-20.jpg)
![Prekindergarten Head Start Application [Initial Screening]](/img/43/head-start-application.jpg)