Transcription
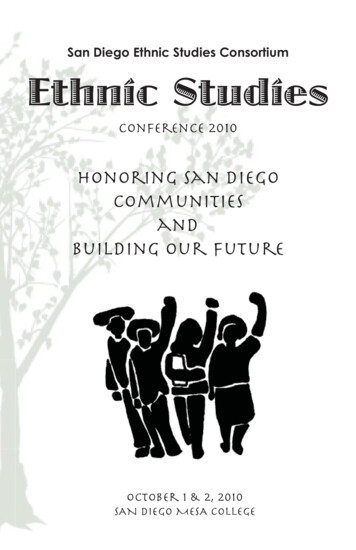
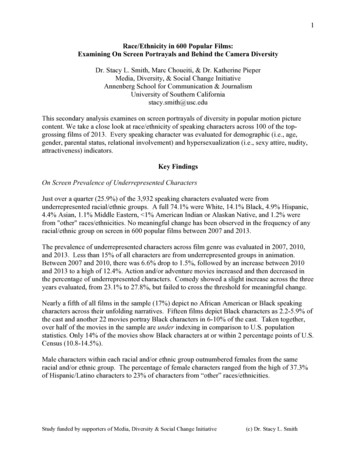
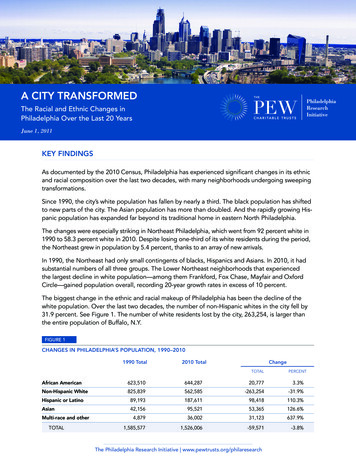
A City TransformedThe Racial and Ethnic Changes inPhiladelphia Over the Last 20 YearsJune 1, 2011Key FindingsAs documented by the 2010 Census, Philadelphia has experienced significant changes in its ethnicand racial composition over the last two decades, with many neighborhoods undergoing sweepingtransformations.Since 1990, the city’s white population has fallen by nearly a third. The black population has shiftedto new parts of the city. The Asian population has more than doubled. And the rapidly growing Hispanic population has expanded far beyond its traditional home in eastern North Philadelphia.The changes were especially striking in Northeast Philadelphia, which went from 92 percent white in1990 to 58.3 percent white in 2010. Despite losing one-third of its white residents during the period,the Northeast grew in population by 5.4 percent, thanks to an array of new arrivals.In 1990, the Northeast had only small contingents of blacks, Hispanics and Asians. In 2010, it hadsubstantial numbers of all three groups. The Lower Northeast neighborhoods that experiencedthe largest decline in white population—among them Frankford, Fox Chase, Mayfair and OxfordCircle—gained population overall, recording 20-year growth rates in excess of 10 percent.The biggest change in the ethnic and racial makeup of Philadelphia has been the decline of thewhite population. Over the last two decades, the number of non-Hispanic whites in the city fell by31.9 percent. See Figure 1. The number of white residents lost by the city, 263,254, is larger thanthe entire population of Buffalo, N.Y.FIGURE 1Changes in Philadelphia’s Population, 1990–20101990 Total2010 TotalChangeTotalPercentAfrican American623,510644,28720,7773.3%Non-Hispanic White825,839562,585-263,254-31.9%Hispanic or 6-59,571-3.8%Multi-race and otherTotalThe Philadelphia Research Initiative www.pewtrusts.org/philaresearch
A City TransformedThe Racial and Ethnic Changes in Philadelphia Over the Last 20 YearsThe city’s African-American population grew by 3.3 percent from 1990 to 2010, a percentagethat suggests relative stability. But during that period, there was a significant shift in the blackpopulation, away from the core areas of North and West Philadelphia to Southwest Philadelphia,Overbrook, the Lower Northeast and elsewhere. For example, the number of blacks in zip code19120—which includes the neighborhoods of Olney and Feltonville and abuts Montgomery County—rose from 9,786 in 1990 to 33,209 in 2010, an increase of 239 percent.During the two decades, the city’s Hispanic population, which swelled by 110 percent, moved beyond the North Fifth Street corridor, that community’s longtime social and commercial focus. In fact,the number of Hispanics in the neighborhoods along the corridor changed little during the 20-yearperiod. The big growth occurred elsewhere, throughout the lower parts of Northeast Philadelphiaand in sections of South Philadelphia.The expansion of the Asian population, up 127 percent, was more uniform citywide, with the largestincreases recorded in parts of Northeast Philadelphia and South Philadelphia as well as the University City section of West Philadelphia.Over 20 years, the city as a whole lost 3.8 percent of its population, though all of the decline was inthe 1990s, with a 0.6 percent increase in the 2000s. The headcount in Center City rose 42.9 percent. Neighborhoods along the North Broad Street corridor—from Susquehanna Avenue north tothe city line—declined by 17.7 percent. More modest reductions were recorded in West Philadelphia, Southwest Philadelphia, Northwest Philadelphia and South Philadelphia.Several neighborhoods, defined in this report by zip code, were all but remade in ethnic and racialterms: Port Richmond (19134) had 7,112 Hispanics in 1990; two decades later, it had 26,807. The Elmwood section of Southwest Philadelphia (19142) saw its black population rise from6,586 to 22,518, its white population fall from 21,144 to 2,598. In Fairmount North (19121), which includes Brewerytown, the white population nearlyquadrupled, going from 1,490 to 5,524.All of the numbers in this report are based on a counting method used by the Census in which allHispanics or Latinos, regardless of race, are counted solely as people of Hispanic origin. In thiscounting regimen, “white” means non-Hispanic white and “black” means African American.The Philadelphia Research Initiative www.pewtrusts.org/philaresearch2
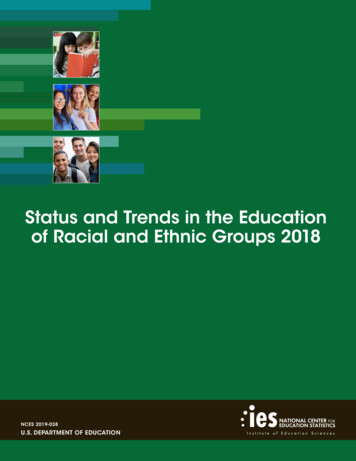
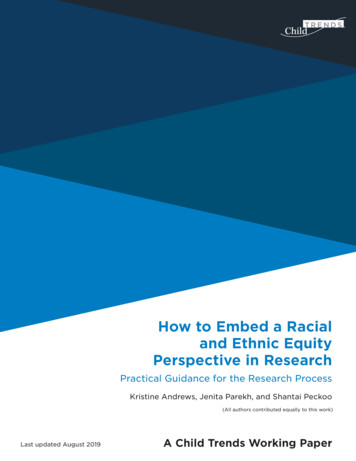
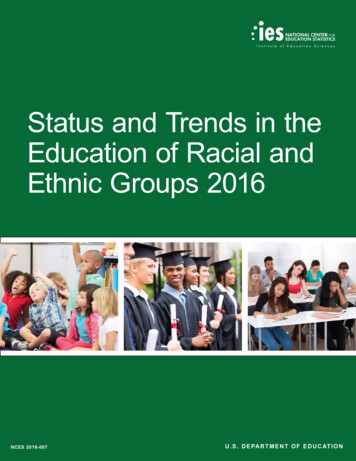
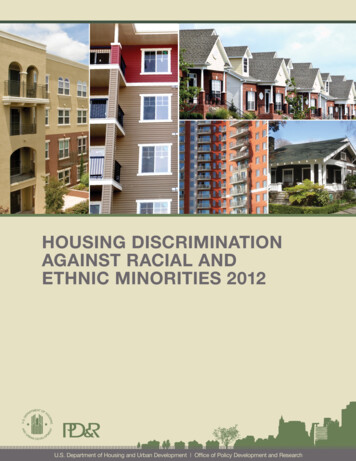
A City TransformedThe Racial and Ethnic Changes in Philadelphia Over the Last 20 YearsThe Decline in the White PopulationOver the course of two decades, the white population of Philadelphia fell by 263,254 or 31.9 percent. Whites went from being 52.1 percent of the city’s population in 1990 to 36.9 percent in 2010.See Figure 2. More of the drop (181,444) occurred in the 1990s than in the 2000s (81,810).In 1990, Philadelphia was a city understood largely in terms of white and black. At the time, it was amajority-white city with a large black minority and small groups of Hispanics and Asians. Two decades later, it is a plurality-black city with a large but dwindling white minority and rapidly expanding contingents of Hispanics and Asians.The map in Figure 3 shows the changes in the white population by zip code. In 11 of the city’s 46residential zip codes, the number of whites fell by at least half. The largest drops were in Olney,Overbrook, Oak Lane, Elmwood and Eastwick; in those areas, the declines exceeded 75 percent.Areas in which the white declines were below the citywide average include Northwest Philadelphiaand much of the Far Northeast. For the data on which Figure 3 is based, see Appendix Table 1.What makes the magnitude of the citywide decline in the white population all the more striking isthat it happened even as whites were becoming substantially more numerous in the central part ofPhiladelphia—Center City and nearby neighborhoods, 11 zip codes in all.The biggest increases in percentage terms came in the gentrifying areas just north of Center City,including Northern Liberties (up 104 percent) and Fairmount North (up 271 percent).FIGURE 2The Changing Racial and Ethnic Makeup of Philadelphia, ISPANICOR LATINO5.6%OTHER0.3%ASIAN2.7%HISPANICOR LATINOMULTI-RACEAND OTHER2.3%12.3%ASIAN6.3%The Philadelphia Research Initiative www.pewtrusts.org/philaresearch3
A City TransformedThe Racial and Ethnic Changes in Philadelphia Over the Last 20 YearsFIGURE 3Changes in Philadelphia’s White Population, 1990–2010 Increased 10 percent or moreIncreased 0 to 9.99 percentDecreased 0 to 9.99 percent–19116NORTHEAST –BUSTLETON NORTH,SOMERTONDecreased 10 to 29.99 percentDecreased 30 to 49.99 percentDecreased 50 percent or more19118CHESTNUT ST –FOX CHASE19126OAK LANE19120OLNEY,FELTONVILLE19140NICETOWN19129EAST FALLS19132NORTH PHILA. –WEST19133NORTHPHILA. –EAST19121FAIRMOUNT NORTH,BREWERYTOWN19151OVERBROOK19134PORT RICHMOND19136NORTHEAST –HOLMESBURG19135NORTHEAST –TACONY19124NORTHEAST –FRANKFORDMANAYUNK19152NORTHEAST –RHAWNHURST19149NORTHEAST –MAYFAIR,OXFORD CIRCLE19141LOGAN19144GERMANTOWN19131WYNNEFIELD –WEST PARK19114NORTHEAST –TORRESDALE SOUTH19150CEDARBROOK19119MOUNT AIRY1912719137NORTHEAST –BRIDESBURG19125KENSINGTON – FISHTOWN1912219139WEST PHILA. –WEST MARKET19143SW PHILA. –KINGSESSING19142SW PHILA. –ELMWOOD19154NORTHEAST –TORRESDALE NORTH19115NORTHEAST –BUSTLETON SOUTH19104WEST PHILA. –UNIVERSITYCITY19130FAIRMOUNTSOUTHNORTH PHILA. – YORKTOWN19123NORTH PHILA. – NORTHERN LIBERTIESCENTER CITY – WEST1910319102CENTER CITY – WEST191071910619146SOUTH PHILA. –SCHUYLKILL19145SOUTH PHILA. –WESTCENTER CITY – WASHINGTON SQUARECENTER CITY – SOCIETY HILL19147SOUTH PHILA. – BELLA VISTA19148SOUTH PHILA. –EAST19153EASTWICKThe Philadelphia Research Initiative www.pewtrusts.org/philaresearch4
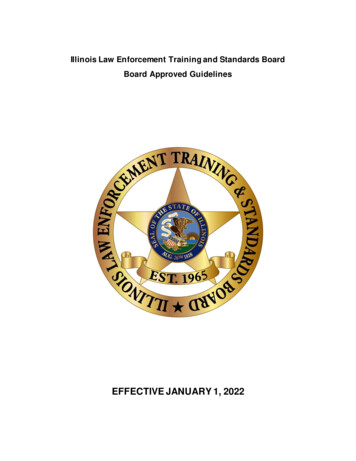
5A City TransformedThe Racial and Ethnic Changes in Philadelphia Over the Last 20 YearsThe New Northeast PhiladelphiaIn no part of the city have the changes over the last 20 years been more pronounced than Northeast Philadelphia, particularly the Lower Northeast.As of 1990, according to the Census count, Northeast Philadelphia had 409,902 residents, 377,169of whom were white. In 2010, it had 432,073 residents, 252,022 of whom were white. Over those 20years, Northeast Philadelphia went from 92 percent to 58.3 percent white.During the same period, the black population grew in the Northeast from 3.4 percent of the wholeto 18 percent, the Hispanic population from 2.3 percent to 13.9 percent, the Asian population from2.1 percent to 7.3 percent. See Figure 4. In racial and ethnic terms, the Northeast became more likethe rest of the city than it had been and less like a separate place.For the purposes of this report, the Northeast is defined as the 11 zip codes starting with Frankfordand Bridesburg on the south and moving to the north and east from there.The influx of blacks, Hispanics and Asians in Northeast Philadelphia was more than enough to offsetthe departure of whites. From 1990 to 2010, the overall population of the Northeast grew by 5.4percent even as the city as a whole was shrinking by 3.8 percent.In some parts of the Far Northeast, the racial and ethnic changes were relatively modest. Zip code19114 (Torresdale South), for instance, went from being 94 percent white in 1990 to 80.1 percentwhite in 2010. The total percentage of blacks, Hispanics and Asians grew from 5.9 percent to 18.2.But in other neighborhoods such as Frankford, Fox Chase, Mayfair and Oxford Circle, there was amuch broader transformation. And these areas are the ones where theoverall population grew the fastest.FIGURE 4Racial and Ethnic Changes in Northeast Philadelphia,1990–20101990TotalAfrican 258.3%-125,147-33.2%Hispanic or 8.7%409,902432,07322,1715.4%Non-Hispanic WhiteMulti-race and otherTotalThe Philadelphia Research Initiative www.pewtrusts.org/philaresearch
6A City TransformedThe Racial and Ethnic Changes in Philadelphia Over the Last 20 YearsFox Chase (zip code 19111) provides the most representative example of what has been happeningacross Northeast Philadelphia, and Frankford (19124) the most dramatic. See Figure 5.Two decades ago, Fox Chase was 96 percent white. Over the next 20 years, it experienced a net decline of 20,068 white residents, leaving it 54.1 percent white in 2010. The overall population, though,grew by 11.7 percent, due to big increases among blacks, Hispanics and Asians.Frankford, which grew by 11.5 percent over 20 years, underwent a broader transformation. It experienced a 72.3 percent decline in what had been its majority white population, from 50,092 to 13,875.At the same time, the black population went from 5,204 to 26,230 and the Hispanic population from3,127 to 22,083. In 1990, the black and Hispanic populations combined accounted for 13.9 percentof the population in 19124. In 2010, they accounted for 72.2 percent.19111FIGURE 519124The Transformation of Two Northeast PhiladelphiaNeighborhoodsFox Chase1990Zip Code 19111TotalAfrican 1%-20,068-37.0%Hispanic or 3,0286,61511.7%Non-Hispanic WhiteMulti-race and otherTotalFrankford1990Zip Code 19124TotalAfrican AmericanNon-Hispanic -36,217-72.3%Hispanic or 60,00966,9326,92311.5%Multi-race and otherTotalThe Philadelphia Research Initiative www.pewtrusts.org/philaresearch
7A City TransformedThe Racial and Ethnic Changes in Philadelphia Over the Last 20 YearsThe Struggling North BROAD Street CorridorOver the course of 20 years, much of the city’s population decline came in six zip codes along ornear North Broad Street north of Temple University. Those zip codes include much of North Philadelphia, Nicetown, Logan, Oak Lane and East Germantown.In that period, this relatively small piece of the city lost 42,128 residents (17.7 percent of its 1990population). It lost 33,872 African Americans (19.3 percent), 11,214 whites (62.2 percent) and 867Asians (21.8 percent). Its Hispanic population grew, but only by 1,105 (2.8 percent). See Figure 6.The biggest overall decrease in this North Broad Street corridor, 25 percent, came in zip code19132, which includes much of the western half of North-Central Philadelphia.Economically, this corridor is one of the poorest parts of Philadelphia. Census data from 2005through 2009 shows that the corridor includes three of the four zip codes with the lowest averagefamily incomes in the city—Nicetown (19140), North Philadelphia West (19132) and North Philadelphia East (19133), which is the poorest by far.As was the case in many struggling parts of the city, the population decline in this corridor was lessin the 2000s (8 percent) than in the 1990s (10.5 percent). And the areas just to the south, zip codes19121 and 19122, actually grew during the first decade of the 21st century.FIGURE 6Changes along the North Broad Street Corridor inNorth Philadelphia, 1990–20101990TotalAfrican 75,90974.0%142,03772.6%-33,872-19.3%Non-Hispanic White18,0397.6%6,8253.5%-11,214-62.2%Hispanic or 95,685-42,128-17.7%AsianMulti-race and otherTotalThe Philadelphia Research Initiative www.pewtrusts.org/philaresearch
A City TransformedThe Racial and Ethnic Changes in Philadelphia Over the Last 20 YearsThe Fluid Black PopulationAt first glance, the African-American population appears to have been the one relatively stableelement in Philadelphia’s ethnic and racial landscape over the last 20 years, growing by 3.3 percentwhile the other groups were undergoing much more dramatic changes in size.But that stability is only numerical. There was considerable movement within Philadelphia’s blackpopulation. As had been the case with other groups in years past, the African-American communitywas shifting away from the city’s core and toward its periphery.Consider these examples. In zip code 19120, which includes Olney and borders MontgomeryCounty, the black population rose from 9,786 in 1990 to 33,209 in 2010, an increase of 239 percent.In zip code 19142, which includes the Elmwood section of Southwest Philadelphia and bordersDelaware County, the number of black residents started the period at 6,586 and ended at 22,518,up 245 percent. There were increases throughout Northeast Philadelphia as well.In other parts of the city, the black population was falling steeply—and not just in North-CentralPhiladelphia. In Fairmount North (19121), the African-American headcount dropped from 44,294to 28,683 (35.2 percent). In the Kingsessing section of Southwest Philadelphia (19143), it fell from71,694 to 54,390 (23.4 percent).The changes are depicted by zip code in Figure 7. The map shows, in terms of percentage points,how the African-American proportion of the total population in each area rose or fell. For example,a zip code that was 35 percent black in 1990 and 40 percent black in 2010 would be portrayed asbeing up 5 percentage points.As the map shows, the black share of the population grew by more than 10 percentage points in10 of the city’s 46 residential zip codes—and fell by more than 10 percentage points in four of them.The changes in the rest of the city were more modest. For the data on which the map is based, seeAppendix Table 2.Overbrook (19151) had one of the biggest increases in the African-American share of population. In1990, this middle-class neighborhood on the city’s western border was 43.6 percent black and 52.2percent white. In 2010, it was 82.7 percent black and 10.6 percent white. Most of those changes occurred during the 1990s rather than the 2000s.In contrast is the Schuylkill district of South Philadelphia (19146), an area that has undergone somegentrification in recent years. In 1990, the neighborhood had 25,257 black residents accounting for65 percent of the population; 20 years later, it had 17,965 black residents representing 50.9 percentof the population.The Philadelphia Research Initiative www.pewtrusts.org/philaresearch8
A City TransformedThe Racial and Ethnic Changes in Philadelphia Over the Last 20 YearsFIGURE 7Changes in the African-American Percentage of Philadelphia’s Population, 1990–2010Increased 20 percentage points or more Increased 10 to 19.99 percentage pointsIncreased 0 to 9.99 percentage points19116NORTHEAST –BUSTLETON NORTH,SOMERTONDecreased 0 to 9.99 percentage points–Decreased 10 to 19.99 percentage pointsDecreased 20 percentage points or more19118CHESTNUT ST –FOX CHASE19126OAK LANE19120OLNEY,FELTONVILLE19140NICETOWN19129EAST FALLS19132NORTH PHILA. –WEST19133NORTHPHILA. –EAST19121FAIRMOUNT NORTH,BREWERYTOWN19151OVERBROOK19134PORT RICHMOND19136NORTHEAST –HOLMESBURG19135NORTHEAST –TACONY19124NORTHEAST –FRANKFORDMANAYUNK19152NORTHEAST –RHAWNHURST19149NORTHEAST –MAYFAIR,OXFORD CIRCLE19141LOGAN19144GERMANTOWN19131WYNNEFIELD –WEST PARK19114NORTHEAST –TORRESDALE SOUTH19150CEDARBROOK19119MOUNT AIRY1912719137NORTHEAST –BRIDESBURG19125KENSINGTON – FISHTOWN1912219139WEST PHILA. –WEST MARKET19143SW PHILA. –KINGSESSING19142SW PHILA. –ELMWOOD19154NORTHEAST –TORRESDALE NORTH19115NORTHEAST –BUSTLETON SOUTH19104WEST PHILA. –UNIVERSITYCITY19130FAIRMOUNTSOUTHNORTH PHILA. – YORKTOWN19123NORTH PHILA. – NORTHERN LIBERTIESCENTER CITY – WEST1910319102CENTER CITY – WEST191071910619146SOUTH PHILA. –SCHUYLKILL19145SOUTH PHILA. –WESTCENTER CITY – WASHINGTON SQUARECENTER CITY – SOCIETY HILL19147SOUTH PHILA. – BELLA VISTA19148SOUTH PHILA. –EAST19153EASTWICKThe Philadelphia Research Initiative www.pewtrusts.org/philaresearch9
A City TransformedThe Racial and Ethnic Changes in Philadelphia Over the Last 20 YearsHispanics, Asians and the Rest of the CityNearly every neighborhood in the city was more Hispanic and more Asian in 2010 than it had beenin 1990. This was not surprising considering that both populations more than doubled during theperiod, with Hispanics up 110 percent and Asians up 127 percent. These changes are in keepingwith national trends; across the country, the Hispanic population rose 125 percent and the Asianpopulation 114 percent.For Hispanics in Philadelphia, nearly two-thirds of whom are Puerto Rican, the largest increasescame in areas, including the Lower Northeast, that are not far removed from the Fifth Street commercial corridor in the traditional heart of Latino eastern North Philadelphia. The zip codes thatgained the most Hispanics and Latinos from 1990 to 2010 were Frankford (19124), Port Richmond(19134), Olney (19120), Fox Chase (19111) and Oxford Circle/Mayfair (19149). See Appendix Table3. There were big increases in parts of South Philadelphia as well.In fact, only four zip codes in the city had fewer Hispanics in 2010 than in 1990. One is 19133, whichincludes the Fifth Street corridor, and another is 19122, just to the south. The other two are 19130(Fairmount South) and 19141 (Logan).Port Richmond, like Frankford, underwent a broad racial and ethnic transformation during thesetwo decades, due largely to an influx of Hispanics. In 1990, the 19134 zip code had 58,605 peopleof whom 85.9 percent were white, 12.3 percent were Hispanic and 1.7 percent black. Twenty yearslater, with a total population of 60,760, it was 35.8 percent white, 44.1 percent Hispanic and 16.8percent black. The Hispanic population grew from 7,112 to 26,807.Among Asians, the largest increases came in South Philadelphia east of Broad Street (19148); twosections of Northeast Philadelphia, Oxford Circle/Mayfair (19149) and Fox Chase (19111); and theUniversity City (19104) section of West Philadelphia. See Appendix Table 4. The Chinese are thelargest group of Asians in the city, followed by Indians, Vietnamese and Koreans.Other parts of the city experienced substantial change as well.From 1990 to 2010, West and Southwest Philadelphia lost 9.5 percent of their population, withgrowth in the Hispanic (99.8 percent) and Asian communities (71.3 percent) helping offset a 51.1percent decline among whites.South Philadelphia, which was down 4.4 percent overall between 1990 and 2010, became lesswhite and less black, more Hispanic and more Asian. The white share of the South Philadelphiapopulation fell from 63 percent to 51.8 percent while the black share dropped from 30.6 percent to25.8 percent. At the same, the Hispanic share grew from 2.2 percent to 7.7 percent, the Asian from3.9 percent to 12.5 percent.Northwest Philadelphia, which lost 8.6 percent of its population, saw relatively little racial/ethnicchange. In both 1990 and 2010, blacks accounted for slightly more than 50 percent of the population in 1990 and whites slightly more than 40 percent.The Philadelphia Research Initiative www.pewtrusts.org/philaresearch10
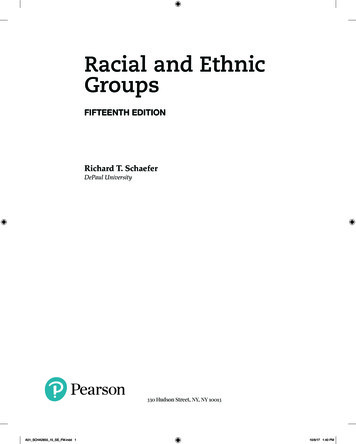
A City Transformed11The Racial and Ethnic Changes in Philadelphia Over the Last 20 YearsAppendix Table 1ZipCodeChanges in Philadelphia’s White Population by Zip Code, 1990-2010Neighborhood1990White Population2010White PopulationPopulationChangePercentChange19102Center City – West3,1873,72553816.9%19103Center City – West15,28016,5981,3188.6%19104West Phila. – University City17,98518,1651801.0%19106Center City – Society Hill6,3028,8422,54040.3%19107Center City – Washington Square6,4068,8532,44738.2%19111Northeast – Fox Chase54,16534,097-20,068-37.1%19114Northeast – Torresdale South29,29924,529-4,770-16.3%19115Northeast – Bustleton South29,13625,013-4,123-14.2%19116Northeast – Bustleton North, Somerton30,45125,158-5,293-17.4%19118Chestnut Hill8,4247,281-1,143-13.6%19119Mount Airy10,0948,056-2,038-20.2%19120Olney, Feltonville35,7425,597-30,145-84.3%19121Fairmount North, Brewerytown1,4905,5244,034270.7%19122North Phila. – Yorktown3,9576,1652,20855.8%19123North Phila. – Northern Liberties2,4985,0832,585103.5%19124Northeast – Frankford50,09213,875-36,217-72.3%19125Kensington, Fishtown21,87916,579-5,300-24.2%19126Oak Lane4,114966-3,148-76.5%19127Manayunk19128 Roxborough19129 East ,1125,342-1,770-24.9%19130Fairmount South13,01715,1662,15116.5%19131Wynnefield – West Park10,0065,836-4,170-41.7%19132North Phila. – West63694831249.1%19133North Phila. – East1,925734-1,191-61.9%19134Port Richmond49,75521,747-28,008-56.3%19135Northeast – Tacony31,13420,046-11,088-35.6%19136Northeast – Holmesburg33,73925,436-8,303-24.6%19137Northeast – Bridesburg8,2307,656-574-7.0%19138Germantown East1,6271,091-536-32.9%19139West Phila. – West 4,312-74.2%19141Logan3,9261,588-2,338-59.5%19142SW Phila. – Elmwood21,1442,598-18,546-87.7%19143SW Phila. – 22-24.0%19145South Phila. – West31,15420,448-10,706-34.4%19146South Phila. – Schuylkill11,77912,3675885.0%19147South Phila. – Bella Vista25,18623,804-1,382-5.5%19148South Phila. – East42,66130,389-12,272-28.8%19149Northeast – Mayfair, Oxford 2%19152Northeast – -76.4%36,03528,585-7,450-20.7%19153 Eastwick19154Northeast Phila. – Torresdale North-129-2.0%
12A City TransformedThe Racial and Ethnic Changes in Philadelphia Over the Last 20 YearsAppendix Table 2Changes in the African-American percentage of Philadelphia’s Population by Zip Code, 010TotalPopulationPercentage BlackBlackPopulationTotalPopulationPercentage BlackChange inPercentagePoints19102Center City – West2303,6266.3%2724,8705.6%19103Center City – t Phila. – University nter City – Society Hill-1.719107Center City – Washington %2,42316,48314.7%2.8Northeast – Fox ast – Torresdale South77431,1982.5%2,72930,6198.9%6.419115Northeast – Bustleton South35431,3401.1%1,97633,4915.9%4.819116Northeast – Bustleton North, ut Hill1,1079,81711.3%1,5809,74316.2%4.919119Mount ey, 121Fairmount North, 19122North Phila. – orth Phila. – Northern 4Northeast – 01.5%19125 Kensington, Fishtown19126Oak -0.919128 Roxborough1,27736,5723.5%2,49235,5567.0%3.519129 East Fairmount ld – West h Phila. – th Phila. – East12,56332,60838.5%9,25826,18235.4%-3.219134Port theast – ast – Northeast – n t Phila. – West Logan31,32938,53981.3%26,79831,66684.6%3.319142SW Phila. – Elmwood6,58629,16722.6%22,51829,37476.7%54.119143 SW Phila. – .919145South Phila. – h Phila. – 9147South Phila. – Bella h Phila. – t – Mayfair, Oxford Northeast – 26.4%4.319153 Eastwick19154Northeast Phila. – Torresdale North
A City Transformed13The Racial and Ethnic Changes in Philadelphia Over the Last 20 YearsAppendix Table 3ZipCodeChanges in Philadelphia’s Hispanic Population by Zip Code, 1990-2010Neighborhood19102Center City – West19103Center City – West19104West Phila. – University City191061990Hispanic Population822010Hispanic %146.1%4029905881,1042,02992583.7%Center City – Society Hill136372236173.2%19107Center City – Washington Square350973623177.8%19111Northeast – Fox Chase9328,4817,548810.1%19114Northeast – Torresdale South4591,6671,208263.2%19115Northeast – Bustleton South4421,7661,324299.6%19116Northeast – Bustleton North, Somerton5771,561983170.4%19118Chestnut Hill149324175118.0%19119Mount Airy115.2%19120Olney, Feltonville19121Fairmount North, %6061,20459898.5%North Phila. – Yorktown7,0695,981-1,088-15.4%North Phila. – Northern Liberties1,1241,205817.2%19124Northeast – Frankford3,12722,08318,956606.2%19125Kensington, Fishtown1,4683,5792,111143.8%19126Oak Lane39763623960.2%19127Manayunk5314693174.6%19128 Roxborough4091,090681166.4%19129 East Falls17734116492.8%-28.3%19130Fairmount South2,0591,476-58319131Wynnefield – West Park5261,01649093.0%19132North Phila. – West3961,030634160.3%19133North Phila. – East17,63715,599-2,038-11.6%19134Port Richmond7,11226,80719,695276.9%19135Northeast – Tacony3735,3014,9281320.5%19136Northeast – Holmesburg1,2724,4493,177249.7%19137Northeast – Bridesburg74576502674.5%19138Germantown East39368929675.3%19139West Phila. – West Market19140Nicetown19141Logan19142SW Phila. – Elmwood19143SW Phila. – 6.9%Germantown8051,44063578.8%19145South Phila. – West8311,9601,129135.8%19146South Phila. – Schuylkill5431,6381,095201.5%19147South Phila. – Bella Vista1,1523,6912,539220.4%19148South Phila. – East1,3365,5734,237317.1%19149Northeast – Mayfair, Oxford 3.7%19151Overbrook44982037182.7%19152Northeast – Rhawnhurst5892,7932,204374.0%19153 heast Phila. – Torresdale North
A City Transformed14The Racial and Ethnic Changes in Philadelphia Over the Last 20 YearsAppendix Table 4ZipCodeChanges in Philadelphia’s Asian Population by Zip Code, 1990-2010Neighborhood19102Center City – West19103Center City – West19104West Phila. – University City19106Center City – Society Hill19107Center City – Washington Square19111Northeast – Fox Chase19114Northeast – Torresdale South191151911619118Chestnut Hill19119Mount Airy19120Olney, Feltonville191211990Asian Population2010Asian 171,17555890.4%Northeast – Bustleton South1,3674,0902,723199.2%Nort
the neW northeAst PhilAdelPhiA In no part of the city have the changes over the last 20 years been more pronounced than North- east Philadelphia, particularly the Lower Northeast. As of 1990, according to the Census count, Northeast Philadelphia had 409,902 residents, 377,169 of whom were white.