Transcription
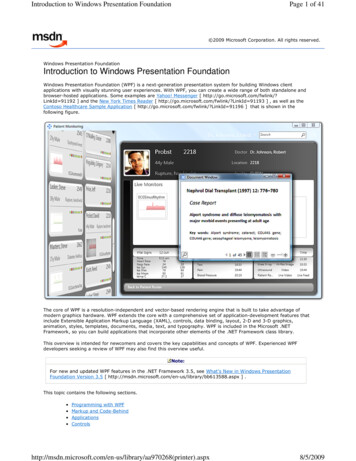
May Commission PresentationDirector’s ReportRebecca Hupp A.A.E.Boise Airport DirectorMAY 3, 2018
April Runway Closures April 5: 10R/28L, 10:00 a.m. – 11:00 a.m.Lighting maintenance April 11: 10L/28R, 11:45 a.m. – 5:00 p.m.Survey work and maintenance April 16: 10L/28R, 11:30 a.m. – 12:30 p.m.Placement of barricades for TWY A construction April 26: 10L/28R, 6:00 a.m. – 11:30 a.m.Sweeping operations for FOD removalRunway 28R is currently closed to landing aircraft as part ofthe construction safety risk management plan, and RWY10L/28R will be closed for all operations May 14 - 28 forconstruction activity in the runway safety area.
Taxiway A Rehab and Runway 28RSafety Area Improvement Project Phase 1 – Complete. RehabilitatedTWY A between TWY D and M. Phase 2 – In progress, projectedcompletion is mid May. Taxiway Aclosed between Taxiways C and N Phase 3 – In progress, projectedcompletion is early may 2018. Taxiway Aclosed between TWY M and customsbuilding. Intersection of Taxilane N andA closed Phase 4 – Extended Runway SafetyArea at 28R. Project to begin atcompletion of Phase 2, should lastapproximately 2 weeks
Southwest Began Service to San Jose Southwest’s inaugural flightwas April 8, 2018 Nonstop service to San Jose One flight daily Adds competition to route,also served by Alaska
Master Plan Update Technical Advisory Committeereviewed preferred alternatives Public open house was onMay 1, 2018 Fourth and final public openhouse Approximately 40 peopleattended
Tranquil Terminus The airport participated in afull scale infectious diseaseexercise conducted by U.S.Health and Human Services Coordinated arrival anddeparture of Boeing 747 Worked with local agenciesto execute drill
United Way Book Drive The Boise Airportparticipated in the bookdrive April 9-13 Our partner, Paradies, wasable to donate nearly 50books A total of 86 books weredonated by airportemployees and partners
Delaware North: The Last Straw To reduce plastic waste,airport restaurants will nolonger drop a straw in drinks Straws will be availableupon request Straws will be compostable,removing all plastic straws
Top 10 Operating Revenue DescriptionFY 2018FY 2017 Change% ChangeParking Lot 5,461,327 5,143,658 317,6696%Rental Car Concession 2,113,016 2,162,290 (49,274)-2%Industrial Land Rent 1,794,203 1,712,722 81,4815%Terminal Rent – Airlines 1,743,713 1,847,646 (103,933)-6%Signatory Airline Landing Fees 1,459,819 1,524,727 (64,908)-4%Terminal Concession – Food/Beverage 571,053 523,753 47,3009%Terminal Concession – Retail 490,323 431,397 58,92614%Landings/Freight 296,862 373,257 (76,395)-20%Terminal Rent – Non airline 278,196 244,908 33,28814%Employee Parking 254,419 203,443 50,97625%Total Top 10 Operating Revenue 14,462,931 14,167,801 295,130--Other Operating Revenue 1,489,660 1,365,832 123,828--Total Operating Revenue 15,952,591 15,533,633 418,9583%
Top 10 Operating Expenses Description FY 2018FY 2017 Change% ChangePersonnel 3,708,758 3,558,316 150,4424%Fire Service 1,385,486 1,266,575 118,9119%Policing Service 1,288,107 1,263,046 25,0612%Parking Management 719,279 683,808 35,4715%Indirect Cost Reimbursement 713,400 759,499 (46,099)-6%Chemicals 502,985 691,327 (188,342)-27%Power 375,706 337,155 38,55111%R/M – Structural/Electrical/Plumbing 245,963 272,100 (26,137)-10%R/M – Fleet Management 204,382 237,653 (33,271)-14%Marketing & Public Relations 198,205 52,831 145,374275%Total Top 10 Operating Expenses 9,342,271 9,122,310 ----Other Operating Expense 2,017,703 1,983,036 34,6672%Total Operating Expense 11,359,974 11,105,346 254,6282%
March EnplanementsUp 6% March 2018 over March 2017Total 20142015201620172018
2018 Total PassengersUp 10% over 2017Total 0100,000020142015201620172018
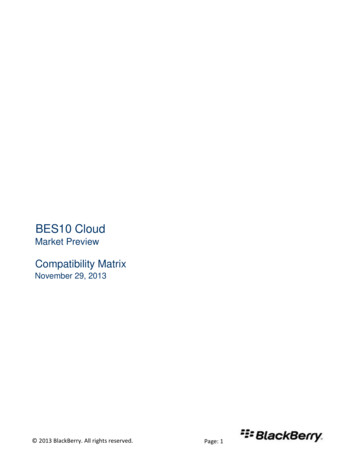
Quarterly Report: Q4 000,00050CapacityPassengersLoad Factor500,0004020132014201520162017Load factor %Capacity/passengersBoise Traffic/Capacity TrendsYear end December2017 capacity was up6%, while passengerswere up 8%, leading toa 2% point increase inaverage load factor.
Quarterly Report: Q4 2017Top Origination/Destination ionSeattle, WAPortland, ORSpokane, WAPhoenix, AZ (PHX)Los Angeles, CADenver, COLas Vegas, NVSan Diego, CASacramento, CASalt Lake City, UTSan Francisco, CAOakland, CAOrange County, CAChicago, IL (ORD)San Jose, CADallas, TX (DFW)Minneapolis, MNOntario, CAOrlando, FL (MCO)Burbank, CATotal/AverageO&DPaxO&DRevenue80,160 9,218,30354,249 6,689,39240,605 3,125,07340,317 5,098,70040,302 4,676,21638,983 5,830,87635,016 3,879,52434,265 3,837,05427,980 2,925,30522,040 3,395,64619,975 3,502,19119,283 2,748,74318,150 2,375,91714,578 3,524,44413,893 1,961,50512,338 2,820,58112,092 0882,557 161,097,683Average YieldFare ( ) ( 01917% Change Since4Q 2016Pax Rev Fare Yield66000444561113 (11) (21) (21)75 (2) (2)23 8 (12) (12)63 (3) (3)52 19 (22) (22)14 140010 8 (1) (1)35 23 (9) (9)2 (5) (8) (8)6 147724 6 (14) (14)(8) 3 12 12230032 (1) (1)92 (7) (7)10 6 (3) (3)22 19 (2) (2)10 6 (3) (3)The top 10 markets weresimilar to 4Q 2016; however,individual market rankingchanged slightly in the top 10markets.
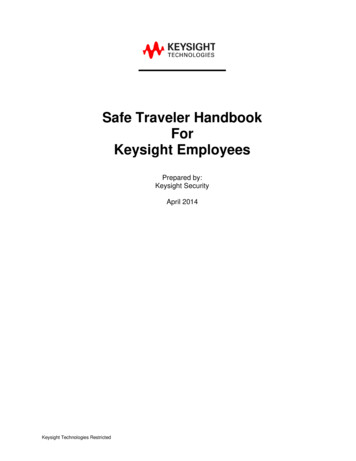
Quarterly Report: Q4 2017Boise AirlineMarket ShareYear2016O&D PassengersAlaska lost 1% of marketshare to Southwest in thelatest year-ended %27%26%26%25%OtherG4AAUADLWNASQ1 Q2 Q3 Q4 Q1 Q2 Q3 Q4 Q1 Q2 Q3 Q4 Q1 Q2 Q3 Q4 Q1 Q2 Q3 rline Market 1%1%1%1%1%1%1%
Quarterly Report: Q4 2017Boise Forward Looking ScheduleDestinationAirlineMay 2018Flts SeatsChicago, IL (MDW)Chicago, IL (ORD)Dallas, TX (DAL)Dallas, TX (DFW)Denver, COHouston, TX (IAH)Las Vegas, NVLewiston, IDLos Angeles, CAMinneapolis, MNOakland, CAPhoenix, AZ (AZA)Phoenix, AZ outhwest100% 100%2%2%0%0%100% 100%0%11%3%9%0%(6%)25% 30%2%2%(3%) (3%)0%0%0%0%0% (32%)0%2%(6%)4%100% 100%98% 18%0%2%Jun 2018Flts Seats(11%) (11%)100% 100%0%0%100% 100%80% 80%100% 100%6%1%18% 14%0%(1%)0%(6%)(5%)2%(17%) (17%)0%(6%)0%0%0% (33%)5%7%0%8%100% 100%82% 12%0%1%Year over Year Change %Jul 2018Aug 2018Flts Seats Flts Seats0%0% (73%) (73%)15% 25% (3%)6%0%0%0%0%100% 100% 100% 100%3%37% 50% 57%100% 100% 100% 100%6%0%(3%) (8%)20%11%18%7%0%2%0%3%0%(6%)0%(3%)(10%) (4%)0%1%(13%) (13%) (32%) (32%)0%(6%)0%(3%)0%0%0%0%0% (33%) 0% (34%)(1%) (2%) (7%) (4%)0%7%2%3%100% 100% 100% 100%88% 14% 57% 15%0%0%0%(1%)Sep 2018Oct 2018Flts Seats Flts Seats25% 25%(14%) (6%) (11%) (9%)0%0%0%0%0%0%0%0%100% 100% 100% 100%(2%)2%0%1%15% 18% 25% 33%0%1%0%1%13% 13% (11%) (2%)0%0%0%(2%)(100%) (100%) (100%) (100%)13% 13% (11%) (11%)0%0%0%0%34%0%(9%)0%(31%) (5%)0%(0%)(5%) (5%) (2%) (2%)100% 100% 13% 23%0%17%2%19%0%(3%)0%(3%)
Quarterly Report: Q4 2017Boise Forward Looking ScheduleDestinationAirlineYear over Year Change %May 2018Jun 2018Jul 2018Aug 2018Sep 2018Oct ltsSeats1%(1%)2%(1%)3%3%15%15%5%6%1%12%Portland, ORAlaskaReno, NVAlaskaSacramento, )0%0%San Francisco, CAUnited25%9%25%51%26%64%25%70%6%45%2%33%San Jose, %12%15%12%14%2%12%6%15%Salt Lake City, UTSan Diego, CASeattle, WASpokane, WATotal(13%) (13%) (17%) (17%) (13%) (13%) (10%) (10%) (17%) (17%) (13%) (13%)(17%) (17%) (10%) (10%)
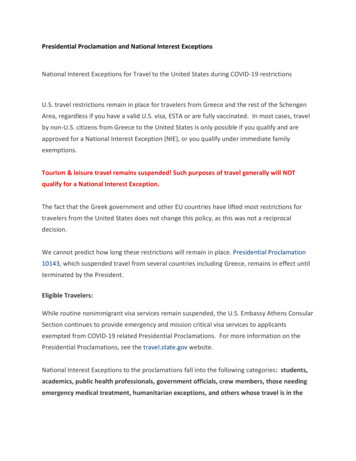
Quarterly Report: Q4 2017Seats Per Capita ComparisonSeats per 1.491.541.591.601.741.841.881.000.500.00Boise consistently exceeds all comparison markets exceptSpokane in seats per capita.Average:1.97
Quarterly Report: Q4 2017Origination/Destination Passengerand Airfare Comparison 229 239 223 217 228 220 1892,500,000O&D Pax 221 240 182 189 200Average Fare2,000,000 1601,500,000 1201,000,000 80500,000 400 0ICTCOS MSN DAYLITDSM TUL GRR ELPTUS GEGBOIBOI continued to surpass Tucson and Spokane in O&D passengersfor the year-ended 4Q 2017 and has the lowest fare among allcompare markets with the exception of Spokane.Average FareO&D Passengers3,000,000 249 236
Quarterly Report: Q4 2017Year-Over-Year ComparisonsAirportYE 4Q 20172018MSA# of NonstopO&DPopulation DestinationsPaxSpokane, WA561,542Des Moines, IA632,364Wichita, KS657,695Madison, WI664,639Boise, ID699,707Colorado Springs, CO 716,366Little Rock, AR769,178Dayton, OH804,901El Paso, TX891,189Tulsa, OK1,000,438Tucson, AZ1,064,215Grand Rapids, 29YOY Change# of Nonstop O&D SeatsDestinations Pax4(1)(1)2150(1)0(2)208% 6%3% 4%1% 0%5% 6%9% 6%24% 29%3% 1%(9%) (5%)3% 4%3% 4%5% 0%6% 8%BOI’s seats have increased at the same or a faster rate than all othercompare markets except COS and GRR; O&D passengers have increasedfaster than all other compare markets except COS.
Upcoming EventsDateEventMay 5, 2018American Lung Association Derby Day at Quail HollowMay 7-11, 2018TSA PreCheck EventJune 7, 2018Next commission meeting
Master Plan Update Technical Advisory Committee reviewed preferred alternatives . full scale infectious disease exercise conducted by U.S. Health and Human Services Coordinated arrival and departure of Boeing 747 Worked with local agencies to execute drill . Allegiant. 100%. 100%. 100%. 100%. 100%. 100%. 100%. 100%. 100%. 100% .