Transcription
Silver Report08/29/2017 30.00oz SILVERWITHIN THE NEXT8 MONTHS?SILVER HAS BEEN HERE BEFORE AND THE FUTURE LOOKS VERY SHINYDid you notice the start of Silver's new uptrend in 2016 till now? Well, it’s just getting started,and in our professional opinion, we anticipate a new bull cycle, the 3rd phase of the secular bullmarket which could last 7-10 years from the outset of 2016.From January 4, 2016, silver opened at 13.81oz, and by December 30, 2016, silver closed at 15.99oz, that is a 15.78% gain for the year, and from January 3rd, 2017 till August 29th,2017, silver has increased 9.2% for the year.Upon reviewing this, I have created an approximate target price of 30.00oz based on purefundamentals and some technical analysis on a chart.
Silver Report08/29/2017Peak Supply and Continued SupplyDeficits Warn Higher Prices coming soon Thomas Reuters/GFMs recognized that silver peak in 2015 Top primary silver miners in Q2 2017 production declined a staggering 20%-34% Chile world’s 5th largest silver producer fell a staggering 32% in May versus the same time lastyear Peru world’s 2nd largest silver producer fell 12% in February versus the same time last year From January to April 2017 other top silver producers fell: Mexico -3% Peru -3% Australia -5%If the continued decline of production continues this trend through 2017, globalmine supply will fall for a 2nd consecutive year.Global silver production peaked at 890.8 million ounces in 2015 and then dropped to 885.8million ounces last year.Investors need to start stacking silver now before it’s too late as silver prices for the year isalready up this year 9.2%.
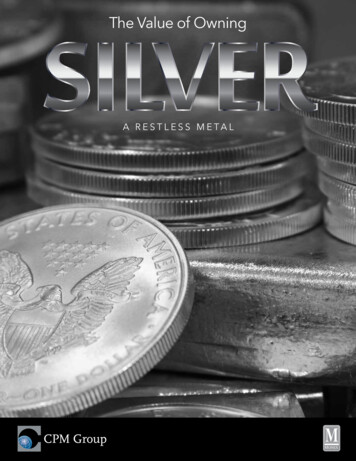
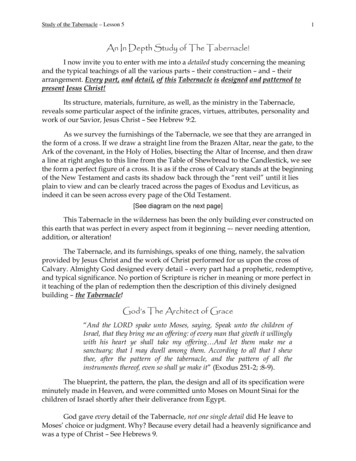
Silver Report08/29/2017Coming up on the 5th consecutive supplyshortfallThe end of 2016 marked the 4th consecutive year of an annual silver deficit and this year could markthe 5th consecutive year. The total annual silver deficit from 2013-2016 came out to a staggering 338million ounce shortfall.According to a report by experts from HSBC in December, they expect in 2017 about 132 millionounce deficit due to increased industrial usages, for an approximate total shortfall of 541.6 millionounces.In the (below) chart you can see what the price of Silver did when there was a surplus, it traded flatline for years and at some points was going down. The market was still in a secular bear market at thetime coming off the 1980 high of 52.50oz. Then the Dot-Com Bubble hit in 2000 following the 9/11attacks and the 2008 Financial Crisis adding fuel to the fire for explosive moves in silver.Ever since 2000, there have only been a few surpluses, and as you can see in the chart when the Silvermarket enters big deficits, it has always followed by large moves in the market. Not only is the fouryear shortfall price supportive in the mid-teens, but it could very well propel the market to 30ounce here in the near-term.
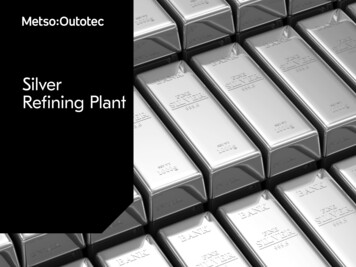
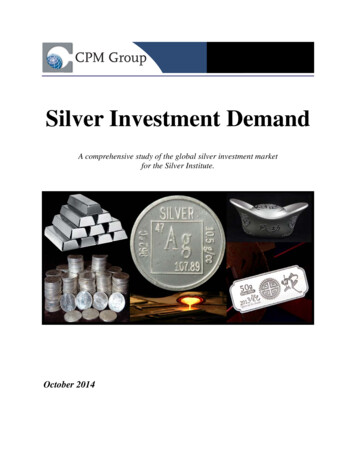
Silver Report08/29/2017World Silver Demand For InvestmentBars & Coins Has Exploded Over 235%Ever since the financial crisis of 2008, investment demand for bars & coins has increased over 235% tolevels never seen. The TOTAL Demand has exploded nearly fourtimes larger than 2000-2007 foreshadowing some significant events coming thatin what we believe is another coming crisis. Silver always has acted as a safe-haven or a flight-toquality when there are economic, political and financial uncertainties.One of the biggest concerns for the increased in physical silver demand is central banks, theirmonetary policies, and national debt levels rising to record levels. Since the crisis of 2008, CentralBanks will have printed over 15 trillion, increasing national debts to unsustainable levels with somecountries already defaulting. In 2018, the US will be at nearly 21 trillion in national debt and with thecurrent gross domestic product (GDP) just over 18 trillion or about a 106% Debt-to-GDP ratio is veryconcerning. There are many other concerns such as: Debt-to-GDP increasing to WW2 levels(113%) Government servicing U.S. debt in the future, especially with ratesrising Currency crisis due to central banks printing nearly 15 Trillion Federal Reserve getting ready to dump 4.5 trillion dollars back onto the market Interest rates rising causing another economic contraction (recessionpossibly worse than ‘08) Geopolitical tensions: The North Korea missile crisis, the fight against ISIS,the war in Syria and Libya conflict, Russia conflict, Taliban in Afghanistan, tensions in the EastChina Sea and the South China Sea Financial uncertainty due to global economies in bad shape and gettingworse from debt rising and Central Banks printing WW3 or Cold War Silver and Gold are the ultimate ‘Crisis Commodity’ or currency Stocks near lifetime highs, the 2nd longest bull in history(Coming up on nine years) and what goes up must come down
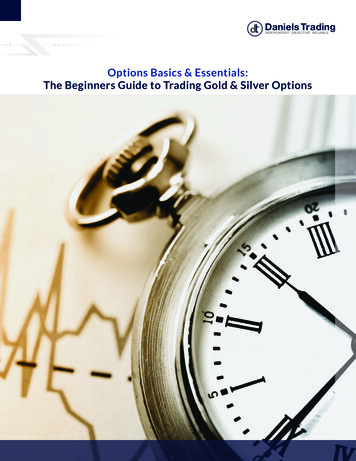
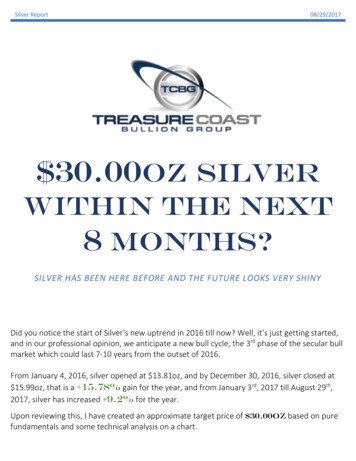
Silver Report08/29/2017Silver has been here before and looksvery shiny with a potential 72% Gainwithin 8 MonthsSilver has now been trading in an average price range of about 17.00oz for the last 11 months. In thefour charts (below) shows how silver has traded in a very tight trading channel before and it’s nothingnew to this market. The problem is, the average investor gets complacent and tends to forget the past.In the (below) charts, when silver breaks out to the upside it will consolidate and then trade in a definedtrading channel or lets the dust settle before it takes off again. The silver market typically trades in anaverage price range for about a Year to a Year & Half followed by percentage gains of 55% to 185%gains. On the next page, you will see the potential move to 30oz that’s on the horizon.
Silver Report08/29/2017December 2015 the silver market marked the bottom of 13.62oz coming off a 4.5-year bear cycle inour professional opinion and what goes down must come up. The Federal Reserve raised rates for thefirst time since 2006 and set the stage for silver to break out. Sure enough when they raised ratesDecember 16th, 2015 it launched silver to 15.99oz forming the addition cup-and-handle technicalbreakout and increased in value to 18.06oz.In June of 2016, Great Britain voted to leave the Euro, and the market broke out to hit a high of 21.23oz, and the market consolidated, and now the dust has been settling or trading in a definedtrading channel for 11 months. There are many events or fundamental factors to consider coming upwith the potentialmove to 30.00oz in the nexteight months.- Debt ceiling debate- End of the Fiscal Year- Stock Correction- Another Interest Rate Hike- Noth Korean Missle Attack- All other concerns I've mentioned in this article
Treasure Coast Bullion Group3900 Military Trl Ste #500Jupiter, FL nstitute.org/site/WSS2017.pdfRisk Disclosure: Purchasing Gold, Silver, Platinum or any precious metals in bullion, bars, coins, rounds involve a degree of risk that should be carefully evaluated prior toinvesting any funds. Treasure Coast Bullion Group strongly recommends reading our Risk Disclosure and conducting due diligence before committing any money to purchasegold, silver, and other precious metals. If you have any additional questions, please contact Treasure Coast Bullion Group.
Global silver production peaked at 890.8 million ounces in 2015 and then dropped to 885.8 million ounces last year. Investors need to start stacking silver now before it’s too late as silver