Transcription
Zhao, Q., Kelley, S. B., Xiao, F. and Kuby, M. J. (2019) A multi-scale framework forfuel station location: from highways to street intersections.Transportation Research PartD: Transport and the Environment, 74, pp. 48-64.There may be differences between this version and the published version. You areadvised to consult the publisher’s version if you wish to cite from it.http://eprints.gla.ac.uk/191040/Deposited on: 26 July 2019Enlighten – Research publications by members of the University of Glasgowhttp://eprints.gla.ac.uk
A Multi-Scale Framework for Fuel Station Location: From Highways to StreetIntersectionsQunshan Zhaoa,*, Scott B. Kelleyb, Fan Xiaoc, Michael J. KubyaaSpatial Analysis Research CenterSchool of Geographical Sciences and Urban PlanningArizona State UniversityTempe, AZ 85287-5302, USAQunshan Zhao Email address: qszhao@asu.eduMichael Kuby Email address: mikekuby@asu.edubDepartment of GeographyUniversity of Nevada, RenoReno, NV 89557, USAEmail address: scottkelley@unr.educNational Marine Environmental Forecasting Center100081 Beijing, ChinaEmail address: xiaofan10243@163.com*Corresponding author:Email address: Qunshan.Zhao@glasgow.ac.uk (Q. Zhao)Present address:Urban Big Data CentreSchool of Social and Political SciencesUniversity of GlasgowGlasgow, G12 8RZ, UKTelephone: 44 14133085341
AbstractElectric drive vehicles (plug-in electric vehicle or hydrogen fuel cell vehicles) have beenpromoted by governments to foster a more sustainable transportation future. Wider adoption ofthese vehicles, however, depends on the availability of a convenient and reliablerefueling/recharging infrastructure. This paper introduces a path-based, multi-scale, scenarioplanning modeling framework for locating a system of alternative-fuel stations. The approachbuilds on 1) the Flow Refueling Location Model (FRLM), which assumes that drivers stop alongtheir origin-destination routes to refuel, and checks explicitly whether round trips can becompleted without running out of fuel, and 2) the Freeway Traffic Capture Method (FTCM),which assesses the degree to which drivers can conveniently reach sites on the local streetnetwork near freeway intersections. This paper extends the FTCM to handle cases involvingclusters of nearby freeway intersections, which is a limitation of its previous specification. Then,the cluster-based FTCM (CFTCM) is integrated with the FRLM and the DFRLM (FRLM withDeviations) to better conduct detailed geographic optimization of this multi-scale locationplanning problem. The main contribution of this research is the introduction of a framework thatcombines multi-scale planning methods to more effectively inform the early development stageof hydrogen refueling infrastructure planning. The proposed multi-scale modeling framework isapplied to the Hartford, Connecticut region, which is one of the next areas targeted for fuel-cellvehicle (FCV) market and infrastructure expansion in the United States. This method isgeneralizable to other regions or other types of fast-fueling alternative fuel vehicles.Keywords: alternative fuel, infrastructure, hydrogen, path, flow, Connecticut2
1.IntroductionThe transportation sector became the largest source of CO2 emissions in the United States inFebruary 2016, surpassing electric power generation (US Department of Energy, 2016). Of thefive energy-use sectors (including residential, commercial, and industrial), transportation is alsothe only one for which CO2 emissions continue to rise. Not coincidentally, transportation is thesector that relies most heavily on a single form of energy, with petroleum accounting for over90% of total consumption (US EIA , 2018). Unlike the other four sectors where energy-usingequipment is stationary, transportation vehicles are mobile and depend on a widespread refuelinginfrastructure. For most alternative-fuel vehicles (AFVs) in most regions, the refuelinginfrastructure is relatively sparse or even non-existent. Early stage AFV refueling infrastructuredevelopment is essential and necessary to encourage individual car buyers and freight companiesto consider switching from vehicles that operate with liquid petroleum fuels to AFVs. In order tobest encourage adoption broadly across regions, initial stations should be located where they canprovide the greatest benefit.In the United States, California led the way as the first commercial market for fuel-cell vehicles(FCVs) and hydrogen refueling infrastructure. For the initial rollout in 2015, California fundedsix stations and drivers bought or leased 200 FCVs, rising to 25 stations and 925 FCVs in 2016,31 stations and 2,473 FCVs in 2017, and 39 station and 6,558 vehicles as of March 1, 2019(California Air Resources Board, 2018). The New York-Boston corridor is one of the regionstargeted for the next rollout of FCVs and stations, and Connecticut has an active hydrogencoalition (“Connecticut Hydrogen-Fuel Cell Coalition,” n.d.). As in California, an initial networkof hydrogen fueling stations is needed before introducing the first FCVs for the consumer marketin Connecticut.3
Planning an effective network of alternative-fuel stations is a multi-scale location problem.Alternative-fuel vehicle drivers have diverse travel needs, and the ability to refuel on a variety oftrips across a region is an essential component of a convenient refueling network. . Once aneffective refueling network is built, stations can be used for neighborhood refueling, urban trips,and long-distance travel in the region. In addition, drivers use a hierarchy of roads from localstreets to arterials to limited-access highways (freeways) to complete trips across the region, andgenerally want to reach refueling stations with a minimum of wasted travel time. Thus, it isimportant to build the refueling station at locations that are easy to reach on the local streetnetwork. This paper proposes a multi-scale method for planning a starter network of stations toserve local, metropolitan, and inter-city trips, considering travel and station access on all classesof roads. The method is based on the flow-refueling location model (FRLM), in which driversmake trips from origins to destinations and stop along their shortest paths to refuel, consideringthe driving range of vehicles in determining if the stations can cover the set of trips in thenetwork (Kuby and Lim, 2005). The method proposed here for multi-scale planning integratesthe FRLM with an extension that allows deviations from shortest paths (Kim and Kuby, 2013,2012). The typical FRLM and DFRLM modeling approach works well for recommendinggeneralized station locations on a simplified regional road network, but does not check whethersuitably accessible nearby sites exist where stations could be built. To address this, weincorporate and extend the Freeway Traffic Capture Method (FTCM), which measures howconveniently drivers can reach street intersections surrounding freeway intersections for allpossible travel routes passing through them, to identify accessible sites on the local streetnetworks (Kelley, 2017). Using these integrated methods, we recommend initial sets of five and4
ten stations for the greater Hartford, Connecticut region. The method is generalizable to otherregions and other fast-refueling AFVs.2.Literature ReviewMany different methods have been proposed for planning a system of hydrogen or other alt-fuelstations. One common way to categorize location models is by the spatial units representing thedemand for fuel. Classic location models such as the p-median (Revelle and Swain, 1970) andmax-cover models (Church and ReVelle, 1974) use zonal demand aggregated to centroids. Pointsrepresenting areal units such as cities, towns, neighborhoods, or census tracts are weightedaccording to their populations, number of vehicles, or likelihood to purchase FCVs. In mediantype station location models, these weighted demands are then assigned to their closest station(He et al., 2016; Nicholas et al., 2004), while in covering models, stations must be “closeenough” in terms of a critical distance or travel time threshold for being able to serve a demandpoint (Frade et al., 2011; Stephens-Romero et al., 2010).Another group of models locates stations to serve passing traffic, not proximity to homes orcompanies. Higher amounts of traffic volume, measured in terms of average annual daily traffic(AADT) or vehicle-miles traveled (VMT), signals more demand for fueling (Boostani et al.,2010; Brey et al., 2016; Goodchild and Noronha, 1987; Lin et al., 2008). While it makes sense tolocate stations on busy roads or at the intersection of busy roads, several kinds of demandcounting errors can arise because drivers link together a sequence of arcs into a route. Thus, thesame vehicle may be in the traffic count on adjoining arcs but would be unlikely to refuel onboth arcs. Likewise, an arc-based model will count all of an arc’s demand as covered by a nearbystation even if some of the traffic on the arc is making a long-distance trip that cannot becompleted without other stations being located.5
Path-based models were developed to handle the multi-arc nature of road travel. Also known asflow-based or trip-based models, they use origin-destination routes as the fundamental units ofdemand. An origin-destination flow matrix defines the demand weights by the volume ofpassenger vehicle trips or freight tonnage. In the original flow-capturing location model (FCLM)by Hodgson (1990) and the flow-intercepting (FILM) model by Berman, Larson, and Fouska(1992), weighted demands are counted only once. Kuby and Lim (2005) extended theFCLM/FILM to the case of refueling stations by introducing an explicit vehicle driving rangeand considering that multiple stations may be needed to complete a long-distance route. In thebasic flow-refueling location model (FRLM), only the shortest or least-travel-time path isconsidered, and an O-D flow is not considered covered unless there are stations along the paththat enable a driver to complete the round trip without running out of fuel. Kim and Kuby (2012,2013) then introduced the deviation flow-refueling location model (DFRLM) to allow drivers todeviate off the shortest path to reach a refueling station. Numerous studies have developed fastersolution methods for the FRLM (Capar et al., 2013; MirHassani and Ebrazi, 2012; Yıldız et al.,2016). Other researchers applied and extended the FRLM and DFRLM by weighting flowvolumes by trip length which yields VMT or tkm measures (Lines et al., 2007) and byconsidering station capacities (Upchurch et al., 2009), multiple driving ranges (de Vries andDuijzer, 2017), congestion (Fan et al., 2017), trucking (Fan et al., 2017), and regional equity(Hong and Kuby, 2016; Kuby et al., 2016).Choosing the appropriate model for optimizing a set of stations depends on numerous factors: thetype of vehicles, the geographic scale of the region, the refueling or recharging speed, the drivingrange, whether home refueling or recharging is commonplace, and the behavior of drivers. Thereis behavioral and survey evidence supporting the assumptions underlying node-based approaches6
(Sperling and Kitamura, 1986), though often these are based on surveys of gasoline drivers whohave hundreds or thousands of stations to choose from in large cities (Kuby, 2019). Kuby,Kelley, and Schoenemann (2013) surveyed drivers in Southern California who were refueling atCNG stations, comparing their driving and refueling trips to drivers surveyed at nearby gasolinestations. They found that the CNG drivers refueled at higher tank levels, at the same stationsmore frequently, farther from home, more frequently in the middle of trips, and more on workbased trips, compared with gasoline drivers. Kelley and Kuby (2013) found that, when no stationexists that is both closest to home and most on the way, CNG drivers favored the station with theleast deviation off their shortest path by a 10:1 margin over the station closest to home. Thissuggests that early AFV adopters adapt to the greatly reduced station availability by changingtheir pre-AFV refueling habits.There are limits to the recommendations provided by these modeling approaches, though. Moststation location models use a relatively coarse representation of a region's road network to locatea limited number refueling stations across a city or region (Jochem et al., 2016; Sathaye andKelley, 2013; Wang and Lin, 2009). Roads included in these networks are typically highways,freeways, and major arterials that are represented as arcs, while their intersections arerepresented as nodes. These nodes represent the set of candidate sites at which refueling stationscan be built. In the case of selecting a node that represents an intersection of at least one limitedaccess highway, however, an additional step is necessary in order to identify suitable refuelingstation sites. Stations cannot be built in the middle of freeway intersections but instead must belocated on nearby surface streets, which require navigating freeway entrances and exits, accessramps, and congested roadways to reach. Travel in these environments can be complex and timeconsuming and can vary greatly from one freeway intersection to another. Freeway intersections,7
however, are critical to station planning. Trip-based approaches, in particular, frequently selectthese nodes because of the high path volumes flowing through them (Kuby et al., 2009). Tosystematically identify effective station sites near major freeway intersections, Kelley (2017)developed the Freeway Traffic Capture Method (FTCM) to help address the inherent scaledependency between regional optimization models and local road networks, where stations mustbe built. This study found only 7% of street intersections near each of the 72 freewayintersections in Los Angeles could be conveniently reached by drivers on all possible travel pathsthat passed through the freeway intersection, signaling that an ad-hoc station site selectionprocess near freeway intersections is unlikely to identify a convenient location.While helpful in providing key stakeholders with a tool to identify best station sites near freewayintersections, the FTCM has a number of limitations. First, its intent is to define a best stationlocation on the local street network for each optimization network node that represents a freewayintersection. Therefore, it assesses each freeway intersection independently. In a given regionalfreeway network, however, there may be multiple freeway intersections near one another. Insuch cases, one station on the local street network may be a suitable location for travel pathspassing through multiple freeway intersections. Particularly in limited refueling infrastructureswhere only a few stations can be built, it may be best to consider general areas where a numberof major highways, freeways, and arterials intersect as a cluster. Sites chosen on the local streetnetwork could then be suitable for all paths traveling through the cluster. Second, the FTCM hasnot yet been applied to the outputs from a regional scale optimization model to determinewhether convenient sites exist on the street network near a selected optimization node. This is apriority research consideration for applying station planning methods to a relatively coarserepresentation of a road network.8
3.MethodsThis paper proposes a multi-scale method for planning a network of fuel stations. The methodintegrates the FRLM and DFRLM models with a modified Cluster-based Freeway TrafficCapture Method (CFTCM) introduced here. Table 1 summarizes the abbreviations, terminology,and notation used in the multi-scale method.9
Table 1. Abbreviations and Definitions.AbbreviationsAADTaverage annual daily trafficAFValternative fuel vehicleCFTCMCluster Freeway Traffic CaptureMethodCompressed natural gasDeviation Flow Refueling LocationModelfuel cell vehicleFlow Capturing/InterceptingLocation ModelCNGDFRLMFCVFCLM/FILMFRLM Notation1 if path q is refuelable𝑦𝑞0 otherwise11 if facility k is open𝑋𝑘0 otherwiseflow volume on path q𝑓𝑞𝑑𝑞p𝐴𝑞𝑞𝑍𝑖𝑗FRLMFlow Refueling Location ModelNFTCMO-DFreeway Traffic Capture Methodorigin-destinationEVMTDFRLM NotationA, B, CDTdistance of path qnumber of facilities toopenset of arcs on round trip qset of nodes that cancover a vehicle crossingdirectional arc ij on pathq given the assumeddriving range of vehiclesset of network nodes(optimization nodes)set of existing or plannedstationsvehicle miles traveledCFTCM Notationklocal street intersectionnodeAkhscore for streetintersection node k incluster h (0 Akh 1)parameter settings in the deviationtijhshortest travel time (indecay functionminutes) from artificialorigin i to artificialdestination j throughcluster hdeviation time (in hours)tikjshortest travel time (inminutes) from artificialorigin i to local streetnetwork intersection nodek (Figure 2) to artificialdestination j throughcluster hThe definitions of i, j, and k are different in the FRLM and CFTCM notation, but in each model k refers to thepotential station locations being evaluated at that geographical scale.110
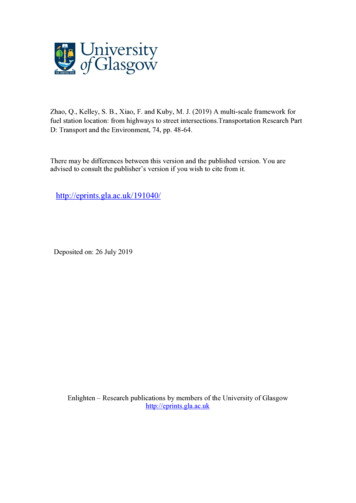
DTmaxtqMaximum deviation timetravel time of fastest path for O-Dpair qTerminologyXikjhIhJhOptimization Nodea node in the simplified regionalnetwork used in the optimizationmodelsNihStreet Network Nodea node that represents anintersection on the detailed localstreet network surrounding freewayintersectionsa location where two or morelimited-access freeways intersect orconvergeΔmaxa subset of optimization nodes that(a) connect to at least one limitedaccess freeway arc, and (b) arewithin cmax network miles of eachother. Note: an optimization nodemay be a member of more than onecluster, and a cluster may containonly a single optimization node.bmaxFreeway intersection orconfluenceClustercmax1 if tikjh - tijh Δmax,0 otherwiseset of inbound origins forcluster hset of outbounddestinations for cluster hnumber of possiblefreeway directionsthrough cluster h2 startingfrom artificial origin imaximum deviation fromshortest travel time (inminutes) through clusterhmaximum network traveldistance betweenoptimization nodes in thesame cluster (miles)maximum buffer distance(in miles) fromoptimization nodes tostreet network nodesFigure 1 shows the methodology framework that integrates the FRLM, DFRLM, and CFTCMmethods across multiple scales for planning a robust refueling infrastructure. Phase 1 is afiltering process that runs the FRLM and DFRLM without any restriction of candidate sites on anetwork of major urban and regional roads. Twenty-four scenarios are systematically analyzedbased on the most critical modeling assumptions: vehicle driving ranges (100 and 150 miles),number of hydrogen stations to build (5, 10 or 15 stations in the early phase of development),choice of objective function (Max trips or Max VMT), and model (FRLM or DFRLM).2The Nih notation is needed because all ij combinations of directions of travel may not be possible through a freewayintersection cluster11
Following Phase 1, any optimization node that was never optimal in any of the 24 scenarios iseliminated from subsequent phases of the analysis, while any node that was optimal under anyscenario is then evaluated by the CFTCM.Fig. 1. Multi-scale refueling infrastructure planning framework.The CFTCM process begins by grouping any remaining optimization nodes located on freewaysinto clusters if they are close enough to each other. Then, street intersection nodes around eachoptimization node in the cluster are evaluated to determine if all possible travel on all routesthrough the cluster can reach them conveniently. Each optimization node is then given the scoreof its best-performing street network node, and the best optimization node in the cluster isselected to represent the cluster in Phase 2. Using this reduced set of optimization nodes ascandidate sites, we again run the 24 FRLM and DFRLM scenarios. Based on the Phase 2scenario results, we then adapt Owen and Daskin’s (1998) scenario-planning approach, in which“the objective is to determine robust facility locations which will perform well (according to the12
defined criteria) under a number of possible parameter realizations” (p. 435). Here, we determinethe best-performing set based primarily on how frequently locations are optimal, while alsoconsidering how frequently they occur in diverse scenarios. In other words, consistentappearance of a station in only one similarly defined set of scenarios is not considered to be asrobust as a station that occurs with similar frequency across a range of scenarios.Finally, in Phase 3, we evaluate the chosen system of stations according to a more limited set ofFRLM and DFRLM scenarios to check how well they perform together under differentassumptions. Depending on those results, the final set of stations could be revised if necessary.3.1The Flow-Refueling and Deviation Flow-Refueling Location ModelsThis section introduces the two location optimization models (FRLM and DFRLM). The firstmodel, the standard FRLM, requires pre-generation of a single shortest (fastest) path for eachorigin-destination (O-D) path q. In this paper, we used the arc cover-path cover (AC-PC)formulation of the FRLM (Capar et al., 2013), an exact mixed-integer programming (MIP)solution method that is fast and globally optimal (Arslan and Karaşan, 2016).(1)𝑀𝑎𝑥 𝑞 𝑄 𝑓𝑞 (𝑑𝑞 )𝑦𝑞Subject to: 𝑘 𝑍 𝑞 𝑋𝑘 𝑦𝑞𝑖,𝑗(2) 𝑞 𝑄, 𝑎𝑖,𝑗 𝐴𝑞(3) 𝑘 𝑋𝑘 𝑝𝑋𝑘 1(4) 𝑘 𝐸𝑦𝑞 , 𝑋𝑘 {0, 1}(5) 𝑞 𝑄, 𝑘 𝑁13
The objective function (1) maximizes the origin-destination flow volume or VMT that can becovered, i.e., the trips that are refuelable given the station locations, the shortest paths, and thedriving range. The objective can be generated with or without multiplying by the path length, dq.The standard form without dq multiplies flow volume of path q by a 0-1 variable indicatingwhether the shortest path is covered or not. Summed over all paths q, this maximizes totalcovered trips and counts all trips equally, thus assuming that drivers care about accomplishingthe purpose of a trip regardless of how far away that activity is. By including dq in the objectivefunction, the trip volumes are weighted by their distances, thus maximizing total covered VMTand emphasizing longer trips and conventional fuel replaced. Both objectives are used in thispaper.Constraints (2) ensure that the yq variables equal 1 only if the round trip on path q can becompleted without running out of fuel. If stations are located on the path that can fully covereach directional arc ij, then and only then is the full round-trip path considered covered. The𝑞exogenously determined set 𝑍𝑖𝑗includes all stations “downstream” of directional arc ij on round-trip path q that are within driving range of the far end (j) of the arc. The downstream part of theround-trip path is allowed to wrap around the origin and/or destination, e.g., in the round-trippath 1-2-3-4-3-2-1, the directional arc 1-2 could be refueled by a station at node 3 if the distance3-2-1-2 does not exceed the driving range (see Capar et al. 2013 for details). All refueling stopson a round-trip path are assumed to top up the tank to full. Constraint (3) requires that exactly pstations are opened. Constraints (4) force open any stations k in the set E of existing and plannedstations. Constraints (5) define yq and Xk as 0-1 variables, whereby trips are either covered or notand stations are either open or not.14
In contrast with the FRLM, the DFRLM allows drivers to detour from their fastest path to accessone or more open stations while traveling from their origin to their destination. Kim and Kuby(2012) originally formulated the DFRLM as an exact MIP model that requires enumeration of aset of possible deviation paths. Because of the very large number of possible deviation pathseven for a single O-D pair, the MIP was not solvable on large real-world networks, leading Kimand Kuby (2013) to develop a greedy-substitution heuristic algorithm. The model allows anyfeasible deviation path to be taken, subject to a restriction on the maximum difference in absoluteor relative distance or travel time from the shortest path. Furthermore, the model includes apenalty function that reduces the covered flow volume as a function of the absolute or relativesize of the deviation, which can take linear, exponential, inverse distance, and sigmoidalfunctional forms. Subject to the maximum deviation and penalty function, any kind of deviationis allowed, including deviations that leave the shortest path and return to it by the same route,leave the shortest path and return to it at a later point, or take a completely different path throughthe open station(s). At each stage of the greedy-substitution algorithm a new station is addedafter testing all possible station additions and substitutions. For any given set of stations beingevaluated, an artificial network is constructed for each O-D pair using the set of stations plus theorigin and destination nodes. Between any pair of nodes in this artificial network, an artificial arcis added if the shortest path between them satisfies the driving range conditions. On each of theseartificial networks, the shortest path is by definition feasible given the open stations and thedriving range specified. Like the FRLM, the DFRLM’s objective can maximize covered trips orVMT, and the model can force open the set of existing or planned stations. Additional algorithmdetails can be found in Kim and Kuby (2013).15
An important point for both FRLM and DFRLM models used here is that the objective functionvalue is reported in terms of the percent of demand that is potentially refuelable given theassumed driving range. The stations in these models are uncapacitated, and are designed toprovide basic geographic coverage for as many potential early FCV adopter trips as possible inthe initial rollout stage, assuming that initial penetration rates are extremely low and stationcapacity is not yet an issue.3.2 The Cluster-Based Freeway Traffic Capture MethodThe original specification of the FTCM assessed the accessibility of street network nodessurrounding major intersections of two or more freeways. Each freeway intersection, however,was analyzed separately. In this study, we extend the FTCM to evaluate a cluster of nearbyfreeway intersections simultaneously. These clusters are broadened to also include nearbyfreeway-street intersections that may have been chosen in Phase 1. The CFTCM generates ascore for each street network node that measures its ability to serve as a convenient station sitefor all travel paths that pass through a cluster of optimization nodes where multiple highways,freeways, and major street intersections intersect in close proximity. The data inputs to theCFTCM include: 1) a set of optimization nodes that can be filtered to a smaller set afterevaluation, 2) a simplified optimization network of major streets and highways, and 3) a detailedstreet and highway network. Both of the network’s datasets contain travel speeds and lengthsalong all arcs. Then, the user sets a number of flexible parameters. These include: 1) themaximum deviation (Δmax) in minutes required to reach a street network node from a shortesttravel time path through the cluster h, 2) the maximum network travel distance (cmax) betweenoptimization nodes in the same cluster, and 3) a maximum Euclidean buffer distance (bmax) fromoptimization nodes to street network nodes.16
The CFTCM first produces a set of clusters and the optimization nodes that belong to them, thengenerates accessibility scores Akh for each street network node in each cluster. Then, summarystatistics for all street network nodes within each cluster are generated. These scores are used tonarrow the optimization nodes to a smaller set of candidate nodes that are sufficiently convenientfor drivers through each cluster of optimization nodes.3.2.1 Optimization Node ClustersGiven a set of network optimization nodes, such as those identified by Phase 1 of this analysis,all nodes adjoining at least one limited-access highway or freeway arc are evaluated by theCFTCM. For each node, the approximate center of its individual highway or street intersection isstored as point data in a GIS environment. Next, the CFTCM groups nearby optimization nodesinto a cluster if they are within cmax network travel miles of one another. There is no limit to thenumber of nodes in a cluster, and individual optimization nodes can belong to multiple clusters.Clusters consisting of only one optimization node are also allowed, in which case the CFTCMsimplifies to the original FTCM metric in Kelley (2017) for individual freeway intersections.Three categories of optimization nodes do not need to be assessed by the CFTCM. First, fornodes adjacent to only arterial roads or surface streets, stations can be built directly at theseintersections without drivers having to navigate limited access highways or freeways. Second,the locations of existing or planned station locations are already fixed. Third, long-distance intercity trip destinations are used to represent the entirety of metropolitan areas outside the primarystudy area.3.2.2 CFTCM SpecificationThe CFTCM identifies the best locations on the local street network within close proximity ofoptimization node clusters. Using a detailed street network dataset in GIS, all street intersections,17
k, are selected that lie within the maximum Euclidean buffer distance, bmax, of any optimizationnode in cluster h. Next, the analyst must identify a set of artificial origins, Ih, and destinations, Jh,for trips that pass through the cluster. These O-D points are placed along all inbound andoutbound major roadways that are included in the simplified optimization network that passthrough any of the optimization nodes in the cluster. These inbound-outbound points are placedbeyond the buffer distance, bmax t
University of Nevada, Reno Reno, NV 89557, USA Email address: scottkelley@unr.edu cNational Marine Environmental Forecasting Center 100081 Beijing, China Email address: xiaofan10243@163.com *Corresponding author: Email address: Qunshan.Zhao@glasgow.ac.uk (Q. Zhao) Present address: Urban Big Data Centre School of Social and Political Sciences