Transcription
NBER WORKING PAPER SERIESMILITARY OFFICER QUALITY IN THE ALL-VOLUNTEER FORCEMatthew F. CancianMichael W. KleinWorking Paper 21372http://www.nber.org/papers/w21372NATIONAL BUREAU OF ECONOMIC RESEARCH1050 Massachusetts AvenueCambridge, MA 02138July 2015The views expressed herein are those of the authors and do not necessarily reflect the views of theNational Bureau of Economic Research.NBER working papers are circulated for discussion and comment purposes. They have not been peerreviewed or been subject to the review by the NBER Board of Directors that accompanies officialNBER publications. 2015 by Matthew F. Cancian and Michael W. Klein. All rights reserved. Short sections of text, notto exceed two paragraphs, may be quoted without explicit permission provided that full credit, including notice, is given to the source.
Military Officer Quality in the All-Volunteer ForceMatthew F. Cancian and Michael W. KleinNBER Working Paper No. 21372July 2015, Revised August 2015JEL No. H56,J4ABSTRACTWe show a statistically significant and quantitatively meaningful decline in the intelligence of MarineOfficers from 1980 to 2014 as measured by their scores on the General Classification Test (GCT)which has been shown to be a good predictor of success in the military. This contrasts with the increasingquality of enlisted personnel since 1973 when conscription ended. We argue that the source of thisdecline is the greater number of young Americans in college since Marine officers must have a four-yeardegree. The increasing diversity of the pool of incoming officers has not contributed to the declinein GCT scores.Matthew F. CancianFletcher SchoolTufts UniversityMedford, MA 02155matthew.cancian@tufts.eduMichael W. KleinFletcher SchoolTufts UniversityMedford, MA 02155and NBERmichael.klein@tufts.edu
I.IntroductionThe question of “Who serves when not all serve?” has been a central issue inthe all-volunteer United States military, even before the end of conscription in1973.1 Advocates for the end of the peace-time draft argued conscription was, in thewords of Milton Friedman, “inequitable and arbitrary, seriously interfer[ing] withthe freedom of young men to shape their lives.”2 Others, however, were concernedwith the potential quality of an all-volunteer force.3 Given the strong link betweenintelligence and job performance, the military has measured the quality of itsenlisted force by their scores of intelligence tests. While the military servicesinitially faced challenges in attracting high-quality enlisted personnel, the problemsseemed to have been resolved by the late 1980s. Bernard Rostker, one of theforemost experts on military manpower analysis, declared in his 2006 RANDmonograph I Want You that “the alternative to the draft, the all-volunteer force, hasbeen a resounding success for the American military and the American people.”4Even during the most trying years of conflicts in Iraq and Afghanistan, around 60percent of new recruits were deemed “high-quality,” possessing a high schooldiploma and being above the average intelligence of the American population(compared to a low of 27.1 percent of new recruits deemed high-quality in 1977).See In Pursuit of Equity: Who Serves When Not All Serve, United States National Advisory Commission onSelective Service, 1970. This commission is commonly referred to as the Gates Commission after its Chairman,Thomas Gates, Jr., a former Secretary of Defense in the Eisenhower administration.2 Capitalism and Freedom, p. 363 See, for example, Janowitz and Moskos (1974).4 Rostker (2006), p. 911
The success of the volunteer military in attracting high quality enlistedrecruits, however, does not necessarily carry over with respect to its ability toattract high-quality officers.5 Commissioned officers comprise about 16 percent ofthe military, but they make up its leadership and exert a disproportionate impacton military effectiveness. The importance of the intellectual capability of officers isexplicitly stated in the foundational Marine Corps Doctrinal Publication 1 (1997)“A leader without either interest in or knowledge of the history and theoryof warfare—the intellectual content of the military profession—is a leader inappearance only. Self-directed study in the art and science of war is at leastequal in importance to maintaining physical condition and should receive atleast equal time. This is particularly true among officers; after all, the mindis an officer's principal weapon.” (p. 64)There is anecdotal evidence of a decline of intelligence in the officer corps; MajorJohn Jordan writes in the Marine Corps Gazette in 2014“A frequent topic of discussion in the pages of the Marine Corps Gazette isthe difficulty of developing critical thinking skills in Marine Officers. Thepersistence of this theme implies that these essential skills are not asprevalent as they need to be; in fact, most Marines could easily point toexamples of officers of any grade who seemingly lack these faculties.”6There is also deep concern about the consequences of this lack of critical thinkingskills among the officer corps in a military that increasingly emphasizes “maneuverwarfare” in which control is decentralized and in which junior officers must have acommand of technical skills, be sensitive to the social environment and culture inwhich he or she is deployed, and plan and implement complex operations.7In the American military, officers are said to receive a commission for service rather than enlisting. Enlistedpersonnel can be promoted to be non-commissioned officers, but these positions are distinct from those ofcommissioned officers (who are simply called officers, the term we will henceforth use in this paper).6Major John Jordan, “Wanted: Critical Thinkers,” Marine Corps Gazette, vol. 98, issue 4, April 2014.7See Cancian (2015) for a further discussion of these points.52
Up until now, however, there has been no systematic study of trends in officerintelligence, nor of what factors are most influential on the average intelligence ofincoming officers. In this paper, we show that the intelligence of officers in theMarines, as measured by scores on the General Classification Test (GCT), a testthat all officers take, has steadily and significantly declined since 1980.8 Forexample, the GCT score in 1980 that demarcated the lower one-third of new officersthat year demarcated the lower two-thirds of the new officers in 2014. While 85percent of those taking the test in 1980 exceeded 120, the cut-off score for Marineofficers in World War 2,9 only 59 percent exceeded that score in 2014. At the upperend of the distribution, 4.9% of those taking the test scored above 150 in 1980compared to 0.7% in 2014. This negative trend could contribute to adverseconsequences for military effectiveness and national security.We also examine the relationship between the annual averages of these testscores and the size and composition of the pool of potential officers (i.e., collegegraduates), labor market conditions, and the ethnic, racial and gender compositionof incoming officers. We find that the dominant correlate to the declining GCTscores over time is the expansion of the pool of potential officers as the ranks ofcollege graduates has risen over the past three decades. There is no evidence thatthe increasing proportion of women or African Americans in the ranks of incomingofficers are independent causes of the decrease in test scores, and while in some8 As discussed in more detail below, we obtained individual-level information on the universe of Marine OfficerRecruits who took General Classification Test (GCT) from 1980 to 2014. The data provided do not include anyindividual level characteristics, such as race or gender, in order to preserve privacy for the test takers.9 Nalty and Moody (1970).3
specifications there is a significant effect of the proportion of incoming Hispanicofficers on these scores, largely because of the rapid increase of Hispanics attendingcollege, the quantitative effect of this on the average GCT is very small,representing only about 5 percent of the decline; the other 95 percent is due to theexpansion of the pool of non-Hispanic college students.The next section of this paper traces the history of intelligence testing by theAmerican military in the 20th century. This section also includes a brief discussionof America’s return to an All-Volunteer Force in 1973. Section III presents ouranalysis of the GCT individual-level data that shows a steady and significantdecline in the mean scores across the period 1980 to 2014 as well as a significantshift in the distribution of the scores. Section IV presents a regression analysis ofthe partial correlates of annual mean test scores with the characteristics of thepotential pool of officer candidates, the gender, racial, and ethnic characteristics ofthe candidates, and labor market and other factors that could potentially affect thequality of incoming officers and, therefore, the GCT scores. We offer someconcluding comments in Section V.4
II.The General Classification TestThe military developed new intelligence tests at the beginning of World WarII in order to classify incoming servicemen during the huge buildup of forces. TheArmy General Classification Test (initially called the AGCT to distinguish it fromthe Navy’s test, but subsequently called simply the GCT) was given to all enteringservice members due to its utility in sorting initial entrants into the military. Bythe end of the war, over 12 million men and women had taken this test. The GCTwas designed to have a mean score of 100 and a standard deviation of 20 (standardIQ tests have standard deviations of 15). Those who took the test were placed inone of five categories, with Category I being those with the highest scores. In a1946 Science article, one of the creators of the test, Walter V.D. Bingham, statedthat the average score for college graduates was 130, which was the lower boundaryfor a test-taker to place in Category I.The link between intelligence, as measured by the GCT, and militaryperformance was systematically studied during World War II. Research found thatenlisted soldiers in Category IV or V (those with GCT scores below 90) were not ableto learn at the same pace as soldiers of average mental ability, and Special TrainingUnits were established to prepare these men for basic training.10 Studies alsoshowed that the GCT was a powerful tool for predicting officer performance in basictraining. In World War II, enlistees in the army without a college degree whoscored above 110 on the GCT were considered for Officer Candidate School (OCS),10Bingham (1947).5
which was used to train and screen potential officers (those with a four-year collegedegree could be commissioned without taking the GCT). A candidate’s GCT scorewas found to be highly correlated with his or her success at OCS.11 In fact, therewas much debate about whether 110 was a sufficiently high minimum score forenlistees to enroll in OCS since most of the failures at that school were fromcandidates who scored between 110 and 115.12The GCT had been replaced by the Armed Services Vocational AptitudeBattery (ASVAB) by the time the All-Volunteer Force (AVF) began in 1973 for allbranches of the services. Out of all the services, the GCT is only still administeredin the Marine Corps, and there only to officers. The GCT was found to be highlypredictive of officers’ success at The Basic School, a six-month training course thatall new Marine officers take in Quantico, Virginia.13 While the importance of theGCT in deciding a young officer’s Military Occupational Specialty has declined,those who take it continue to treat it as a serious and important requirement.14All candidates to become officers in the Marines, except those coming fromthe Naval Academy, must complete Officer Candidate School (OCS) in Quantico,Virginia, as well as completing a four-year Bachelor degree.15 There are severalprograms that may take an aspiring officer candidate to OCS, such as the ReserveOfficer Training Corps (ROTC) or the Platoon Leader’s Class (PLC).Palmer (1948).The minimum score for Marine Officers in World War 2 was 120: (Nalty and Moody, 1970)13 Stoloff (1983).14 Anecdotally, one of the authors can attest to the seriousness with which it was taken when he was alieutenant at The Basic School in 2009; it is hard to find a group of young people quite as earnest andcompetitive as new Marine lieutenants.15 Graduates of the Naval Academy typically represent around 15% to 20% of each year’s group of new Marineofficers.11126
OCS represents the primary screening tool for Marine officers, with gradesdetermined through a combination of physical fitness, academic, and leadershipevaluations. There is usually a 40% attrition rate at OCS. Failure is not often dueto academic evaluations; in fact, academic talent is not a good predictor of success atOCS.16 Rather, most failures come from orthopedic injuries that arise because ofthe physical intensity of the course, or from failures to exhibit leadership.17 Thosecandidates that successfully complete OCS are commissioned as second lieutenantsupon receipt of their Bachelor’s degree (or upon completion of OCS if they alreadyhave their degree). One could offer a simple formula for creating a Marine officer inthe years of the AVF: OCS completion 4-year Bachelor’s degree an officer.After commissioning, all Marine officers go to a six-month course called TheBasic School (TBS) in Quantico, Virginia. Newly-commissioned lieutenantsattending The Basic School learn infantry tactics and general knowledge about theMarine Corps. It is here that lieutenants take the GCT, at a consistent time intheir careers and in a consistent environment (as opposed to, say, beingadministered by a recruiter in varying conditions). The Basic School is anacademically intense experience, and success there is strongly predicted by alieutenant’s score on the GCT.18Stoloff (1983).If a candidate fails five academic tests, then they are supposed to fail the course. According to Stoloff (1983),however, this rarely happens. Anecdotally, when one of the authors was at OCS, a few candidates failed fivetests but were prevented from being kicked out by instructors who placed a high value on physical fitness. Asimilar result has been found for Army Officer Candidate School (Allen, Bynum, Oliver, Russell, Young, andBabin, 2014).18 Stoloff (1983)16177
The GCT provides a valuable source of consistently normed test data; unlikethe ASVAB, which is normed every 15-20 years, and the SAT, for which there aredifferent versions given every year, the data from the GCT can be compared acrossyears because the questions remain the same and the scores are not re-normalized.Along with consistency, another reason to consider the GCT is relevance. Accordingto the 2009 version of the Marine Corps Order on Testing, “ the GCT is generallyused as a metric for measuring the intellectual health of the officer corps.” 19 Theintellectual health of junior officers is especially important in the military becausethere is no lateral entry into mid-level management positions and there is an “up orout” promotion system. This means that the military pays a premium in order toattract especially high quality junior officers, as the most senior leaders in twentyyears must be chosen from amongst them.20 Additionally, it has been shown thatmore intelligent officers themselves benefit more from the mentoring of successfulsenior officers.21 If the ‘intellectual health’ of new officers suffers, it affects themilitary not just in the short term, but for a long time. In the next section, weinvestigate the evolution of this health over the past 35 years.Marine Corps Order 1230.5B: Classification Testing, 4Asch and Warner (2001).21 Lyle and Smith (2014).19208
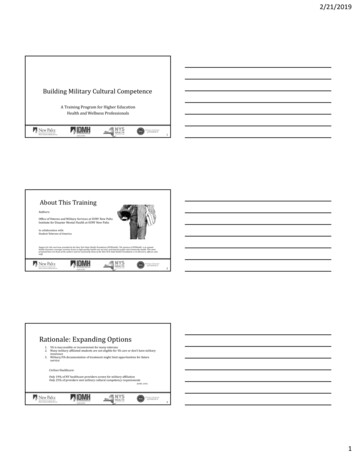
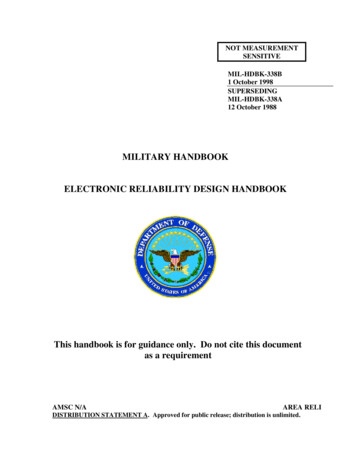
III. GCT Scores, 1980 to 2014We received data on the GCT scores of all officers at The Basic School fromFiscal Year 1980 to Fiscal Year 2014 through a Freedom of Information Act (FOIA)request to the Marine Corps.22 The data we obtained (over 46,000 observations)included only the test scores, with no other individual-level information, for reasonsof privacy. As we show in this section, there was a statistically significant declinein these scores over time and the magnitude of the change is relevant given thedistribution of the scores.Table 1 presents statistics for the mean, standard deviation, range andnumber of observations for every fifth year of the sample, beginning with 1980, andincluding the information from the last year for which we have data (2014) as well.The table shows a steady decline in the average test scores. Figure 1 presents themean GCT score along with the 95 percent confidence interval of the mean for 1980to 2014. The figure shows that the decline in the mean was not monotonic, but thegeneral downward path is evident. The average annual rate of decrease during thisperiod was 0.19 percent per year, giving a cumulative change of 6.6 percent. This22 We received only 272 observations for 2013 (which is roughly the size of one class of TBS), a year in which,according to the Marine Corps Times, over 1,400 Marine officers joined the Corps (to put this in context, wehave 1,320 observations for 2012). In the analysis that follows, we do not use the 2013 observations.9
Table 1: GCT Scores, Statistics for Selected YearsYearMeanSt. 4122.149.6091151Statistics for General Classification Test data described in text.No. of Obs.9631357144814171372139614731080Figure 1: GCT Scores, 1980 - 2014120122124126128130132Annual Means and Their 95 Percent Confidence Intervals19801985199019952013 data incomplete and omitted from graph102000200520102014
corresponds to a decrease in the average GCT score of 8.2 points, which is 80percent of the standard deviation of the 46,341 observations.23The means and standard errors of the means presented in Figure 1 suggestthat there was a significant decline in the average GCT score over time. Table 2confirms this. The statistics reported in this table represent t-tests of thedifferences in means in 1980, 1990, 2000 and 2010. These differences increase withthe difference in years, and are significant at better than the 99 percent level ofconfidence for each ten, twenty and thirty year interval presented in this table.Table 2: Differences in Means of GCT Scores; 37)2000Δ1.76**(s.e.)(0.37)Δ represents difference in means between earlier year (column) and later year(row). Standard error of difference in parenthesis.** Significant at 99 percent level of confidence or higher.23In response to a separate FOIA request (DON-USMC-2014-009339), Marine Corps Recruiting Commandprovided the average SAT scores of new officers from 2005-2014 (the average SAT scores for officers before 2005are not available). According to the scores provided, the average SAT for new Marine Officers is well above theaverage SAT for college bound high-school seniors; for example the average for officers in 2014 was 1,200, ascompared to the overall average of 1,010 for college-bound high school seniors. This is consistent with the resultin 1980, as reported by Stoloff, when the average SAT for Marine officers was 1,050, as compared to 860 overall.11
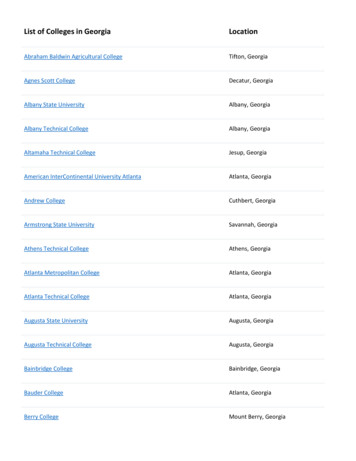
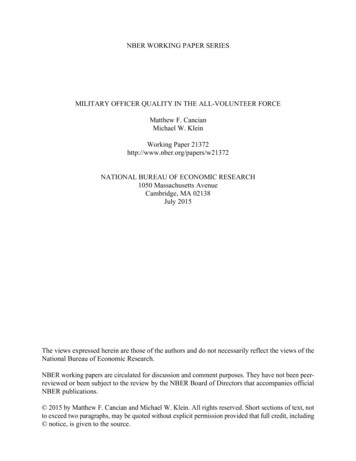
Figure 2 illustrates the change in the distribution of GCT scores in 1980,1990, 2000 and 2010. This figure shows a steady leftward shift in the kerneldistribution of scores across the decades. The Kolmogorov-Smirnoff test allows usto consider whether these distributions significantly differ across time.24 The Dstatistics for these tests, and the associated p-values, are provided in Table 3. Thestatistics in this table show that, in fact, there is a significant difference in thedistribution between each ten-year period, as well as between the longer periods(1980 vs. 2000, 1980 vs. 2010, and 1990 vs. 2010). Thus, the distributions of testscores, as well as their means, exhibit a decline decade-by-decade. In the nextsection, we investigate possible causes of the decline in average annual GCT scores.The Kolmogorov-Smirnov test generates the D-statistic that can be used to test whether two distributions arestatistically distinct, with larger values of this statistic associated with lower p-values for the null hypothesisthat the two distributions are not different.2412
Figure 2: GCT Score Kernel Densities, by Year0.01.02.03.04.05For 1980, 1990, 2000 and 2010901001101201980200013014015016019902010Table 3: Differences in Distributions of GCT Scores; Kolmogorov-Smirnov e)(0.00)(0.00)2000K-S0.092**(p-value)(0.00)K-S is Kolmogorov-Smirnov test of differences in distributions between earlieryear (column) and later year (row), with associated p-value given in parentheses.** Significant at 99 percent level of confidence or higher.13
IV. Determinants of GCT ScoresThe decline in the average GCT scores documented in the previous sectionraises the question of the sources of this change. In this section we address thispoint by regressing the average value of the GCT score in each year against avariety of variables observed at an annual frequency.25The basic framework for our analysis is one that draws on the institutionalfeatures discussed in Section II. In particular, in the period under study, officercandidates must have completed a four-year college degree and, to have progressedto the point to attend The Basic School and take the GCT, the candidates must alsohave completed Officer Candidate School. As mentioned above, attrition fromOfficer Candidate School is typically due to physical limitations or failures todisplay leadership, not due to a lack of intellectual ability that would be reflected inthe GCT. While there has been much written about the effect of militarydemographics and the GI Bill on college participation,26 college participation alsomight have an impact on military demographics. The key point is that the pool ofthose attending and completing college has increased dramatically over time,increasing the pool of potential officer candidates. If the expansion of this pool overtime is biased towards increasing those who were less well-suited for highereducation, then the average intellectual ability of college graduates will decreaseover time. This will be reflected in a decrease in the average GCT score over time ifIdeally, we would have liked to have used information on individuals in order to use a panel data set but, asmentioned above, privacy concerns meant that we only had individual-level GCT scores in each year rather thanthese scores along with any individual-level characteristics.26 For example, see Bound and Turner (2002).2514
there is not a preliminary selection by the Marines towards those with higherintellectual abilities; as we have discussed, OCS does not primarily select or retainbased on intellectual ability.To illustrate this point, we begin with a highly stylized model. For simplicity,consider a situation where the range of intelligence of potential college studentsfollows a uniform distribution bounded by the values L and U. Suppose that themost intelligent potential students go to college but, over time, the collegepopulation expands.27 If the lower bound of those going to college is LC L, thenthe mean intelligence of college students is (U LC)/2 and the proportion of thosegoing to college is (U – LC)/(U – L). If there is an increase in the proportion ofcollege attendees to (U – LC′)/(U – L) where L LC′ LC, then the averageintelligence of college attendees decreases to (U LC′)/2 which is less than (U LC)/2. If the pool of those wanting to become Marine officers is representative of thepool of college attendees, and if there is a positive, monotonic relationship betweenintelligence and GCT scores, then the expansion of the pool of college students willbe associated with lower average GCT scores.28In an effort to test the basic message of this framework, we first investigatethe potential link between college participation and the GCT scores by estimatingthe regression27By some calculations, around 85% of the Americans in the upper quartile of intelligence went to college by1980. See Herrnstein and Murray (1994), p. 34.28 It is straightforward to extend this framework along several dimensions, for example, by allowing for achange in the upper bound as well or for allowing some type of selection into the pool of potential officers that isnot completely neutral with respect to the size of the pool. With reasonable assumptions, these modificationswould not alter the main conclusion on the link between the size of the pool of college attendees and the averageGCT score.15
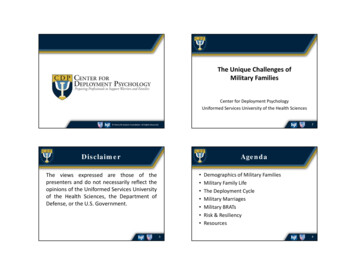
(1)where lnlnln is the logarithm of the average GCT score in year t andis thecollege participation rate of those between 18 and 24 years old, so the regressor,ln , is the logarithm of the average value of the college participationrates capturing the experiences of those who, in year t, are between 20 and 29 yearsold.29 Based on the discussion above, we expect0.30The first column of Table 4 presents the estimate of Regression (1). Thecoefficient on college participation is negative and significant at better than the 99percent level of confidence. The goodness of fit is also very large, with an R²statistic of 0.92. Figure 3 illustrates these results, plotting the observations and theregression line. We calculate the quantitative relevance of this estimated effect byconsidering the proportion of the change in the GCT explained by the rise in thecollege participation rate. The estimated cumulative change in the collegeparticipation variable over the 35 years is 52 percent. The estimated effect ofcollege participation on the GCT is the product of this number and. Theestimated effect of an increasing college participation rate is 96 percent of theactual percentage change in the GCT over this period.29 The proportion of young people who have completed college, rather than those attending college, would be apreferable regressor, but these data are not available.30According to the College Board, the mean SAT scores for college bound high school students has remainedrelatively constant since 1980, even after adjusting the scores for score recenterings. There is some debate onthis point, especially after the 1995 recentering. See for example ‘Educational Reform: 1994-1995’, EducationalExcellence Network, 1995. The result presented in our paper would also be in line with a large meta-analysis ofIQ tests in North America, which suggested that IQ declined when controlling for education during the timeperiod studied. See Uttl and Van Alstine (2003).16
Table 4: Annual Average GCT, College Participation,Labor Market Factors, and Other Potential CovariatesIIIIIIIVVln(College)-0.121** -0.120** -0.120** -0.121** .029)(0.030)ln(Participation t 07 o. of Obs.3430343430Dependent variable is natural logarithm of annual average of GCT scores.Samples: 1983–2012 (if obs 30) or 1980–2014 (if obs 34, 2013 dropped)College is two-year lagged MA(4) of college participation among 18 – 24 y.o.Participation rate and unemployment rate are for 25 – 29 y.o., lagged one year.MilitaryPay/CivilianPay is ratio of Military to equivalent Civilian pay.Number is Number of Officer Recruits in each year.Constant included in each regression, but not reported.Significant at 90% to 95% level †; Significant at 99% level **17
Regression Line and Actual Values, 1980 - 201419821985198019841983198119861987198819941990 05200720082003 200620042009 20122010 201120144.8ln(GCT Scores)4.824.844.864.88Figure 3: GCT Scores and College Participation Rates0 1232.933.13.2ln(College Participation Rate)3.33.4The other columns of Table 4 show the robustness of the effect of collegeparticipation rates on the annual average GCT scores while controlling for otherfactors. Column II presents a regression that includes labor market factors. Therelative pay of young military officers to that of civilians of similar educationalattainment and age is expected to have a positive coefficient, since higher paymakes a military career more attractive to those who might otherwise chose acivilian path. We do find that there is a statistically significant effect of thisvariable on the annual average GCT score at the 90 percent level of confidence. Theother two variables in this regression measure broad labor market conditions, theunemployment rate for those aged 25 to 29 and the labor market participation rate18
for this age group.31 The expected sign of the coefficient on the unemployment rateis negative if a weaker civilian labor market makes a military career moreattractive to college graduates who cannot otherwise find a job. The participationrate is included to control for the possibility that, say, a decrease in theunemployment rate is just reflecting a decrease in labor market participation. Thecoefficient on the participation rate would be negative if a higher participation rateindicates a more vibrant civilian job market and a more limited pool of potentialmilitary officers. But the coefficients on these two variables are not significant inthe estimates presented in this table.The estimates presented in Columns III through V of Table 4 show therobustne
in the Marine Corps, and there only to officers. The GCT was found to be highly predictive of officers' success at The Basic School, a six-month training course that all new Marine officers take in Quantico, Virginia.13 While the importance of the GCT in deciding a young officer's Military Occupational Specialty has declined,