Transcription
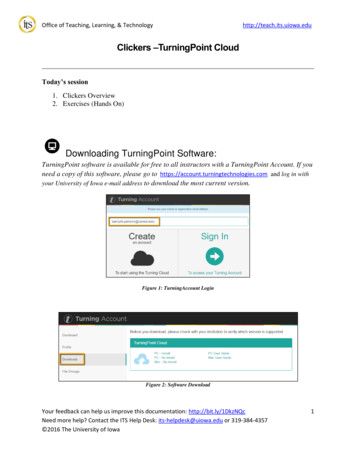
Office of Teaching, Learning, & Technologyhttp://teach.its.uiowa.eduClickers –TurningPoint CloudToday’s session1. Clickers Overview2. Exercises (Hands On)Downloading TurningPoint Software:TurningPoint software is available for free to all instructors with a TurningPoint Account. If youneed a copy of this software, please go to https://account.turningtechnologies.com and log in withyour University of Iowa e-mail address to download the most current version.Figure 1: TurningAccount LoginFigure 2: Software DownloadYour feedback can help us improve this documentation: http://bit.ly/1DkzNQcNeed more help? Contact the ITS Help Desk: its-helpdesk@uiowa.edu or 319-384-4357 2016 The University of Iowa1
Office of Teaching, Learning, & Technologyhttp://teach.its.uiowa.eduEXERCISE ONE – Starting TurningPoint1. Click on the Start Menu button in the lower-left corner of the Taskbar.2. Click on All Apps.3. Navigate to the Turning Technologies, LLC folder.4. Select TurningPoint Cloud.5. You will then login to this program with your HawkIDcredentials.Figure 3: HawkID LoginYou may see a message prompting you to “Allow TurningPoint Cloud to remember mylogin credentials.” before you reach the software.6. From the main Dashboard you can select from PowerPoint Polling, Anywhere Polling,and Self-Paced Polling.Your feedback can help us improve this documentation: http://bit.ly/1DkzNQcNeed more help? Contact the ITS Help Desk: its-helpdesk@uiowa.edu or 319-384-4357 2016 The University of Iowa2
Office of Teaching, Learning, & Technologyhttp://teach.its.uiowa.eduToday, we will be covering PowerPoint Polling and Anywhere Polling.Figure 4: TurningPoint DashboardEXERCISE TWO – Enabling ResponseWareResponseWare must be enabled for participants to use ResponseWare as a responsecollector.1. In the right hand corner of the TurningPoint Cloud Dashboard, find the ResponseWarelink. Click “Click to Connect.”2. In the Response Ware Session window, click “Session Options”.Figure 5: ResponseWare Session Window.Your feedback can help us improve this documentation: http://bit.ly/1DkzNQcNeed more help? Contact the ITS Help Desk: its-helpdesk@uiowa.edu or 319-384-4357 2016 The University of Iowa3
Office of Teaching, Learning, & Technologyhttp://teach.its.uiowa.edu3. If you will not be able to monitor Instant Messagingduring your clicker session, be sure that “DisableParticipant Messaging” is selected.o If you would like to only deliver the responsebuttons to your students’ devices, in order tobetter restrict who can answer questions during asession, select “Display response buttonsonly.”o For further information see the TurningPoint userguides: gpoint-cloudo Important: Session Options cannot be changedin the middle of a session.4. Click “Save” to continue.o Optionally: To set a custom ResponseWareFigure 6: ResponseWare Sessionoptionssession ID, click the dropdown arrow in theSession ID field.To reserve a unique Session IDfollow the steps below:a) Click Reserve.Figure 7: ResponseWare Session IDb) Enter a unique SessionID between 4 and 14 alpha or numeric characters, but must contain at least oneletter, i.e. Psych101.c) Click Reserve.5. Click “Start Session” to begin.The Session Status window willopen. This window does notneed to stay open while you poll.6. Click Close to continue.Figure 8: Close ResponseWare Session Window7. Be sure to share your ResponseWare session ID to your participants.Your feedback can help us improve this documentation: http://bit.ly/1DkzNQcNeed more help? Contact the ITS Help Desk: its-helpdesk@uiowa.edu or 319-384-4357 2016 The University of Iowa4
Office of Teaching, Learning, & Technologyhttp://teach.its.uiowa.eduEXERCISE THREE – Creating a Question ListThe primary advantage of the Turning Point Question List is that it can be used in bothPowerPoint Polling and Anywhere Polling1. While in the main TurningPoint dashboard, click on the Content tab at the top.Figure 9: TurningPoint Dashboard - Content Tab2. Click on Content, and then New Question List.3. Name your Question List My Training Question List4. Click Save.You have the option of changing the format of yourquestions by clicking Preferences in the Question ListWizard.Figure 10: Question List WizardFigure 11: Question ListYour feedback can help us improve this documentation: http://bit.ly/1DkzNQcNeed more help? Contact the ITS Help Desk: its-helpdesk@uiowa.edu or 319-384-4357 2016 The University of Iowa5
Office of Teaching, Learning, & Technology5. Click the Question buttonhttp://teach.its.uiowa.edu, and click Add or press Ctrl N until you have 3questions.6. To edit a question, double click on it or click on the pencil/edit button.Figure 12: Edit Questions7. Enter your Question text (see table below) in the “Enter question text” field.Figure 13: Enter Questions and Answer Options8. Click on the letter A in the multiple choice area, a text editor will open for you to enteryour multiple choice answer options.9. Click the Close button after editing the question toreturn to your question list.Figure 14: Close Question Editing10. Complete entering the two remaining questions in your question list. You can use thefollowing questions or create your own multiple choice questions.Your feedback can help us improve this documentation: http://bit.ly/1DkzNQcNeed more help? Contact the ITS Help Desk: its-helpdesk@uiowa.edu or 319-384-4357 2016 The University of Iowa6
Office of Teaching, Learning, & Technologyhttp://teach.its.uiowa.eduAn observation that hasOf the three major types ofbeen repeatedly confirmedgalaxies, the most common inand for all practicalour universe is the:We can confuse learners when we:purposes is accepted as“true” is a(n) .A. LawA. SpiralA. fail to complete B. HypothesisB. EllipticalB. inconsistent grammar in theC. FactC. IrregularD. TheoryD. None of the aboveoptions.C. veer off into another ideaentirely.D. Yes.11. Once you have 3 questions, finish by first clicking Close and then the Save and Closebutton. IMPORTANT NOTE: The Cancel button will allow you to exit the questioneditor but not save your changes.Figure 15: Close Question EditingFigure 16: Save and Close Question ListYour feedback can help us improve this documentation: http://bit.ly/1DkzNQcNeed more help? Contact the ITS Help Desk: its-helpdesk@uiowa.edu or 319-384-4357 2016 The University of Iowa7
Office of Teaching, Learning, & Technologyhttp://teach.its.uiowa.eduEXERCISE FOUR – Creating Chart Slides in TurningPointThe alternative to using the Question List is to create slides directly in PowerPoint.1. After you close your question list, you will find yourself back on the TurningPointDashboard.2. Select the Polling tab.Figure 17:TurningPoint Dashboard - Polling Tab3. Select and highlight the question list you just created in the lower left box under Content.Figure 18: Select Question List4. Click on PowerPoint Polling in the main window of the dashboard.Figure 19: TurningPoint PowerPoint PollingYour feedback can help us improve this documentation: http://bit.ly/1DkzNQcNeed more help? Contact the ITS Help Desk: its-helpdesk@uiowa.edu or 319-384-4357 2016 The University of Iowa8
Office of Teaching, Learning, & Technologyhttp://teach.its.uiowa.edu5. You may see a pop-up window that indicates “importing question list” (if you have manyquestions, this may take a minute or two to import). Important note: You may find in these imported slides you will have to adjustthe position of the graph or increase/decrease font size in order to get individualslides to appear or look correctly. If you are running Microsoft PowerPoint 2016, you will need to close thePowerPoint launching page before you can access the TurningPoint PowerPointslideshow.6. Experiment with changing the chart types using the Objects menu.7. Select Slide #1 in the navigation area on the left-hand side.8. Go up to Objects and select Charts.In this case, start with Horizontal. Feel free to experiment withusing the other chart types and consider what kind of data eachis useful for.Figure 20: Objects - ChartsFigure 21: Objects - ChartsYour feedback can help us improve this documentation: http://bit.ly/1DkzNQcNeed more help? Contact the ITS Help Desk: its-helpdesk@uiowa.edu or 319-384-4357 2016 The University of Iowa9
Office of Teaching, Learning, & Technologyhttp://teach.its.uiowa.eduTo create slides directly in PowerPoint:9. Select New, then Numeric Response. A numeric response can have up to 16 characters.10. In the new slide (#4), replace the Enter Question Text heading with: In what year was the University of Iowafounded?Figure 22: New Question Dropdown Menu11. In the TurningPoint Cloud Slide Pane, find the “AcceptableValue” field. Enter 1847. If needed, Numeric Response question types will allowa range of answers. Enter an acceptable range for thisquestion.Figure 23: Slide Options - Numeric ResponseYour feedback can help us improve this documentation: http://bit.ly/1DkzNQcNeed more help? Contact the ITS Help Desk: its-helpdesk@uiowa.edu or 319-384-4357 2016 The University of Iowa10
Office of Teaching, Learning, & Technologyhttp://teach.its.uiowa.edu12. Next, select New, then Short Answer. Short answer responses can have up to 160 characters.13. In the new slide (#5), replace the Enter Question Text headingwith: Who is the mascot of the University of Iowa?14. In the TurningPoint Cloud Slide Pane, find the “Correct Keyword(s)” field. Enter HerkyFigure 24: New Question Dropdown Menuthe Hawk. If needed, you may enter multiple acceptableanswers, separated with a semicolon. You have the option to enforce capitalization onyour acceptable answers.Figure 25: Slide Options – Short Answer ResponseSee the TurningPoint Cloud User Guides for information on any further Question Types youwould like to add to this slide intCloud/PC/Default.htm.Your feedback can help us improve this documentation: http://bit.ly/1DkzNQcNeed more help? Contact the ITS Help Desk: its-helpdesk@uiowa.edu or 319-384-4357 2016 The University of Iowa11
Office of Teaching, Learning, & Technologyhttp://teach.its.uiowa.eduEXERCISE FIVE – Assigning ValuesYou can assign point totals and set one or more correct answers per slide.1. Select the slide that begins – An observation that has been (Slide 1)2. You should see the TurningPoint Cloud Slide Pane openup on the right-hand side of the TurningPoint window. Ifthis does not display immediately, click on the Preferences menuFigure 26: Preferencesoption.3. Click on Scoring Options.4. Change the Correct Point Value to 10.5. Leave the Incorrect Point Value at 0.6. Click the No Value dropdown next to C and select Correct.7. Repeat the same process (steps 2-5) for Slide Two that begins Ofthe three major types of galaxies 8. The correct answer for slide two is B.Figure 27: ScoringOptions9. Go to slide that has the question: – We can confuse learnerswhen we:10. Change the Correct Point Value in the Scoring Options area to 0.11. Leave the Incorrect Point Value as 0.12. Select A in Scoring Options and set this value as Correct. You’llnotice that when you change one answer option to Correct, other valuesFigure 28: MultipleCorrect Answersbecome Incorrect by default, unless you change their values. Change all answer options toCorrect.13. Save your PowerPoint either to your flash drive or your H: (shared) drive.Your feedback can help us improve this documentation: http://bit.ly/1DkzNQcNeed more help? Contact the ITS Help Desk: its-helpdesk@uiowa.edu or 319-384-4357 2016 The University of Iowa12
Office of Teaching, Learning, & Technologyhttp://teach.its.uiowa.eduEXERCISE SIX – Adding Other Objects to Question SlidesTurningPoint Objects can be added to slides to prompt users to answer within a set time limit orimmediately, to indicate correct answers, and/or give the audience feedback.1. Begin by selecting the slide that begins with Of the threemajor types of galaxies (Slide 2)2. On the menu bar, select Objects and Countdown Clock.3. By default the timer reads 30 seconds.Figure 29: Objects - Countdown Timer4. In the TurningPoint Cloud Slide Pane, select the “Objects” tab.5. In the Countdown Properties window that opens, changeCountdown Seconds from 30 to 10.6. Click the slide. The clock will now display 10 seconds.7. Go back up to Objects.Figure 30: Timer Preferences8. Select Correct Answer Indicator Checkmarko Important Note: You must have a correct answerselected before a checkmark can be added to your slide.See Exercise Five – Assigning Values.9. Save your PowerPoint file to either a flash driveFigure 31: Correct Answer Indicatorsor your H: drive.Figure 32: Completed SlideYour feedback can help us improve this documentation: http://bit.ly/1DkzNQcNeed more help? Contact the ITS Help Desk: its-helpdesk@uiowa.edu or 319-384-4357 2016 The University of Iowa13
Office of Teaching, Learning, & Technologyhttp://teach.its.uiowa.eduEXERCISE SEVEN –Demographic Comparison1. Select the last slide in your PowerPoint presentation.2. Click the New button and select Demographic Assignment.3. Click into your newly created Demographic Assignment slideand enter in the question box at the top:What is your age?4. Add the following answer options: 0-14 15-29 30-44 45-59 60 Figure 33: NewDemographic AssignmentQuestion5. Next click on Toolsand select Demographic Comparison.6. In the Demographic drop down menu, select the question wejust createdFigure 34: Tools Demographic Comparisons7. For your comparison Question, select any of the questions youcreated earlier. For example, you can select the “An observation that has been ”question (Slide 1)8. Click Insert.Figure 35: Assigning Comparison SlideYour feedback can help us improve this documentation: http://bit.ly/1DkzNQcNeed more help? Contact the ITS Help Desk: its-helpdesk@uiowa.edu or 319-384-4357 2016 The University of Iowa14
Office of Teaching, Learning, & Technologyhttp://teach.its.uiowa.edu9. The slide that you have just added will populate a demographic comparison graphAFTER you run your slideshow in presentation mode. Important Note: You’ll notice that the demographic question answers are indicated bythe color key and the question you are examining is listed next to each bar in the bargraph. The demographic responses are indicated by the colored bars. Percentages for eachcolor or demographic variable add up to 100%.Figure 36: Demographic Comparison Graph Important Note: Keep in mind you may want or need to use anonymous settings whenpolling on sensitive questions.Your feedback can help us improve this documentation: http://bit.ly/1DkzNQcNeed more help? Contact the ITS Help Desk: its-helpdesk@uiowa.edu or 319-384-4357 2016 The University of Iowa15
Office of Teaching, Learning, & Technologyhttp://teach.its.uiowa.eduEXERCISE EIGHT –Anonymous Polling1. To enable anonymous polling you can select Anonymous from the dropdown menu thatreads Auto, to the right of Import and Tools in the TurningPoint ribbon at top. Thismethod will prevent you from collecting participant data for the entire presentation.Figure 37: Set Anonymous Polling2. Alternatively, you can set Anonymous polling for an individualslide using the TurningPoint Cloud Slide Pane. Check theAnonymous option under “Question Options” to turn onanonymous pollingFigure 38: Slide Preferences - Anonymous3. You can also set anonymous polling while running your presentation by clicking theAnonymous button on the left-side of the TurningPoint Showbar.Important Note: Polling must be open, and not already in an Anonymous state for theanonymous button to be active.Figure 39: TurningPoint Showbar4. We will show you how to run your presentation in Exercise Nine.Your feedback can help us improve this documentation: http://bit.ly/1DkzNQcNeed more help? Contact the ITS Help Desk: its-helpdesk@uiowa.edu or 319-384-4357 2016 The University of Iowa16
Office of Teaching, Learning, & Technologyhttp://teach.its.uiowa.eduEXERCISE NINE – Testing your SlidesBEST PRACTICE: Always reset your session before testing or polling in class, unless you areusing the Continue Prior Session feature. This will remove any previously collected responsedata. You will be prompted to save any existing data.1. Select Reset from the menu bar.2. Select Session.3. If you have existing data you wish to keep, click Save.4. Change Live Polling to Simulated Polling in the dropFigure 40: Reset Sessiondown menu.5. Select and highlight Slide 1 on the left hand side.6. Run your PowerPoint in Slide Show7.mode.Click slowly through each polling slide, waiting for the Responses boxto change from 0 to 30, before clicking again. (You can also use theright arrow key.) Make sure you wait until the responses reach 30before moving on (see screenshot below).Figure 41: SimulatedPollingFigure 42: Simulated Polling collecting 30 responses8. Notice as you have polling open, the interactive show bar at the top allows you to do thefollowing functions:a.Minimize or Maximize Showbar (the toolbar that is viewable during the SlideShow)b.Repoll question – Clears responses and accepts new responses for currentlydisplayed question. Both original and additional responses are saved.c.Response Display – Displays participants and their responses in real-time.d.e.Show/Hide Response GridInsert/Start/Pause/Adjust countdown timer.f.Insert New Questiong.h.Open an Attendance Poll.Set current slide Anonymous. Cannot be reversed once set.Your feedback can help us improve this documentation: http://bit.ly/1DkzNQcNeed more help? Contact the ITS Help Desk: its-helpdesk@uiowa.edu or 319-384-4357 2016 The University of Iowa17
Office of Teaching, Learning, & Technologyhttp://teach.its.uiowa.edui.Delete last question polled - Deletes the response data from the currentquestion. This does not reset the chart, and the original results may be viewed inPowerPoint but the response data is not saved with the session.j.Display Participant Monitork.Show/Hide connection infol.Display Messaging Window9. When polling is closed, you have the following additional options:a.Toggle display of responses between percentages and countsb.Repoll Questionc.Data Slice - Allows the chart to display only the section of responses thatcorrelate to chosen responses from previous slidesd.View Original Chart - Use this command after using the Toggle ResponseCount or Data Slice commands to return the chart to its original appearance.10. When you are finished, change the Simulated Data drop down back to Live Polling.11. Select Reset to reset the session.12. Select Save regarding the question aboutFigure 43: Reset Datasaving data. (NOTE: normally, we woulddelete simulated data, but we’ll use this datain the next exercise.)Figure 44: Save As: "Simulated Data TurningPoint"Your feedback can help us improve this documentation: http://bit.ly/1DkzNQcNeed more help? Contact the ITS Help Desk: its-helpdesk@uiowa.edu or 319-384-4357 2016 The University of Iowa18
Office of Teaching, Learning, & Technologyhttp://teach.its.uiowa.edu13. For this activity, save the collected data to the Desktop and call it: Simulated DataTurningPoint. (Note that TurningPoint will attempt to save to a Session Folder, but topractice importing session data we need to save to the desktop.)Figure 45: Save Session Data14. Click on the Windows X in the top right corner to close PowerPoint or go to File Close to quit the program.Your feedback can help us improve this documentation: http://bit.ly/1DkzNQcNeed more help? Contact the ITS Help Desk: its-helpdesk@uiowa.edu or 319-384-4357 2016 The University of Iowa19
Office of Teaching, Learning, & Technologyhttp://teach.its.uiowa.eduEXERCISE TEN – Running Reports1. When you exit PPT you should find yourself back on the TurningPoint dashboard (if not,relaunch the application), go to the Manage tab at the top.Figure 46: TurningPoint Dashboard - Manage Tab2. Select Session Import3. Navigate to your desktop and choose the Simulated DataTurningPoint file created in Exercise Nine.4. You have the option to Leave in Place or Move Session.If you choose “Move Session” TurningPoint will be able to locateFigure 47: ImportSessionthe file more easily in the future, so we will use Move Session.Figure 48: Session Import Options5. Click OK after making your selection.o Important Note: When you select Move Session, your file will be moved fromyour original file location (flash drive or H:\ drive). Before using Move Session,you may want to make multiple copies of the file.Your feedback can help us improve this documentation: http://bit.ly/1DkzNQcNeed more help? Contact the ITS Help Desk: its-helpdesk@uiowa.edu or 319-384-4357 2016 The University of Iowa20
Office of Teaching, Learning, & Technologyhttp://teach.its.uiowa.eduo You can choose to Leave in Place, but you may have to reimport your sessionagain the next time you want to use it, as it will not automatically be detected byTurningPoint.o You can find the file location by highlighting your imported session file under theManage tab (see screenshot).Figure 49: Session File Location6. An Import Summary will display your Filename and Action Description. The Statuswill be the listing that your data will be categorized by. For example, below, the Filenameis Simulated Data TurningPoint (1) and the file has been Added to Simulated.Figure 50: Import Summary7. Click OK again.8. Back in the Manage tab, look under Simulated and select the name and date of yoursession.Your feedback can help us improve this documentation: http://bit.ly/1DkzNQcNeed more help? Contact the ITS Help Desk: its-helpdesk@uiowa.edu or 319-384-4357 2016 The University of Iowa21
Office of Teaching, Learning, & Technologyhttp://teach.its.uiowa.eduo Auto indicates that no participant list was used during polling. If you loaded aparticipant list before polling, your session will be listed under the name of yourparticipant list instead of Auto or Simulated.9. With the new Session Filename selected, click the Reports button at the bottom-right.Figure 51: Reports10. Under the reports window, click on Results by Question inthe dropdown at the top-right to see the report type options.Look at some of the different reports available to see whichwould be most useful for you.o Results by Participant and Results Detail will notFigure 52: Available Reportsyield data until TurningPoint Licenses are applied by your students.11. Finally select Export Excel to generate a report.12. Look at some of the reports generated to see which would be most useful for you.13. When you are finished click Close to exit the Results Manager.Figure 53: Close ReportsYour feedback can help us improve this documentation: http://bit.ly/1DkzNQcNeed more help? Contact the ITS Help Desk: its-helpdesk@uiowa.edu or 319-384-4357 2016 The University of Iowa22
Office of Teaching, Learning, & Technologyhttp://teach.its.uiowa.eduEXERCISE ELEVEN – Running TurningPoint AnywhereBEST PRACTICE: Always reset your session before testing or polling in class, unless you areusing the Continue Prior Session feature. This will remove any previously collected responsedata. You will be prompted to save any existing data.1. From the TurningPoint Dashboard Polling tab, select the question list you created underContent in the lower-left box.2. With your Question List highlighted, click on Anywhere Polling in the center pane.Figure 54: TurningPoint Dashboard3. You should immediately notice your first question isloaded in the dropdown menu below the play button. Youcan toggle between your questions by selecting them fromthe question drop-down menu.4. Select theFigure 55: Anywhere PollingSettings gear from the lower-left hand corner of the TP AnywhereWindow.5. Select Session, then Reset Session. If there is previously collected data in the session,you may save or discard it.Your feedback can help us improve this documentation: http://bit.ly/1DkzNQcNeed more help? Contact the ITS Help Desk: its-helpdesk@uiowa.edu or 319-384-4357 2016 The University of Iowa23
Office of Teaching, Learning, & Technologyhttp://teach.its.uiowa.edu6. Begin running your Presentation by pressing the green Play button.7. Using ResponseWare device, if available, connect to your session to try testing your pollsto ensure that they populate your graphs correctly.8. Try opening a browser and asking a few on-the-fly questions, using the “CustomQuestion” tool adjacent to a website of your choice, as demonstrated in Exercise Twelve.9. Notice as you have polling open, the interactive show bar at the top allows you to do thefollowing functions:a.Show/Hide Chartb.Show/Hide Presentationc.d.Response Display – Displays participants and their responses in real-time.Show/Hide Response Gride.Show/Hide Countdown Timerf.Show/Hide Connection Infog.Display Messaging Windowh.Minimize and Maximize the Showbar10. When you are finished polling a question, press the Stop buttonto end polling.11. Cycle through Start and Stop until you reach the end of your questions, pausing to useyour ResponseWare device to respond while your question is live, then stopping the polland moving onto the next question.Your feedback can help us improve this documentation: http://bit.ly/1DkzNQcNeed more help? Contact the ITS Help Desk: its-helpdesk@uiowa.edu or 319-384-4357 2016 The University of Iowa24
Office of Teaching, Learning, & Technology12. Click Once again on the Settings gearhttp://teach.its.uiowa.edu, andfind Session.13. Select Save Session to retain a copy of yourcollected data.14. Save this data to a flash drive or your shareddrive and call it: Anywhere Test DataTurningPoint.Figure 56: Save Anywhere Session15. Exit out of Anywhere Polling by clicking the X in the top-right corner of the Pollingwindow.16. Exercise Ten on running reports can be repeated with your TurningPoint Anywheredata, except you’ll want to set correct answers for any questions you might have insertedthat were not previously in a question list. If you do not do this, student correct orincorrect responses will not be tabulated in your results.17. To assign correct answers to Custom or multiple response questions from AnywherePolling:i. Import your session data as detailed in Exercise Ten.j. Highlight your session under the Manage tab.k. Select Edit Session.l. Find your Custom or Multiple ResponseFigure 57: Edit Sessionquestions and click the edit pencil.Figure 58: Edit Questionm. Under Scoring Options, select the correct answer (See Exercise Five onAssigning Values).n. This will assign the correct answers retroactively and tabulate correct andincorrect percentages when you run a report.Your feedback can help us improve this documentation: http://bit.ly/1DkzNQcNeed more help? Contact the ITS Help Desk: its-helpdesk@uiowa.edu or 319-384-4357 2016 The University of Iowa25
Office of Teaching, Learning, & Technologyhttp://teach.its.uiowa.eduEXERCISE TWELVE – Creating Questions in TurningPointAnywhereFor this exercise, you’ll want to be sure to be running a ResponseWare session.1. Begin your TurningPoint Anywhere session as instructed in Exercise Eleven.2. To add a new question, click the down arrowadjacent to the big green play button. Then selectCustom 3. In the box under Question type: What are theFigure 59: Adding Questionsadvantages of using TurningPointAnywhere?4. In the Answer field type “Polling on topof websites.”Press Enter to return to the next line. Each new line or return representsanother answer for up to ten lines.5. On the next lines, type in: Screenshotfunction, Use with non-PPTFigure 60: Start Pollingapplications, and All of the above. Press Enter after each phrase.6. Select Start Polling at the bottom-right corner of the Custom Question window.7. Your question will begin polling. Answer the question with your clicker. You can clickthe Stop buttonto end polling and regain control of the Anywhere panel.Your feedback can help us improve this documentation: http://bit.ly/1DkzNQcNeed more help? Contact the ITS Help Desk: its-helpdesk@uiowa.edu or 319-384-4357 2016 The University of Iowa26
Office of Teaching, Learning, & Technologyhttp://teach.its.uiowa.eduEXERCISE THIRTEEN – TP Anywhere Screenshots1. From the TurningPointDashboard, go to Manage tab.Figure 61: TurningPoint Dashboard - Manage Tab2. Look under Auto and select the name and date of your session.o Auto indicates that no participant list was used during polling. If you loaded aparticipant list before polling, your session will be listed under the name of yourparticipant list instead of Auto.3. With the new Session Filenameselected, click the Reportsbutton at the bottom-right.Figure 62: Reports4. Under the reports window, click on Results by Question inthe dropdown at the top-right to see the report type options.5. Select Screenshots.6. TurningPoint Anywhere captures a screenshot when pollingis closed. These images are available in the Turning Pointresults and when the results are exported to Excel.7. When you are finished click Close to exit the ResultsManager.Figure 63: Display ScreenshotsFigure 64: Close ReportsYour feedback can help us improve this documentation: http://bit.ly/1DkzNQcNeed more help? Contact the ITS Help Desk: its-helpdesk@uiowa.edu or 319-384-4357 2016 The University of Iowa27
Office of Teaching, Learning, & Technologyhttp://teach.its.uiowa.eduREFERENCE – ICON & Participant List Set UpTurningPoint has three polling options for tracking responses: Anonymous, Auto, or a pre-madeparticipant list. Anonymous collects responses, but does not identify who gave them. Autocollects responses and which device they were connected with. A pre-made participant listidentifies the responses by device ID number and other variables like clicker owners’ names.It is very important to not use the Anonymous participant list if you plan to use the results forgrading. If you forget to choose your pre-made participant list before you run your session,
A numeric response can have up to 16 characters. 10. In the new slide (#4), replace the Enter Question Text heading with: In what year was the University of Iowa ? Figure 22: New Question Dropdown Menu 11. In the TurningPoint Cloud Slide Pane, find the "Acceptable Enter 1847. If needed, Numeric Response question types will allow