Transcription
DOCUMENT RESUMEED 208 767AUTHORTITLEINSTITUTIONSPONS AGENCYPUB DATEHE 014 490Blackburn, Robert T.; And OthersProject for Faculty Development Program Evaluation:Final Report.Michigan Univ., Ann Arbor. Center for the Study ofHigher Education.Fund for the Improvement of Postsecondary Eaucation(ED), Washington, D.C.Jun 80NOTE71p.AVAILABLE FROMCenter for the Study of Higher Education, 2007 Schoolof Education, University of Michigan, Ann Arbor, MI48109 (S5.00).EDRS PRICEDESCRIPTORSMF01 Plus Postage. PC Not Available from BOBS.Behavioral Objectives; *College Faculty; EvaluationCriteria: *Faculty Development; Faculty Evaluation;Higher Education: *Instructional Improvement; Models;Organizational Objectives; Program Development;*Program Evaluation; Program Impleaentation:Questionnaires; *Scholarship: School Surveys; SelfEvaluation (Individuals): Teacher Effectiveness;* Teacher RoleABSTRACTThe project of faculty development programevaluation, developed by the Center for the Study of Higher Educationof the University of Michigan, is described. Project thrusts were: todevelop assessment instruments for judging the success of facultydevelopment programs: to provide formative and sumaative evaluationfor the programs of the 24 participating institutions; and to explorethe effectiveness of a number of strategies aimed at faculty growthin a variety of institutional settings. After a literature search onpotential goals of the faculty development program, experts rateditem and suggested criteria for evaluating whether particular goalshad been reached. Site visits an,; case studies of the facultydevelopment programs at the 24 schools were undertaxen, along withthe design and adsinistratiln of seven survey instruments. There werefour principal surveys (on the faculty role, on teaching, onScholarship, and on program evaluation, plus a demog :apnic sheet,and two secondary surveys (faculty viewing students, andadministrators defining scholarly activity for their faculty. Amongthe findings are the following: faculty apparently have a highlyinternal set of criteria for judging their classroom performancewhich is supported by personal experience with students and isrelatively free from colleagues, and supervisors' opinions; theprofessor's task is to transmit knowledge and skill to able peoplewho agree with the teacher's goals: most faculty will lectureregardless of the course size or level; improving teaching in theclassroom was the faculty's leading desire, followed by the desire toimprove interpersonal skills. Sample survey forms are appended.(SW
PROJECT FOR FACULTY DEVELOPMENTPROGRAM EVALUATION:FINAL REPORTbyRobert T. BlackburnAlice BobergColman O'ConnellGlenn PellinoCenter for the SLudv of Higher EducationSchool of EducationThe University of MichiganAnn Arbor, MichiganJune, 1980,-CRMISSIONTO REPRODUCEHMAAS TCRIALTHISMICROFICHEBEEN GRANTEDONLYBYU S DEPARTMENT OF EDUCATIONNATIONAL INSTI t UTE OF EDUCATIONEDUCATIONAL RESOURCES INFORMATIONCENTER lERICIThis document has been retifOlured asreceived from the person or or(FroItar'onoriginating IIMinor changes have 1.en made to improvereprodu non qualityTO ts of view or opinions stated n this on or Doh,/a
MONOGRAPH SERIESNumberTitle, Author, DatePriceProjecting College and University Enrollments: Aialyzing thePast and Focusing the Future - Wayne L. Mangelson, Donald M.Norris, Nick L. Poulton, and John A.Seeley, February, 1974.43.002AffirmativeActon: Its Legal Mandate and Organizati.onalImplications - Jamie Beth Catlin, John A. Seeley, and MargaretTalburtt, March, 1974. 3.003And Pleasantly Ignore My Sex:Peters, July, 1974. 3.00Academi-. Woman, 1974 - Dianne S.11.4At the Crossroads: A Report on the Financial Condition of theForty-Eight Liberal Arts Colleges Previously Studied in 7heGolden Years, The Turning Point" - Richard Wynn, April, 1976. 3.005TheProprietary School: ,Assessing Its Impact cn the Collegiate:Sector - J. Michael Erwin, February, 1975. a(Historical Involvements and Precedents for the Future) - BetteEverett Hamilton and Martin E. Laufer, July, 1975. 3.007Limited Growth in Higher Education: Indicators, Impacts, andImplications - James R. Didham, Alan L. Hull, George C. Newman,and Ronald E. Wisner, May, 1976. 3.008StructureandEmergence:Proceedings of an Institute onInnovations in Undergraduate Education - Zelda F. Gamson andRichard H. Levy, September, 1976. 3.009The Uncommon School:the University - 4.00Research on Governing Boards and Some Problem Solving Tacticsand Strategies Involving a Professcras a Trustee , Robert T. 4.00TheAdultLearnerinDavid E. Schlaver, August, 1977.10Blackburn, September, 1977.11onAcademicsStudiesand ModesBlackburn, Editor, April, 1978.12Enhancing the Values of Intercollegiate AthleticsColleges - Phillips P. Moulton, August, 1978:T. 4.00Small 4.0013Private College Participation in Planning and Program ReviewActivities of Forty-Five State-Level Higher Education Agencies- Richard F. Wilson and James L. Miller, Jr., June, 1980. 5.0014Planning andEvaluating Professional GrowthPrograms forFaculty - Glenn R. Pellino,Alice L.Boberg,Robert T.Blackburn, and Colran O'Connell, July, 1981. 5.00oTInquiryN-Fobertat
TABLE OF CONTENTS.t4 of Project for Faculty Development Program EvaluationI.OveII.Project icesA.Faculty Development GoalsB.Cover Letter to FacultyC.Faculty Roles and Careers QuestionnaireD.Faculty Attitudes Towards Instruction and TeachingPractices QuestionnaireE.Faculty Scholarship QuestionnaireF.Program Assessment QuestionnaireG.Personal Information Sheet
I.Overview of Project for Faculty Development Program EvaluationThe antecedents of faculty development activities, familiar to thehigher education community of the 1970's, reach back to the last quarterof the nineteenth century.Sabbatical leave programs, American higher education's traditional meansof fostering faculty professional development, were begun at Harvard Universityin 1880 Eells and Hollis, 1962).had followed suit.By the mid-1880's Cornell and WellesleySeven more colleges and universities had begun leaveprograms by the erd of the century.During the first two decades of thetwentieth century at least 40 more colleges and universities inauguratedsuchprograms and by 1970 the majority of all universities and four-year collegesoffered their faculty such regular opportunities for professional development.From the start, however, colleges described sabbaticals as investmer-sin the future of the institution and as means of improving the services thecollege could offer students rather than as opportunities meant primarily toenhance the professional skills of the faculty member.Contemporary faculty development has more immediate antecedents in the1950's.In addition to sabbaticals, travel money for faculty attendance atprofessional meetings, release time to complete higher degrees, facultyretreats, and programs designed to encourage faculty to publish have beenlong-standing practices in institutions (Sikes and Barrett, 1976,p.1).Then the rumble of change began in the 1950's in a very few colleges withearly efforts at student evaluations of their professors.Centra (1976) reports that a 1960 survey of 214 southern colleges byMiller and Wilson found only a few one-shot faculty developmentdesigned to orient new faculty.programsThere appeared to the authors to be very fewwell articulated, comprehensive programs at the time.By the mid-1960's, a
-2-few programs aimed at instructional development had appeared, but it remainedfor the 1970's to see the coord:lation of traditional and newly conceivedfacjilty development activities that were designed to make college teachingmore successful and satisfying for ail involved (Sikes and Barrett, 1976, p. 1).In the "arly 1970's faculty development seemed to sweep the country(Lindquist, 1978).Two national conferences, the beginnings of nationalnetworks of practitioners and experts, were held then; one at Kansas StateUniversity and another at the University of Massachusetts (Longman, 1978,By 1974 the Council for the Advancement of Small Colleges had recognizedp.the potential impact of the faculty development movement and had launched aprogram to provide facilitators to over 40 institutions to assist them indeveloping programs (Longman, 1978, p. 25).Also in 1974, Change Magazinepublished a position paper, Faculty Development in a Time of Retrenchment,by the group for human development in higher education which, according toLindquist (1978), inspired a humanistic wave in the faculty development4movement, one calling for assistance to professors to develop as persons ina humane environment.John Centra's 1975 survey of 2,600 colleges prompted a response from1,783.Close to 60 percent of the respondents, 1,044, or almost half of allinstitutions, claimed to have faculty development programs of some type,evidence of the extent to which the movement had developed.By 1978 theconc, pt had become an umbrella term to incorporate a wide range of activitiesaimed at instructional, personal, and organizational development.ThE U-M Fipse Project DesignThe project for faculty development program evaluation was undertakenby the Center for the Study of Higher Education at the University of Michiganwith the assistance of a grant from the Fund for the Improvement of Postsecondary
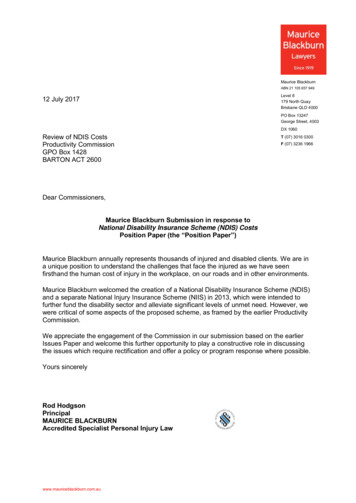
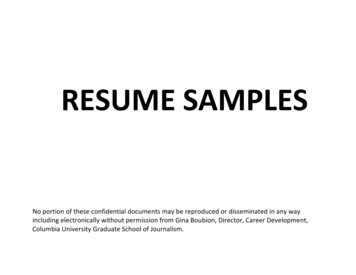
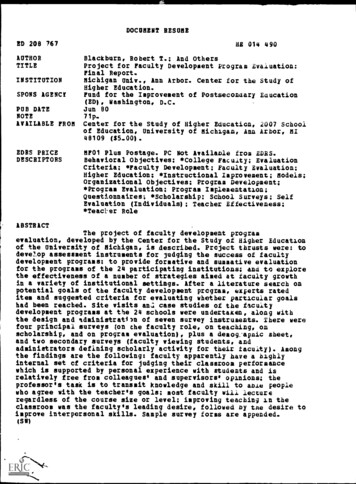
-3-Education in the Fall of 1(478.The 1,,oject included three major thrv,;*s:(1)to develop assessmentinstruments for judging the success of factilty development programs;(2) toprovide formative and summatiVe evaluation for the programs of the 24participating institutions; and(3) to explore the effectiveness of a numberof strategies aimed at faculty growth in a variety of institutional settings.The work included three phases:(I) exploring the field, (II) evaluatingactivities, and (III) inferring the effectiveness of(See Figure A).programs from that evaluation.The first phase, completed between October, 1978 and May,1979, began with a review of the literature on faculty development.the focuses of the literature search was program goals.One ofA selection ofstuaent centered, institutional,instiuctional improvement, personal andprofessional, and research goals wereleaned from the literature.In Novemberan instrument containing a jumbled list of 30 goals was mailed to 56 selectedexperts (either practitioners or writers) across the country.Thirty-fourresponded by rating the items and suggesting criteria by which administratorsmight judge whether or not particular goals had been reached.The goalswhich received highest ratings by the expert respondents are displayed inFigure B.Instructional improvement goals were the clear priority of expertsin the field.It is interesting to note that, for this group of facultydevelopment experts, little concern is expressed for other aspects of thefaculty professional life.Step two, the selecting of 24 institutions suitable for the study wasmade according to Centra's (1976) factor analysis classification of programs.Centra's four classes of programs--high faculty involvement, instructionalassistance practices, traditional practices, and emphasis on assessment- -were used to construct a grid matrix with community colleges, four-yearcolleges, and universities.v
Figure A.Explore the Field(October 1978 May 1979)Project Design:Overview(1)Sketch the Domain(2)Select Institutions(3)Case Studies(A)(B)Review LiteratureSurvey ExpertsCenerate List ofProgram(A)Select Sample - CentraContact InstitutionsNegotiate InvolvementSchedule Site Visits(A)Visit CampusesWrite CasesForward Cases forReviewRewrite Cases(C)B)(C)(D)4(B)(C)(D)(4)Pre Evaluation(5)Evaluation(A)Analyze CasesDevelop Process Modelfor Management ofEvaluationDesign and NegotiateEvaluationDevelop Instruments(A)Administer EvaluationAnalyze DataWrite ReportsForward for ReviewOral Presentations(B)Evaluate Activities(C)(May 1979 December 1919)(C)(D)(B)(C)(D)(E)(coDevelop Manual(A)Prepare Chapters on Faculty,Faculty Development, & EvaluationSynthesize DataHighlight EffectiveActivitiesPresent Evaluation Proceduresand InstrumentsDevelop General ConceptualModel for Faculty DevelopmentReport to FIPSEInfer Effectiveness(B)(C)(January 1980 March 1980)(D)(E)(F)le
-5-Figure B." Expert-Choices of GoalsHighest*Item No.Mean11.(4.500)To create a climate in which the attainment of effectiveteaching is an ongoing concern.38.(4.412)To increase the faculty's skills in instruction, forexample, communication, use of technology, .1.(4.294)To increase faculty responsiveness to student needs bythe adaptation of their courses, .10.(4.206)To increase the faculty's knowledge about the teachinglearning process.25.(4.049)To increase the faculty's repertoire of teaching methods,thrt 3h exposure to a variety of approaches31.(1.471)To improve faculty professional consulting skills.3.(2.029)To generate research on faculty development.17.(2.147)To initiate a periodic review of the performance ofall faculty members.7.(2.176)To facilitate a faculty member's ability to participatein institutional decision-making.35.(2.235)To improve faculty research and scholarship skills.Lowest*(Complete listing of goals in Appendix A.)**On a 5.00 (high) scale of importance.
-6-An initial, but unsuccessful, attempt was made to find two institutionsfor each cell.A literature search identified programs which varied acrossCentra's classification.In addition, administrators in several stateshaving large community college systems were contacted to identify those collegesin their states with,the most successful faculty development programs.Asurvey was then sent in November to identified institutions to solicitinformation describing their programs.to participate in the study.From these, twenty-four were incitedNegotiations were made with presidents andfaculty development directors, and a schedule of site visits was set up forDecember, 1978 - March, 1979.Step three, the writing of case studies, began with site visits toeach campus.Faculty development directors sent information such as brochures,requests for funding, annual reports, and college catalogues for reviewbefore each visit.An interview schedule was used with persons on eachcampus concerned with faculty development activities (deans, presidents,faculty development directors, committee members, and faculty who bothfavored and were critical of programs).After each visit, a description of the program was written to includeinformation on the institutional setting, origin of the faculty developmentprogram, goals of program, organization of program, budget, program changes,and a preliminary qualitative assessment.The case descriptions were sentto the faculty development directors for their review and suggestions formodification.Cases were then revised to include any corrections or suggestions.The cases were completed by June, 1979.During May, 1979 to December, 1979 phase II of the study was completed.Each case study was analyzed.On the basis of information resulting fromthese analyses, a process model for management of the evaluation was developed.(This model will be covered in the section to follow.)
.1-7-Phase III colisisted or the design and administration ofinstruments.a set of surveyThere were seven in all -- four principal ones (on the facultyrole, on teaching, on scholarship, and on program evaluation) -- plus ademographic sheet -- and two secondary ones (faculty viewing students andadministrators defining scholarly activity for their faculty).These wereadministered to faculty from each institutional type, modified, critiquedby national experts in the field, and eventually mailed in various combinationsto random stratified samples of faculty so as to maximize the mix of responses,provide for adequate numbers for analysis, and minimize the time impositionon faculty.The returns are displayed below.As can be seen, there is a varietyin the response rate -- from marginal to extraordinarily large.RESPONSE 565624540Range(%)38-8451-9061-7239-56These percentage returns call for brief comment.32-44Overall17974832-90First of all, since atalmost every institution there were different combinations of instruments sent todifferent faculty, it is not possible to talk about a single response ratefrom an institution.Actually there were several from each.What is expressedhere is e sentially the "average" return.Second, in most cases, follow-up letters were sent to initial non-respondents.However, no extensive pressure was exerted by us to try and increase the responserate.For ex: -ale, the representative on the campus never entered into this*See Figure C for college and university abbreviations and typology.1v
-S-FIGURE C.INSTITUTIONAL ABBREVIATIONSCC:CommulLAC:Liberal Arts Colleges;B.A. or B.S. degreeU:Universities;,'.y/Junior Colleges;Private and PublicAll are private/residential/Private and PublicThe A and B essentially follow The Carnegie CommissionClassification (1976)."B" tends to mean more selective (and "A" leEs selective) withregard to student ability in the case of the LACs.Thisis also true with respect to the Us.In the case of theUs, an "A" most often collects the regional universitieowhich rave few if any doctoral programs.The "B's" tendto be research oriented universities.Inl)
-9-process.we we-No one made phone calls from the campus or from Ann Arbor.In brief,more concerned about getting an adequate number of respondents so thatwe could provide each college with an analy3is than we were of achieving aparticular percentage response.Naturally, we are concerned about the representativeness of the populationwho responded and about the reliability and validity of the instrument.Regardingthese matters, the following ramarka are relevant.in taking a random sample of early and late respondents, matched in numbersof cases for each institution, there was no significant difference between thetwo groups on any of the tested demographic variables -- age, rank, sex, highestdegree, and academic discipline.tween .75 and .85.The F tests produced probability values be-In short, those who were the last respondents to a secondfollow-up were no different in their basic backgrounds from those who answeredthe first request.Consequently it can be argued that those who did not respondare not likely to be different from those whose data are reported.is a representative group of people.This, then,The findings can be expected to be typicalof f-:-.e faculty as a whole.As for the reliability of the instruments a test/retest method was employed.Six / of each of the instrlacross the institutions,ere sent to original respondents randomly selectedIn,er-item coefficients of stability (using the Pearsonpr-;duct-moment correlations) were run for each instrument.Items not obtaininga coefficien, of stability ((.05) were then manipulated using a nonparametrictest (r pair) that analyzes the before and after response of each individual onthe item.This computer analysis also provides a parametric Lest of significanceindicating whether the change in the distribution was significant, i.e., didrespondents change their opinions vs. a change in degree of strength.I
-10--Questionnaire A (Faculty Role)The overall response rate was 48.3%.ranged from .01 to .93.using the rpair test.The coefficients of stabilityTwenty percent of the items requirea further analysisThere was no significant change in distribution on theseitems.Questionnaire B (Teaching),The overall response rate was 60%.from .19 to .90.The coefficients of stability rangedOnly four of the items (3.7%) were not significantly related.The rpair test indicated no significant change on these items.Questionnaire C (Scholarship)The overall resporise rate was 43.3%.The range of the coefficients ofstability was from .02.10 1.00 with 17.8 percent of the items requiring furtheranalysis.The 4gree of change was not significant on these items.Questionnaire D (Program Assessment)The overall response rate was 52% and the coefficients of stability rangedfrom -.33 to 1.00.This questionnaire had a number of yes/no responses causinga number of items to not be significantly related.the items needed to be analyzed further.Over forty percent (40.9) ofOnly one item had a significant degreeof sehange with respondents moving to a higher level of agreement.While on an item by item basis there were some that did not discriminate,as can be seen by the reliability coefficients,these are dependable instruments.The stability of the results are assured, at leaEt over the short run.As a validity check, vita were collected fr n a random sample of faculty.These were coded for publications, age, and sex and correlated with theirself-reported date on the demographic questionnaire.validity.This becomes a measure ofThe coefficients were .95 on sex, .87 on age, .65 on books published,
and .42 on articles written.(The last is in the low side and results morefrom differences of w'iat constitutes a published scholarly article than fromdishonesty in self-reporting.)In summary, the data are fr-,m a representative group o-f your faculty.They have responded to our instruments in a truthful and dependable manner.The reader can have confi.lence in what is reported.II.Project DesignUndertaking an evaluation study of as broad-aimed a set of programs asthe faculty development programs of the 24 institutions in this project presentsunique and challenging problems.Concern for satisfying both the needs of eachof the participating institutions as well as answering the questions of thehigher education community regarding faculty development necessitated the useof an elaborate and flexible evaluation model.Efforts to arrive at a precise definition of the term 'program evaluation'are replete in the literature.Here, we simply offer several broad observationsabout the task of evaluating programs which guided and undergirded this particularproject.First, program evaluation is a prbcess rather than a procedure.It dealswith the formation of judgments about programs using criteria or standards ofcomparison and descriptions of what occurred and resulted in the program.Additionally,it involves the use of information in comparing alternatives inreaching program decisions.Second, program evaluation is more than examining the attainment of objectives.Program objectives are not to be ignored, butit must be recognizedthat often due to the complexities which exist in most programming situations,programs are likely to produce unanticipated results.Sometim,.s the positiveor negative effects of these unforeseen results are as important -- occasionallyeven more important -- than the original objectives.1C
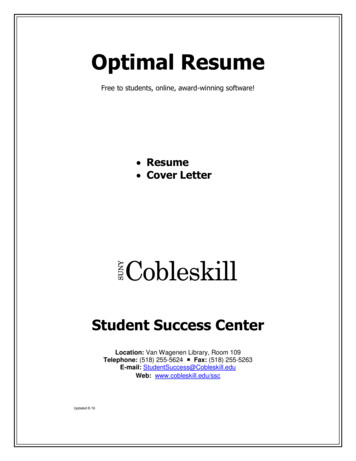
-12-Third, an evaluation which concentrates on the overall effectivenessof a program must be concerned not only with results in terms of behavioralchanges in people but also with the proportion of the potential clientelethat is reached, the extent to which the program deals with perceived andcontinued need, and the care with which resources are utilized.Fourth, blending statistical and descriptive techniques can produce anevaluation design which reinforces the strengths and to some extent alleviatesthe weaknesses of either approach used alone.Statistical measures provide aconcreteness to the research not available from other techniques.Descriptiveevaluation, on the other hand, permits the expression of different weights ofimportance to components of a program.Fifth, and finally, regardless of what methodology is utilized, the primaryinterest in program evaluation is not to arrive at certain findings, as in purescience, but rather to make judgments about the value of a technique, process,activity, or program.The end product of an evaluation should be both a seriesof statements about the desirability and worthwhileness of a program activity,and sufficient information to allow program plannerS to redirect the programin more effective ways.As will become evident, this later consideration hasbeen a major concern of this project.Figure D displays the evaluation model utilized in this project.the evaluation design builds on a standard five-stage planning model.BrieflyEach stagein the planning cycle has a concurrent evaluation component with its own uniquefocus and purpose.Ideally the tasks and products of each planning stage shouldbe identified and evaluated before moving on to the next stage.However, therealities of doing both an external and ex post facto evaluation do not permitthis formative involvement, nor are most programs planned in this intentionalfashion.Yet important data accompany each of the stages in the planning/evaluationprocess, and for this reason an effort was made to recreate the needed data base,for example, the heavy emphasis in the project of uncovering faculty members'1"1
Planning and Evaluation ModelFigure D.PROBLEM SOLUTIONPROBLEM roughnessandComprehensibilityST0NFORMATIVE EVALUATIONIrSUMNATIVE EVALUATIONI"
-14-own assessment of their Leeds.--,The findings presented in the following sections attempt to answer threemajor sets of questions related to the desirability, appropriateness, andeffectiveness of the program under study.First, what do faculty say about their work, the problems they may beexperiencing, and their professional development needs?ISecond, does the current program meet the expressed needs of faculty andhow do faculty feel about its current organization?And third, what do faculty think they have gotten out of their involvement in the program?N.I4,'1
-15-FindingsIII.The faculty responses to the survey instruments administered at the24 colleges and universities are presented below.These responses have beencollected into tables which highlight those questions *hich we feel to bemost significant.(Not all data are tabulated fcr this report.)Somepresentations highlight the similarities and differences across categoriesof institutions -- community/junior colleges, more and !ess selective liberalarts colleges, regional universities, and research universities.B again for classification and abbreviations.)(See FigureOther tables focus on a setof factors within a college or university context.'The tables are essentially self-explanatory.Therefore, comments arerestricted to those items we feel are particularly noteworthy or where theresponses of one group of faculty vary significantly from their colleagues atother institutions.The survey instruments are in the Appendix.The Importance of TeachingAs Table I clearly demonstrates, faculty value very highly theirAP'teaching role, irrespective of institutional type.Faculty in two-year col-leges are more emphatic than those in research universities.When the "agreewith reservations" and "strongly agree" are combined and when the "considerable"and "great" are aggregated, the importance of teaching attains as high as 99percent.Also to be noted in Table 1 is that faculty, and that means all faculty,believe they value teaching more highly than do their colleagues.(Note theright-hand columns for the bottom two items.)About 90 percent of the faculty judge themselves above average orby
-16-TABLE 1,IMORTANCE OF TEACHING (IN PERCENTS)SDInstitutionalType(N)Teaching is the mostimportant part ofacademic role.DStronglyDisagreeDisagreewith ReservationsASAAgreewith 3857LAC-B(201) 173459U-A(238)363754U-B(213)4144617CC(291) 164054Teaching is the mostrewarding asoecr of11,C-A( 72)162865m; 1-rs:ssinnat 27ModerateLittleFnculty members varywith respect to theimportance they attachto teaching.Indicatethe degree cf importanceyou attach to teaching.ConsideratoGreatCC(285)011485LAC-A( 70)011386LAC-B(215) 121880U-A(176)'.021980U-B(269) 152371rEaw much importance doyou think your departpental cnllengues attachto their teachingTCC(296)094745LAC-A( 74)153162LAC-B(224) 164152U-A(184) 1115433U-B(288)3244825
-17-superior teachers, again irrespective of institutional type or level.They are not fully confident that students will judge them(See Table 2.)to be as talented as they believe they are but then, one supposes, studentsreally are not qualified to recognize outstanding pedagogy when they see it.(In another question, 90 percent believi they are getting better each year.)Before taking these impossible statistical outcomes as prima facieevidence that faculty have a seriously distorced self-image and grosslyoverrate the quality of their teaching, a recent study at the University of(Ericksen, 1978)Michiganthe type of institution where undergraduate in-structiTh is claimed to be the very worst, found 90 percent of the facultyrated in the upper two categories by students, a result almost identicalto the one presented here.Moreover, Gaff found that 99 percent ofthe faculty scored themselves as above average.This was true for bothparticipants and non-participants in faculty development programs.AndBaldwin's (1979) study of liberal arts college faculty uncovered similarcorroborating evidence.Teaching is not a faculty problem, for "Themselves.Their colleagues, however, are not quite as good.think.That is what facultyFurthermore, faculty believe tnat students will document theirassertion.I do not need help, but my peers do.Table 3 shows how faculty reach the judgments they do with respectto how good they are as pedagogues.Here the data are presented withincontextual settings.The patterns differ slightly in each settin
SPONS AGENCY PUB DATE NOTE AVAILABLE FROM. EDRS PRICE. DESCRIPTORS. DOCUMENT RESUME. HE 014 490. Blackburn, Robert T.; And Others Project for Faculty Development Program Evaluation: Final Report. Michigan Univ., Ann Arbor. Center for the Study of Higher Education. Fund for the Improvement of Postsecondary Eaucation (ED), Washington, D.C. Jun 80 .