Transcription
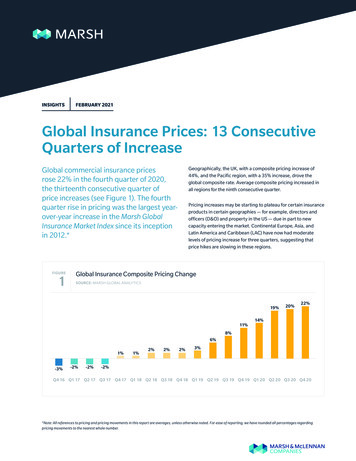
TRENDS IN HIGHER EDUCATION SERIESTrends inCollege Pricingand StudentAid 2021COLLEGEPRICINGSTUDENTAID
Trends in College Pricing and Student Aid 2021 was authored by Jennifer Ma, seniorDEFINING TERMSat College Board.“Costs” refer to the expenditures associated withpolicy research scientist at College Board and Matea Pender, policy research scientistContact Information for the Authorstrends@collegeboard.orgTables, graphs, and data in this report or excerpts thereof may be reproduced orcited, for noncommercial purposes only, provided that the following attributionis included:Source: Ma, Jennifer and Matea Pender (2021),Trends in College Pricing and Student Aid 2021, New York: College Board. 2021 College Board.www.collegeboard.orgdelivering instruction, including physical plantand salaries.“Prices” are the expenses that students andparents face.“Published price” is the price institutions charge fortuition and fees as well as room and board, in thecase of students residing on campus. A full studentexpense budget also includes allowances for booksand course materials, supplies, transportation, andother personal expenses.research.collegeboard.org/trends“Net price” is what the student and/or family mustACKNOWLEDGMENTS“General subsidies” make it possible for institutions toWe thank Dean Bentley, Jessica Howell, and Michael Hurwitz for their thoughtfulfederal, and local appropriations, as well as privatereviews. We also thank the cooperation and support of many colleagues atCollege Board, including Connie Betterton, Mark Bloniarz, Auditi Chakravarty,Karen Lanning, Kevin Morris, Jose Rios, Ashley Robinson-Spann, Michael Slevin,Kayla Tompkins, Marquis Woods, and the Annual Survey of Colleges team.We thank all of those who contributed to the data collection for this publication,especially Tara Marini of the Office of Federal Student Aid, Mike Solomon of theIllinois Student Aid Commission, and institutional research department staff andcampus administrators who provided us with invaluable data through the AnnualSurvey of Colleges.BFF Media Work provided expert graphic design work.MAR-1311October 2021cover after grant aid is subtracted.charge less than the actual costs of instruction. State,philanthropy, reduce the prices faced by allstudents—whether or not they receive financial aid.
HighlightsFor over 20 years, Trends in College Pricing and Trends in StudentAid have been providing timely updates on the prices of attendingcollege and the amount of student aid that is available to helpstudents and families pay for college. Between 2006-07 and 2021-22, the average net tuition and feeTRENDS IN COLLEGE PRICINGINSTITUTIONAL FINANCESPUBLISHED PRICES In 2021-22, the average published (sticker) tuition and fees forfull-time undergraduate students are (Table CP-1):w Public four-year in-state: 10,740, 170 higher than in 2020-21(1.6% before adjusting for inflation).w Public four-year out-of-state: 27,560, 410 higher than in2020-21 (1.5% before adjusting for inflation).w Public two-year in-district: 3,800, 50 higher than in 2020-21(1.3% before adjusting for inflation).w Private nonprofit four-year: 38,070, 800 higher than in2020-21 (2.1% before adjusting for inflation). In 2021-22, average estimated budgets (tuition and fees, roomand board, and allowances for books and supplies, transportationand other personal expenses) for full-time undergraduatestudents range from 18,830 for public two-year in-districtstudents and 27,330 for public four-year in-state students to 44,150 for public four-year out-of-state students and 55,800for private nonprofit four-year students. (Figure CP-1) Over the 30 years between 1991-92 and 2021-22, averagepublished tuition and fees increased from 2,310 to 3,800at public two-year, from 4,160 to 10,740 at public four-year,and from 19,360 to 38,070 at private nonprofit four-yearinstitutions, after adjusting for inflation. (Figure CP-2) In 2021-22, average published tuition and fees for full-timein-district students at public two-year colleges range from 1,430in California and 1,950 in New Mexico to 8,600 in Vermont. From2020-21 to 2021-22, the average published two-year in-districttuition and fees did not increase in 15 states, before adjusting forinflation. (Figure CP-5, Table CP-5 online) In 2021-22, average published tuition and fees for full-timein-state students at public four-year institutions range from 6,100in Wyoming and 6,370 in Florida to 17,040 in New Hampshireand 17,750 in Vermont. From 2020-21 to 2021-22, the averagepublished four-year in-state tuition and fees did not increase in threestates, before adjusting for inflation. (Figure CP-6, Table CP-5 online)NET PRICES AFTER GRANT AID Since 2009-10, first-time full-time students at public two-yearcolleges have been receiving enough grant aid on average tocover their tuition and fees. (Figure CP-8) Between 2006-07 and 2021-22, the average net tuition and feeprice paid by first-time full-time in-state students enrolled in publicfour-year institutions is lowest in 2021-22 at an estimated 2,640,after peaking in 2012-13 at 3,720 (in 2021 dollars). (Figure CP-9)price paid by first-time full-time students enrolled in privatenonprofit four-year institutions is lowest in 2021-22 at an estimated 14,990. (Figure CP-10) State and local funding per student increased in 2019-20 (ininflation-adjusted dollars) for the eighth consecutive year, followingfour years of declines. After adjusting for inflation, total state andlocal funding was 2% higher in 2019-20 than it was in 2007-08, justbefore the Great Recession. However, as a result of enrollmentincreases, funding per student was 4% lower in 2019-20 than it wasin 2007-08 ( 8,640 vs. 9,000). (Figure CP-11A, Figure CP-11B) Net tuition revenue per student accounted for 43% of totalrevenues at public doctoral universities in 2018-19—an increasefrom 33% in 2008-09 and 41% in 2013-14. At other types ofpublic institutions, net tuition as a share of total revenuesdeclined between 2013-14 and 2018-19, after increasing duringthe previous five years. (Figure CP-13) Between 2013-14 and 2018-19, the average subsidy per full-timeequivalent (FTE) student increased (after adjusting for inflation)at public associate and bachelor’s colleges as well as at all typesof private nonprofit institutions. (Figure CP-14)ENROLLMENT TRENDS AND FAMILY INCOME Between 1990 and 2020, inequality in family incomes increased,with income growing fastest for those in the highest incomebrackets. The average income increased by 57% for the topquintile of families and by 12% for the lowest quintile of families.(Figure CP-15A) Between fall 2019 and fall 2020, total postsecondary enrollmentfell by 631,000 (3%). The public two-year sector saw the largestdecline in enrollment—581,000 or 9%. Total enrollment at thepublic four-year and private nonprofit four-year sectors bothdeclined by 0.7% while enrollment increased by 33,000 (3%)at for-profit institutions. (Figure CP-16) Between fall 2019 and fall 2020, total FTE undergraduateenrollment declined by 66,640 (1%) in the public four-year sectorand by 323,440 (8%) in the public two-year sector. (Figure CP-17A,Figure CP-17B) Between 2019 and 2020, all types of institutions saw declines inthe number of international students; international enrollmentdeclined from 402,680 to 352,040 (13%) at public doctoralinstitutions and from 234,520 to 207,290 (12%) at private nonprofitdoctoral institutions. (Figure CP-19) Because of the COVID-19 pandemic, the majority of collegesand universities shifted classes online in 2020. As a result, theshare of postsecondary students enrolled in distance educationcourses increased dramatically between fall 2019 and 2020. Infall 2020, 75% of undergraduate students and 71% of graduatestudents enrolled in distance education courses, comparedwith 36% of undergraduate and 42% of graduate students in fall2019. (Figure CP-20)3
TRENDS IN STUDENT AIDTYPES OF STUDENT AID In 2020-21, undergraduate students received an average of 14,800 per FTE student in financial aid: 10,050 in grants, 3,780 in federal loans, 880 in education tax credits, and 90 inFederal Work-Study (FWS). (Figure SA-1, Table SA-3 online) In 2020-21, graduate students received an average of 26,920per FTE student in financial aid: 8,860 in grants, 17,540 infederal loans, 460 in tax credits, and 60 in FWS. (Figure SA-1,Table SA-3 online) In 2020-21, undergraduate and graduate students received 234.9 billion in grants, FWS, federal loans, and federal taxcredits. In addition, students borrowed about 12 billion fromnonfederal sources. (Table SA-1 online)FEDERAL STUDENT AID Total federal grant aid decreased by 32% in inflation-adjusteddollars between 2010-11 and 2020-21. Pell Grants declined by39% ( 16.4 billion) and veterans’ benefits declined by 3%( 405 million). (Table SA-1 online) In 2020-21, average benefits from the Post-9/11 GI Bill programwere nearly 16,000, compared with just over 4,200 per PellGrant recipient. There were 6.2 million Pell Grants recipientscompared with 614,000 veterans’ benefits recipients. (Figure SA-7) Between 2010-11 and 2020-21, federal loans to undergraduatesfell by 47%, while federal loans to graduate students declinedby 7%. (Figure SA-3, Figure SA-4) FWS and Federal Supplemental Educational Opportunity Grants(FSEOG) combined provided 2.0 billion to undergraduatestudents in 2020-21—1% of the total aid. (Figure SA-3) Average HEERF I funding per FTE student was higher at institutionswith higher shares of Pell Grant recipients. For example, in thepublic four-year sector, average HEERF I funding amounts were 680 at institutions where less than 30% of undergraduatestudents received Pell and 2,750 at institutions where more than60% of undergraduate students received Pell. (Figure SA-20A)PELL GRANTS Pell Grant expenditures rose from 36.2 billion (in 2020 dollars)in 2009-10 to 42.3 billion in 2010-11 but declined to 26.0 billionby 2020-21. (Figure SA-15B) The number of Pell Grant recipients declined by 3.3 million (35%)since peaking in 2011-12. (Figure SA-15B) Between 2010-11 and 2020-21, institutional grant aid rose by 25.6billion (in 2020 dollars) reaching a total of 71.1 billion in 2020-21.Institutional grants accounted for about half of all grant aid forundergraduate and graduate students in 2020-21. (Figure SA-5) State grant aid per FTE undergraduate student increased forthe eighth consecutive year in 2019-20, to 980—an increase of 230 (31%) since 2011-12. State grant aid per FTE undergraduatestudent ranged from under 200 in eight states to over 1,000 in18 states. (Figure SA-17A, Figure SA-18A)STUDENT BORROWING After rapid growth in annual borrowing between 2005-06 and2010-11, total federal loans to undergraduate students declinedby 46% ( 38.6 billion in 2020 dollars) between 2010-11 and2020-21; federal loans to graduate students decreased by7% ( 2.7 billion). (Figure SA-9A) In 2020-21, after the tenth consecutive decline in annual educationborrowing, students and parents borrowed 95.9 billion, downfrom 135.1 billion (in 2020 dollars) in 2010-11. (Figure SA-6) Average federal loans per student peaked in 2010-11 for bothundergraduate and graduate students. Federal loans per FTEundergraduate student declined to 3,780 in 2020-21, from apeak of 6,160 (in 2020 dollars) in 2010-11. Federal loans per FTEgraduate student declined to 17,540 in 2020-21, from a peak of 20,280 in 2010-11. (Figure SA-1) The share of annual federal education loans going to graduatestudents (who constitute about 16% of all students) rose from 32%( 24.1 billion out of 74.5 billion in 2020 dollars) in 2005-06 to 47%( 39.0 billion out of 83.7 billion) in 2020-21. (Figure SA-9A) In 2020-21, 432,000 graduate students borrowed through thegrad PLUS program; 1.5 million borrowed unsubsidized loans.The average amount borrowed through the PLUS program was 8,080 higher than the average unsubsidized loan ( 26,880 vs. 18,800). (Figure SA-9B) Nonfederal education loans fell from about 28 billion (in 2020dollars) in 2007-08 to 9 billion in 2010-11, before increasing toabout 12 billion in 2020-21. (Figure SA-6)STUDENT DEBT As of March 2021, 54% of borrowers with outstanding educationdebt owed less than 20,000; 45% of the outstanding federaleducation loan debt was held by the 10% of borrowers owing 80,000 or more. (Figure SA-10) The average Pell Grant per recipient was 3,360 (in 2020 dollars) As of March 2021, 23% of the 1.59 trillion outstanding federal The 6,495 maximum Pell Grant in 2021-22 is 14% higher in In 2019-20, 55% of bachelor’s degree recipients from public andin 2001-02. It peaked at 4,550 in 2010-11, and fell to 4,220 in2020-21. (Figure SA-16)inflation-adjusted dollars than it was in 2001-02. (Figure SA-16)OTHER SOURCES OF GRANT AID Between 2010-11 and 2020-21, institutional grant aid forundergraduate students increased by 62% ( 22.0 billion in 2020dollars). (Figure SA-3)loan balance was held by borrowers who were 50 or older, upfrom 18% in 2017. (Figure SA-12A)private nonprofit four-year colleges and universities graduatedwith debt and had an average debt level of 28,400. Averagedebt per bachelor’s degree recipient, including both thosewho borrowed and those who did not, was 15,600 for the twosectors combined. (Figure SA-14)4
Contents3 Highlights7 IntroductionTRENDS IN COLLEGE PRICING10 Published Charges,TABLE CP-111 Student Budgets, 2021-22FIGURE CP-12020-21 and 2021-2212 Published Tuition and Feesover Time13 Published Charges over TimeFIGURE CP-2FIGURE CP-3FIGURE CP-4TABLE CP-2Average Published Undergraduate Charges by Sector and by Carnegie Classification,2020-21 and 2021-22Average Estimated Undergraduate Budgets, 2021-22Published Tuition and Fees over TimePublished Tuition and Fees Relative to 1991-92, by SectorTen-Year Percentage Changes in Published Charges, by DecadeTuition and Fees and Room and Board over TimeTABLE CP-3Tuition and Fees over Time (Unweighted)TABLE CP-4Tuition and Fees by Region over TimeFIGURE CP-52021-22 In-District Tuition and Fees at Public Two-Year Institutions by Stateand Five-Year Percentage ChangesTABLE CP-5Tuition and Fees by Sector and State over Time15 Tuition and Fees by State:FIGURE CP-62021-22 Tuition and Fees at Public Four-Year Institutions by State and Five-YearPercentage Changes16 Tuition and Fees by State:FIGURE CP-72021-22 Tuition and Fees at Flagship Universities and Five-Year Percentage Changes17 Average Net Price:FIGURE CP-8Average Net Price over Time for First-Time Full-Time Students at PublicTwo-Year Institutions18 Average Net Price:FIGURE CP-9Average Net Price over Time for First-Time Full-Time Students at PublicFour-Year Institutions19 Average Net Price: PrivateFIGURE CP-10Average Net Price over Time for First-Time Full-Time Students at Private NonprofitFour-Year Institutions20 Institutional Revenues:FIGURE CP-11AAnnual Percentage Changes in State and Local Funding and Public Tuition and Feesover Time21 Institutional Revenues:FIGURE CP-1222 Institutional Revenues:FIGURE CP-13Institutional Revenues per Student at Public Institutions over Time23 Institutional Revenues andFIGURE CP-14Net Tuition Revenues, Subsidies, and Education Expenditures per Student over Time24 Family IncomeFIGURE CP-15AFamily Income over Time by Quintile25 Enrollment Patterns over TimeFIGURE CP-16Enrollment by Level of Enrollment and Attendance Status over Time14 Tuition and Fees by State:Public Two-YearPublic Four-YearFlagship UniversitiesPublic Two-YearPublic Four-YearNonprofit Four-YearState and Local FundingState and Local FundingPublic InstitutionsExpenditures26 Public UndergraduateEnrollment by StateTABLE CP-6FIGURE CP-11BFIGURE CP-15BFIGURE CP-17AFIGURE CP-17B27 Enrollment by Race/EthnicityFIGURE CP-18A28 International EnrollmentFIGURE CP-1929 Enrollment in DistanceFIGURE CP-20Education CoursesFIGURE CP-18BTuition and Fees at Flagship Universities over TimeTotal and Per-Student State and Local Funding and Public Enrollment over Time2019-20 State and Local Funding per Student and per 1,000 in Personal Income and10-Year Percentage Changes in Inflation-Adjusted Funding per Student, by StateFamily Income by Selected Characteristics, 2020One-Year Percentage Change in Public Four-Year Undergraduate Enrollment by State,Fall 2019 to Fall 2020One-Year Percentage Change in Public Two-Year Undergraduate Enrollment by State,Fall 2019 to Fall 2020Distribution of Undergraduate Enrollment by Sector Within Race/Ethnicity, Fall 2020Distribution of Undergraduate Enrollment by Race/Ethnicity Within Sectors, Fall 2020Enrollment of International Undergraduate and Graduate Students by Institution Type,2009, 2019, and 2020Percentage of Postsecondary Students Enrolled in Distance Education Courses,Fall 2012, Fall 2019, and Fall 2020Figures and tables that are only available online at research.collegeboard.org/trends.5
Contents—ContinuedTRENDS IN STUDENT AID31 Total Student AidTABLE SA-1Total Student Aid and Nonfederal Loans in 2020 Dollars over TimeTABLE SA-2Total Student Aid and Nonfederal Loans in Current Dollars over Time: All Students,Undergraduate Students, and Graduate StudentsTABLE SA-1Total Student Aid and Nonfederal Loans in 2020 Dollars over Time: All Students,Undergraduate Students, and Graduate Students32 Aid per StudentFIGURE SA-133 Grants, Loans, and Other AidFIGURE SA-234 Total Undergraduate Student AidFIGURE SA-336 Sources of Grant AidFIGURE SA-5Total Grant Aid by Source over TimeFIGURE SA-7Number of Recipients by Federal Aid Program, 2020-2135 Total Graduate Student Aid37 Types of Loans38 Federal Aid39 Federal Loans: AnnualBorrowingTABLE SA-3TABLE SA-4Average Aid per Student over TimeAverage Aid per Student over Time: All Postsecondary Students, UndergraduateStudents, and Graduate StudentsComposition of Total Aid and Nonfederal Loans over TimeTotal Aid and Nonfederal Loans in Current and Constant Dollars over Time: All Students,Undergraduate Students, and Graduate StudentsTotal Undergraduate Student Aid by Source and Type over TimeFIGURE SA-4Total Graduate Student Aid by Source and Type over TimeFIGURE SA-6Total Federal and Nonfederal Loans by Type over TimeFIGURE SA-8Percentage Distribution of Federal Aid Funds by Sector, 2019-20TABLE SA-5Federal Aid per Recipient by Program over Time in Current and Constant DollarsTABLE SA-7Percentage Distribution of Federal Aid Funds by Sector over TimeFIGURE SA-9ATotal Annual Amount Borrowed in Federal Loans over TimeTABLE SA-6Federal Loans in Current and Constant Dollars over Time: All Postsecondary Students,Undergraduate Students, and Graduate StudentsFIGURE SA-9BAverage Annual Amount Borrowed in Federal Loans over Time40 Federal Loans: Borrowing andFIGURE SA-10Distribution of Borrowers and Debt by Outstanding Balance, FY202141 Federal Loans: OutstandingFIGURE SA-12ADistribution of Outstanding Federal Loan Dollars and Borrowers by Borrower Age42 Federal Loans: OutstandingFIGURE SA-13ADistribution of Outstanding Federal Direct Loan Dollars and Recipientsby Repayment PlanBalancesDebt by AgeDebt by Repayment Plan andRepayment StatusFIGURE SA-11Percentage of Undergraduates Borrowing Federal Loans over TimeFIGURE SA-12BDistribution of Borrowers by Outstanding Balance and Age, FY2021FIGURE SA-13BRepayment Status of Federal Education Loan Portfolio43 Cumulative Debt: Bachelor’sFIGURE SA-14Cumulative Debt of Bachelor’s Degree Recipients at Four-Year Institutions over Time44 Pell GrantsFIGURE SA-15AUndergraduate Enrollment and Percentage Receiving Pell Grants over Time45 Pell GrantsFIGURE SA-16Published Prices at Four-Year Institutions, Maximum Pell, and Average Pell over TimeFIGURE SA-17BPercentage of State Grant Aid Based on Need by State, 2019-20FIGURE SA-18BState Grant Expenditures as a Percentage of Total State Support for Higher Educationby State, 2019-20Degree RecipientsFIGURE SA-15BTotal Pell Grant Expenditures and Number of Recipients over TimeFIGURE SA-17ANeed-Based and Non-Need-Based State Grants per Undergraduate Student over Time47 State GrantsFIGURE SA-18AState Grant Aid per Undergraduate Student by State, 2019-2048 Average Institutional Grant AidFIGURE SA-19AAverage Institutional Grant Aid in 2018 Dollars per First-Time Full-Time Student over Time49 Higher Education EmergencyFIGURE SA-20A46 State Grantsby SectorRelief Fund50 Notes and SourcesFIGURE SA-19BPercentage of First-Time Full-Time Students Receiving Institutional Grant Aid over TimeFIGURE SA-20BDistribution of HEERF I Funding and Full-Time Equivalent (FTE) Students by SectorAverage HEERF I Funding Per FTE Student, by Share of Pell Enrollees and by Sector6
IntroductionShortly after the World Health Organization declared COVID-19a pandemic in March 2020, most colleges and universities in theUnited States moved instruction online as governors orderedshutdowns to contain the spread of COVID-19. During the 2020-21academic year, colleges adopted a wide range of instructionalapproaches, including in-person, online, and hybrid models.1 Thisfall, most colleges fully resumed in-person instruction for the2021-22 academic year.In 2020-21, many colleges froze or had very small increases intuition and yet, many institutions, and especially two-year colleges,experienced declines in enrollment. In 2021-22, we continue tosee historically low increases in average published tuition and feesbefore adjusting for inflation: 1.3% for public two-year in-districtstudents, 1.6% for public four-year in-state students, 1.5% for publicfour-year out-of-state students, and 2.1% for private nonprofitfour-year students. These increases are lower than the inflation ratein the first eight months of 2021. As a result, average tuition and feesdeclined across all three sectors in 2021-22 after adjustingfor inflation.IMPACTS OF THE PANDEMIC ON HIGHER EDUCATIONEnrollmentThe newly released fall 2020 enrollment data from the Departmentof Education confirm findings from the National StudentClearinghouse2 that total postsecondary enrollment declined in2020. However, enrollment changes were uneven across enrollmentlevels, sectors, states, and demographic groups. Between 2019and 2020, total undergraduate enrollment declined by 698,000 andgraduate enrollment increased by 67,000. Across sectors, the publictwo-year sector saw the largest decline in enrollment—581,000(9%); public four-year and private nonprofit four-year sectors sawenrollment declines of less than 1% while the for-profit sector sawits enrollment increase by 3%. (Figure CP-16)At the state level, nine states experienced increases in postsecondaryenrollment at public four-year colleges while all but one stateexperienced declines in enrollment at public two-year colleges.(Figure CP-17A, Figure CP-17B)While the enrollment patterns we present in this report aredescriptive in nature, a recent study shows similar results after takinginto account pre-pandemic trends and student demographic shifts.3The Department of Education’s fall 2020 enrollment data alsoconfirm a dramatic increase in the share of students taking classesonline: 75% of undergraduate students took some classes onlinein 2020, up from 36% in 2019. In fall 2020, 44% of undergraduatestudents took all classes online, up from 15% in 2019 (Figure CP-20).Although research is scant on the long-term impact of onlinelearning, there is some evidence that suggests earnings of studentsat for-profit colleges where most students are exclusively online arelower than earnings of students at other for-profit schools.4Enrollment changes have direct implications for institutions’ tuitionrevenues with net tuition revenue being the largest revenue sourcefor public four-year and private nonprofit four-year institutions.5State and Local FundingIn addition to tuition revenue, public institutions also rely heavily onstate and local funding. In 2018-19, this source provided 27% oftotal revenues at public doctoral institutions, 39% at public master’sinstitutions, 44% at public bachelor’s institutions, and 55% at publictwo-year colleges (Figure CP-13). Generally, state and local fundingdeclines during economic recessions. During the Great Recessionof 2008, per-student state and local funding for higher educationdeclined by 9% between 2007-08 and 2008-09, and the annualdeclines persisted through the 2011-12 academic year before risingfor eight consecutive years. After adjusting for inflation, total stateand local funding was 2% higher in 2019-20 than it was in 2007-08,just before the Great Recession. (Figure CP-11B)The economic shutdowns in the second quarter of 2020 causeddramatic reductions in state tax revenues and some statesannounced funding cuts to higher education in the 2021 fiscal year.Though many feared that more states would announce funding cutsto higher education, the outlook for fiscal year 2022 state funding forhigher education turned positive as the economy rebounded.6The federal government passed the Coronavirus Aid, Relief, andEconomic Security (CARES) Act in March 2020, which providedeconomic relief for state and local governments as well as 14 billionin Higher Education Emergency Relief Fund I (HEERF I) for highereducation institutions and students. Additional funding for highereducation in the amount of 21.2 billion (HEERF II) and 39.6 billion(HEEFR III) was authorized in December 2020 and March 2021,respectively. (Page 49)There are differences in the pandemic’s impact on postsecondaryenrollment across demographic groups as well. While internationalstudent enrollment grew rapidly in the decade from 2009 to 2019,it declined by more than 10% from 2019 to 2020. (Figure CP-19)1 colleges-plans-forreopening-in-the-fall/2 ent-estimates/cteereport fall 2020/3 etention-covid2020.pdf4 Gainfully Employed? Assessing the Employment and Earnings of For-ProfitCollege Students Using Administrative Data5 NCES, Digest of Education Statistics, Tables 333.10 and 333.50.6 cuts/578787/; 022.7
FAMILY INCOME, TUITION, AND COLLEGEAFFORDABILITYIn the last 30 years, income inequality grew as the average incomeincreased by 57% for the highest fifth of families and by 12% for thelowest fifth of families. The latest income data from the U.S. CensusBureau show that median household income decreased by 2.9%between 2019 and 2020.7 In 2020, median incomes for Black andHispanic families were 60% and 62%, respectively, of the median forwhite families. Median income for families with at least one fouryear college graduate was more than twice the median for familiesheaded by a high school graduate. (Figure CP-15A, Figure CP-15B)Recognizing the struggles students and families face in payingfor college, especially during a pandemic, many colleges anduniversities did not raise tuition between the 2019-2020 and 20202021 academic years. In 2021-22, this tuition freeze continued asthe average published two-year in-district tuition and fees remainflat in 15 states and the average public four-year in-state tuition andfees are unchanged in three states. (Table CP-5 online)In addition to providing financial relief for higher educationinstitutions and students, the CARES Act suspended federalstudent loan payments, ended collections on defaulted federalstudent loans, and suspended interest accrual on all federal studentloans through September 30, 2020. Subsequent Executive Ordersextended the student loan provisions through the end of January2022.8 Consequently, as of June 30, 2021, nearly 70% of alloutstanding Direct Loan balances were in forbearance, comparedwith about 10% two years earlier. (Figure SA-13B)It is still early to understand the full impact of HEERF funding onhigher education, but student borrowing and debt were both decliningprior to the pandemic, and it appears that this downward trendcontinues. For example, in 2020-21, total annual federal borrowingdeclined for the tenth consecutive year to 83.7 billion (in 2020dollars), from a peak of 126.0 billion in 2010-11 (Table SA-1 online).The average amount of annual federal loans per FTE undergraduatestudent also declined during this period, from a peak of 6,160 (in2020 dollars) in 2010-11 to 3,780 in 2020-21 (Figure SA-1).Federal Pell Grants, which are awarded to students from lower-incomehouseholds, have been declining since the expansion of the programduring the Great Recession. Between 2010-11 and 2020-21, totalPell Grant expenditures decreased by 39% (from 42.3 billion to 26.0billion in 2020 dollars) and the number of Pell Grant recipients declinedby about a third, from 9.3 million to 6.2 million. (Figure SA-15B).Under the CARES Act, the U.S. Department of Education distributedfunds to institutions using a congressionally mandated formula,which required 75% of the funds to be distributed based on fulltime equivalent (FTE) enrollment of Pell recipients and the remaining25% based on the FTE enrollment of non-Pell recipients. Unlikethe permanent maximum Pell Grant increase legislated throughthe American Recovery and Reinvestment Act of 2009 that led toincreased benefits for more students, the CARES Act did not changethe foundations of the Pell program.WHAT IS NEW IN THIS YEAR’S REPORTHEERF I Funding AnalysisIn this report, we show that, on average, public institutions receivedmore HEERF I funding per student than private nonprofit andfor-profit institutions. In addition, schools with higher shares of Pellrecipients received more funding per student than schools withlower shares of Pell recipients (Figure SA-20A).Student Debt by AgeMany borrowers continue to hold education debt well into adulthood.Figure SA-12A shows tha
Trends in College Pricing and Student Aid 2021 was authored by Jennifer Ma, senior policy research scientist at College Board and Matea Pender, policy research scientist at College Board. Contact Information for the Authors . trends@collegeboard.org . Tables, graphs, and data in this report or excerpts thereof may be reproduced or

