Transcription
Project ReportMRTG Installation,Implementation andConfigurationPrepared by: Parvez IbrahimSubmitted to: M.H. MacGregor, PhD, PEng, SMIEEEAssociate ProfessorDirector, MSc in InternetworkingDepartment of Computing Science
Table of Contents1. Introduction2. Acknowledgement3. Chapter 1MRTG and RRDTOOL4. Chapter 2Network and OSPF Configuration5. Chapter 3MRTG / RRDTOOL Configuration / Implementation6. Chapter 4MRTG Results7. Chapter 5MRTG Implementation in NorQuest College8. Conclusion
AcknowledgementI take pleasure in thanking Dr. Mike MacGregor, for supervising this project. He helped us notonly as the supervisor of our project, but also with many other supports to make sure properprogress of the project. During many discussions I had with him, I always felt that I got in to thecorrect track.I would also like to thank Dr. Mike MacGregor for all his time and resources he provided us forthis project. Without his help and support I think we were not able to complete this project. Heis very friendly and kind person.
Introduction and BackgroundThis project is based on MRTG application. Objectives of this project are to Study functions andfeatures of MRTG Application, Implementation and configuration MRTG in the Mint Lab. Setupnetwork scenario in Mint Lab. Monitor network traffic load through MRTG application, SetupMedia Server, Proxy Server and FTP Server (video streaming) in the scenario and monitor thenetwork traffic through MRTG and submit the report.The project begins with the study of MRTG application and it requirements for installation andimplementation. A Network was designed, configured and implemented.Network of sixrouters has been setup and OSPF protocol selected to configure as a communication protocols.Network is divided into three areas. DR and BDR have been elected.Simple NetworkManagement Protocol (SNMP) is also configured on all router for monitoring the traffic andcurrent situation of routers. The Simple Network Management Protocol (SNMP) is anapplication layer protocol that facilitates the exchange of management information betweennetwork devices. It is a part of the Transmission Control Protocol/Internet Protocol (TCP/IP)protocol suite.Four types of Servers have been setup and configured for traffic monitoring and to check load onrouters these Servers are Media Server, File Server, Proxy Server and MRTG Server for trafficmonitoring. For media server VLC, CuteFTP and WinFTP for file Server and WinGate Serverfor Proxy. Traffic has been monitored on different network. All the traffic (video streaming, fileserver, proxy server) was sent through one network and then traffic was distributed to differentnetworks.Multi Router Traffic Grapher (MRTG) is a tool to monitor the traffic load on network links wasdownloaded from internet, version mrtg-2.15.2 (latest) is used in our project. We have capturedin and out, TCP and UDP packets for which script mrtg.cfg has been created. MRTG.CFG is thebasic script file for MRTG which only capture in and out traffic. We have researched what OIDsare required to captured packets for TCP and UDP. After monitoring traffic by MRTG forseveral weeks we have also explored RRDTOOL which is more user friendly and the graphicalimages are very good but this tool is difficult to configure than MRTG. To capture data throughRRDTOOL we have selected two CGI scripts 14all and routers2 which are also downloadedfrom the internet and amended as per requirement.
Finally we have installed MRTG/RRD Tool in Norquest college for more than month we havemonitored traffic load two weeks one firewall and two weeks on fortigate router. Fortigate alsoused for the remote access which Norquest used from home mostly after office hours.We have captured different type of traffic through MRTG. For that we have used different OIDsby editing MRTG.cfg. To monitor traffic load on different routers interfaces we have developed7 to 8 configuration files these files were developed differently.At the end of the report we are presenting MRTG result and conclusion. In the MRTG resultsnumber of MRTG graph including traffic in/out, daily, weekly, monthly, UDP and TCP areshowed.
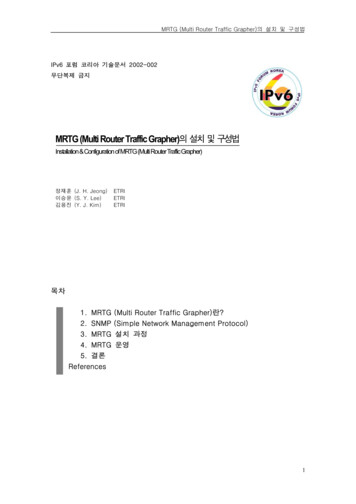
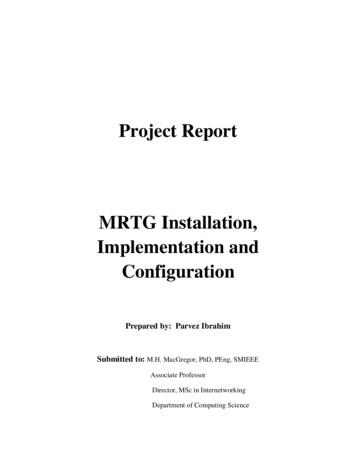
Chapter No. 1MRTG and RRDTOOLConventional Systems of Data Collection and PresentationIf we see in past, analyzing data was very challenging work. The network analysts use telnet to arouter and execute commands that can give them information they need, the information showedin the text format and the network analysts have to compare the data with the other data toanalyze the network traffic load which is in no way accurate and efficient system.Presently there are some tools to analyze the network activities graphically, which is also easilyreadable format but we can also compare the data with other routers data on the networkgraphically. This is very important in network analysis. This allows us to not only tell howmuch traffic is flowing, but where it is being sent on the network. We can also determine thesource of bandwidth bottlenecks and use this information, For example, if we see a graph with alot of traffic flowing out of one router, we can see the same traffic flowing into the other routerson the network, just by glancing at the graphs. This cannot be easily accomplished by the rawtext console method.MRTG and RRDtoolOur assignment for the project is to find a way to connect to the routers, pull out the numbers inthe counters, and graph them over time. Before starting the project, we went online andresearched existing software packages that are designed to do this. There are many toolsavailable on internet but there are two that stand out above the rest. They do the best job, andhave been the most widely used and documented. They are the Multi-Router Traffic Grapher(MRTG) and the Round-Robin Database Tool (RRDtool).Multi-Router Traffic GrapherMulti-Router Traffic Grapher is a tool that collects, stores, and graphs data on a given interval.SNMP which reads the traffic counters from network device like router and then it is C programlogs the traffic data and creates graphs representing the traffic in and out on the network. MRTGconsists of a Perl script. These graphs are embedded into web pages, which can be viewed fromany internet browser. See Figure A below is an example of an MRTG graph. In the graph blue isfor bytes out and green for bytes in.
Traffic Analysis for 1 – MINT LAB -- routerDThe statistics were last updated Friday, 7 September 2007 atSystem:routerD in21:29,Maintainer:at which time 'routerD' had been up for 18 days, 3:41:40.Description: FastEthernet0/0ifType:ethernetCsmacd (6)ifName:Fa0/0Max Speed: 12.5 MBytes/sIp:10.1.32.3 () Daily' Graph (5 Minute Average)Fig A.MRTGFeatures and IssuesOne of the MRTG feature is its configuration file. We can generate configure file manually thismeans that we can make our own configuration file in notepad or any other text editor or autogenerated by executing cfgmaker file but cfgmaker generates only a basic configuration file foradvance level configuration file we need to edit that auto-generated file manually and add morescript in it. MRTG's data files do not grow. We can edit the configuration file when ever wewant. Daily, weekly and monthly graphs can easily been seen graphically. There some issues thatinvolved with MRTG.One of the issues with MRTG is that it creates all the graphs every time it runs. In our case, weare graphing number of interfaces on four to six routers. This results a large CPU utilizationevery 5 minutes. Another issue with MRTG is little flexibility and few customization options.On the other hand RRDTool has nice graphical interface and more flexibility as compare toMRTG.
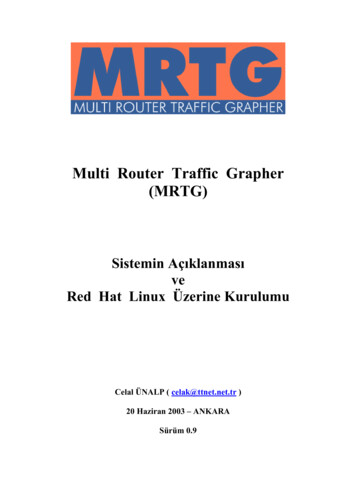
Round-Robin Database Tool (RRDtool)RRDtool is similar kind of tool as MRTG. We can also say it is an extension of MRTG’scapabilities. RRDtool is not a replacement for MRTG, as RRDTool cannot implement the frontend and data acquisition features of MRTG. MRTG can be configured in a way that RRDtool isused as its database which is used at backend and at the frontend we can use CGI script.Graphing with RRDtool is very flexible. Generated graphs can contain any and all informationone can require. The RRDtool graphs are similar to the MRTG graphs, except that the RRDtoolgraphs contain more information. See fig B.Top Router MINT Lab-System:Top RouterMaintainer:Description: FastEthernet 0/0ifType:FastEthernet 0/0 (71)Max Speed: 12500000 kBytes/sIp:192.168.0.2 (par-pc.mshome.net)The statistics were last updated: Tue Nov 6 22:15:24 2007'Weekly' graph (30 Minute Average)Fig B Graph generated by RRDtool.
RRDtoolRRDtool provide better graphical interface. RRDtool has many features and capabilities ascompare to MRTG and we have found RRTool more complex than MRTG to install andconfigure. The data storage algorithms described below is much more efficient, yet much harderto grasp than those of MRTG. The following is taken from the RRDtool website.When monitoring the state of a system, it is convenient to have the data available at a constantinterval. Unfortunately we may not always be able to fetch data at exactly the time we want to.Therefore RRDtool lets us update the log file at any time we want. It will automaticallyinterpolate the value of the data-source at the latest official time-slot and write this value to thelog.Logging data over a 3 minute interval, but if we want to know the development of the data overthe last few hours, the last week, or the last month. RRDtool offers a solution to this problemthrough its data consolidation feature. When setting up a Round Robin Database (RRD), we candefine at which interval this consolidation should occur. There can be multiple consolidationfunctions for each RRD and they will all be maintained when new data is loaded into thedatabase.Data values of the same consolidation setup are stored into Round Robin Archives (RRA). Thisis a very efficient manner to store data for a certain amount of time, while using a known amountof storage space. The use of RRAs guarantees that the RRD does not grow over time and that olddata is automatically eliminated. By using the consolidation feature, we can still keep data for avery long time, while gradually reducing the resolution of the data along the time axis.RRDcgiOne of the most useful features of RRDtool is its RRDcgi module.RRDcgi is a web scripting module that eliminates the creation of all the graphs on every step ofthe interval. It is one of the most useful features of the RRDTool. RRDcgi is embedded into aweb page and makes a call to RRDtool to graph only the graphs that are requested by the webpage. So RRDtool only generates the graphs, when you want to see them. This makes RRDtoolmuch more efficient than MRTG.
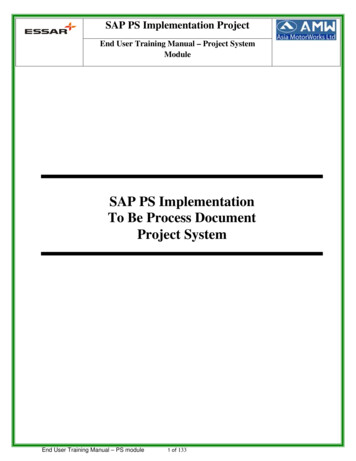
Chapter No. 2 Network and OSPF ConfigurationNetwork:We have design and implement network of several routers. The protocol configured on thisnetwork is OSPF. Network is divided into three areas. The reason of dividing network into 3areas is that router within an area maintain a database for the area to which it belongs. The routerdoesn't have detailed information about network topology outside of its area that is why the sizeof its database is not large. On this network router B elected as DR and router C is BDR. On thisnetwork we have also setup one switch. Router A, router B and routers C are directly connectedto the switch. Router D is directly connected to router B and router C. Router E is connected torouter B and router F is connected to router A. Router A and router E are AS in this network.For traffic flow we have setup three servers FTP, media server and Proxy server on one router Bvia switch and on the other router we have setup MRTG on one computer which is connected tothe router C. Then we started traffic on the network.Six routers and one switch have been setup and configured in MINT lab. Following fig C isshowing networks created in MINT lab. IP address is assigned to each router port as shown infig C.RouterA 2821RID:10.230.254.0OSPF 1-RIP-v2Redistribute OSPFRedistribute RIPRouterF 3750RIP-V2g0/1:10.20.16.2Area 2RouterE 3600RID:10.230.253.0OSPF 5RedistributeG0/1:10.20.16.3g0/0:10.5.16.2MRTGArea .3RouterB 2621-topRID:10.230.251.0OSPF 2FTPServerS0/0:10.1.31.2OSPF 310.1.31.0/10.124S0/0:10.1.31.3RouterD 2620 midRID:10.230.250.0S0/1: 10.1.29.3OSPF 4Area 1Proxy ServerRouterC 2620-lowRID:10.230.252.0/24.29.0S0/0:10.1.29.2
After configuration of routers we have setup also Server to start traffic. We have setup Media Server, FTPServer, Proxy Server under Windows 2003 Server platform. All three servers are connected to switch andon the same network of router B 10.5.16.0. This will help us to send type of type of traffic on the networkto check traffic load. MRTG monitoring computer also setup at different network so that we can monitortraffic load on the network.IP addressComplete IP address allocation is given in the table.RouterD 2620-midTypeinterface 5.0255.255.255.0255.255.255.0interface Serial0/110.1.29.3255.255.255.0NetworksIPRouterB 2621-topTypeInterface 55.255.0Interface Serial0/010.1.31.2255.255.255.0Interface uterF 3750TypeNetworkinterfaceGigabitEthernet1/0/1no switch .255.0
RouterE ace Ethernet0/010.10.16.3255.255.255.0RouterA 20.16.2255.255.255.0RouterC 2620-lowTypeinterface 255.255.0255.255.255.0255.255.255.0Interface Serial0/010.1.29.2255.255.255.0NetworksIPIn the second step on all routers OSPF protocol is configured as follows.Router BRouter ospf 2Log-adjacency-changesarea 1 stub
area 1 range 10.1.16.0 255.255.240.0network 10.1.31.0 0.0.0.255 area 1network 10.5.16.0 0.0.0.255 area 0network 10.10.16.0 0.0.0.255 area 2Router Crouter ospf 3log-adjacency-changesarea 1 stub no-summaryarea 1 range 10.1.16.0 255.255.240.0network 10.1.29.0 0.0.0.255 area 1network 10.5.16.0 0.0.0.255 area 0Router Drouter ospf 4log-adjacency-changesarea 1 stub no-summaryarea 1 range 10.1.16.0 255.255.240.0network 10.1.16.0 0.0.3.255 area 1network 10.1.20.0 0.0.3.255 area 1network 10.1.24.0 0.0.3.255 area 1network 10.1.29.0 0.0.0.255 area 1network 10.1.31.0 0.0.0.255 area 1network 10.1.32.0 0.0.0.255 area 1network 10.3.31.0 0.0.0.255 area 1
Router Arouter ospf 1log-adjacency-changesredistribute connected subnetsredistribute ripnetwork 10.3.31.0 0.0.0.255 area 0network 10.5.16.0 0.0.0.255 area 0SNMPThe third step we performed is enabling SNMP access on all routers. This is done by configuringcommunity strings, which act somewhat like passwords. Here's what this look like whenconfigured:snmp-server community public ROsnmp-server enable traps ttyThe default router community is public which is mentioned in the above command.MulticastingIn the fourth step IP multicasting was configured on router B, router C, router D and router A.For multicasting following commands is used.ip multicast-routingip pim sparse-dense-modeip pim rp-address IP addressIn order to enable the switch to forward multicast packets it is necessary to set up the followingcommand which is not shown in the running configuration:ip igmp snoopinga. To configure routers we setup RP for the PIM messages. Sparse Dense mode isrequired in the router interfaces, it also depends on the topology of the networkonly dense or sparse mode can be implemented. Independently from the use of RPor the spare and/or dense mode two points are important to enable the multicast
forwarding on the routers. The first one is to enable the IP Multicast routing, andthe second is to enable PIM on the interfaces. All the switches connected in thenetwork need to enable the IGMP forwarding, to let the hosts establish amembership with the routers and so they can receive the multicast packets. It iscrucial to mention that CGMP is enabled by default on the switches and it is usedto perform tasks similar to those performed by IGMP, but when IGMP spoofing isenabled the CGMP is disabled.b. The IGMP (Internet Group Management Protocol) is used for the router todiscover members of the multicast group connected to it and also to join and leavemembers of the group and for the hosts to establish their membership with themulticast group. PIM (Protocol Independent Multicast) is used between therouters so they can track which multicast packets to forward to each other and totheir directly connected LANS. Other protocol used in the multicast process thatwasn’t seen in this lab, is the DVMRP (Distance Vector Multicast RoutingProtocol) and it is used on the multicast backbone of the Internet (MBONE).c. To enable a routing protocol between the routers for the multicast packets to reachtheir destination, therefore neither PIM nor IGMP provides a routing mechanismand there is a need to use a routing protocol like OSPF along with the multicastprotocols suite.To show connectivity between routers, how OSPF protocol are configured and how OSPF keepinformation of routes in a table we have executed some show command on the routers and outputis showed below;PriorityIn the fifth step we have set router priority so that one of the router become DR and othercan be BDR;-Router B is elected as DR - with highest priority.Router C is BDR - second highest priority.OutputrouterA#sh ip ospf neighborNeighbor ID10.230.251.0Pri State3 FULL/DRDead Time Address00:00:39 10.5.16.3InterfaceGigabitEthern0
10.230.252.01 FULL/BDR00:00:39 10.5.16.4GigabitEthern0routerA#Following ping results prove communication between routers.Ping resultrouterB#routerB#ping 10.1.29.2Type escape sequence to abort.Sending 5, 100-byte ICMP Echos to 10.1.29.2, timeout is 2 seconds:!!!!!Success rate is 100 percent (5/5), round-trip min/avg/max 364/364/368 msrouterB#ping 10.230.253.0Type escape sequence to abort.Sending 5, 100-byte ICMP Echos to 10.230.253.0, timeout is 2 seconds:!!!!!Success rate is 100 percent (5/5), round-trip min/avg/max 1/2/4 msrouterD#ping 10.20.16.2Type escape sequence to abort.Sending 5, 100-byte ICMP Echos to 10.20.16.2, timeout is 2 seconds:!!!!!Success rate is 100 percent (5/5), round-trip min/avg/max 184/184/184 msrouterD#routerC#ping 10.1.29.3Type escape sequence to abort.
Sending 5, 100-byte ICMP Echos to 10.1.29.3, timeout is 2 seconds:!!!!!Success rate is 100 percent (5/5), round-trip min/avg/max 180/183/184 msrouterC#sh ip route command showed that routerc can see other routers on the network:routerC#sh ip routeO E210.20.16.0/24 [110/20] via 10.5.16.2, 02:01:13, FastEthernet0/0O E2 172.20.0.0/16 [110/20] via 10.5.16.3, 20:26:43, FastEthernet0/010.0.0.0/8 is variably subnetted, 12 subnets, 4 masksC10.230.252.0/32 is directly connected, Loopback0O IA10.10.16.0/24 [110/20] via 10.5.16.3, 20:26:43, FastEthernet0/0O E210.230.254.0/32 [110/20] via 10.5.16.2, 02:01:13, FastEthernet0/0O E210.230.253.0/32 [110/20] via 10.5.16.3, 20:26:43, FastEthernet0/0O10.1.16.0/22 [110/65] via 10.1.29.3, 1d00h, Serial0/0O10.1.16.0/20 is a summary, 1d00h, Null0C10.5.16.0/24 is directly connected, FastEthernet0/0O10.1.31.0/24 [110/128] via 10.1.29.3, 1d00h, Serial0/0O10.1.24.0/22 [110/65] via 10.1.29.3, 1d00h, Serial0/0C10.1.29.0/24 is directly connected, Serial0/0O10.1.20.0/22 [110/65] via 10.1.29.3, 1d00h, Serial0/0O E2 172.16.0.0/12 [110/20] via 10.5.16.2, 02:02:03, FastEthernet0/0routerC#In this network we have setup two area border routers and overall 3 areas. Outputs are givenbelow.
List all area border routers and their router LSA IDs.Area Boarder Router1. Router BLSA: 10.230.251.02. Router CLSA: 10.230.252.03. List all the AS border routers and AS external LSA originated by them.Router A: AS Boundary RouterLink State ID: 10.230.254.0Advertising Router: 10.230.254.0&Router E: AS Boundary RouterLink State ID: 10.230.253.0Advertising Router: 10.230.253.0After configuration of routers we have setup also Server to start traffic. We have setup Media Server, FTPServer, Proxy Server under Windows 2003 Server platform. This will help us to send type of type oftraffic on the network to check traffic load. MRTG monitoring computer also setup at different networkso that we can monitor traffic load on the network.Routers configuration files are saved in appendix B
Chapter No. 3 MRTG / RRDTOOL Configuration and ImplementationMRTGMRTG is a monitoring tool which can also gives graphical view of the traffic load on networkconnection. The MRTG produce HTML pages containing graphical images that provide a visualrepresentation of the network traffic after every 5 minutes. The graphs produce by MRTG aredaily, weekly, monthly and yearly scales we can see the bandwidth use on the network in thesegraphs. MRTG is good tool for analyzing network problems because it not only indicates thecurrent status of the network but also compare this with the previous network traffic load.MRTG is based on Perl and C, and runs on Windows and UNIX operating systems.To get the information from the router or any device on the network for which we’re going tomonitor the traffic. We have to configure SNMP because MRTG need SNMP enabled on everyinterface we want to monitor. MRTG is depending on SNMP, to obtain data from routers orother network hardware. Using the variables, MRTG sends SNMP requests every five minutesand stores the responses in a specific format in the log file. This format allows MRTG to presentthe daily, weekly, monthly, and yearly graphs without the data files forever growing larger. Itdoes this by summarizing the older data as necessary. The graphs file format is Portable NetworkGraphics (PNG).In MRTG we can graph the bandwidth in and out of any SNMP enabled network deviceincluding routers. With MRTG we can graph following: Bandwidth in and out in bits or bytes per secondBandwidth in an out of a particular VIP/virtual server or node/real serverConnection rate (in connections per second)Any parameter that has an SNMP counter or gauge object/OIDTotal number of concurrent sessionsMRTG Installation step by stepMRTG is available at http://www.mrtg.org/ for download. First step we have to perform is todownload windows version of MRTG and then unzip MRTG folder to C:\mrtg-2.15.2 on theWindows machine.To get MRTG to work on Windows we need to install PERL. PERL can be downloading fromthe following ownload.plex?id ActivePerlPerl was installed on the same Windows machine. We have to make sure that Perl binarydirectory is listed in the system path.
C:\Perl\bin;%SystemRoot%\system32;%SystemRoot%;If it is not present in the system path then we have to enter it manually in[Control Panel]- [System] - [Environment]To see if everything is installed properly we can open a Command Shell and go into c:\mrt\bin.Type: perl mrtgThis should give error message saying about the missing MRTG configuration file but that is ok.CONFIGURING MRTGEnabling SNMPThe majority of operating systems do not have the SNMP support enabled by default. The SNMPhas to be installed or enabled in order to get the SNMP OID data collection working. The SNMPsupport offers the SNMP client, which listens for SNMP requests coming from a NMS (networkmanagement station) and delivers the requested SNMP values.Before creating a configuration file for MRTG we should have the following information: The IP address or hostname and the SNMP port number of the device which is going tobe monitored.To monitor something other than bytes in and out, we must also know the SNMPOID ofwhat we want to monitor.The read-only SNMP community string for the device. In our case it is public that is bydefault.We have configured SNMP on all routers available in rack 4 of MINT lab. IOS used in ournetwork with Community string public.Cisco routers/switches offer SNMP support running on a "public" community.IOS commands that change the SNMP configuration:(config)#snmp-server community name access-type (config)#snmp-server enable traps [notification-type]
Creating .cfg fileAfter MRTG installation on a specific monitoring Server and SNMP Protocols setup on routers.Next step should be to configure MRTG so that MRTG should start communication with themonitoring device. For that we have to create and configure MRTG.cfg file in which we have totell MRTG to capture data from that specific port. MRTG.cfg file is required for each monitoredhost. First thing we have to do is to create a default mrtg.cfg file. The .cfg file defines the SNMPOIDs for each entity that we want to monitor from the destination host. MRTG parses theassociated .cfg file and collects the SNMP values for all OIDs defined in the .cfg file.To create mrtg.cfg file we can run the “CFGMAKER” script or we can also create mrtg.cfg filemanually it is on us which method we prefer. If choose to create mrtg.cfg through cfgmaker eventhen we have to edit that file and add script for the TCP or UDP traffic, we will find mrtg.cfg filein the c:\mrtg\bin\ directory. This script scans a host for the network-interfaces and constructs themrtg.cfg file example is shown below.On cmd prompt change to the c:\mrtg-bin directory. Type the following command:Perl cfgmaker public@ interface IP address --global "WorkDir: c:\mrtgdata" --output mrtg.cfgThis creates an initial MRTG config file called mrtg.cfg every time we run above command itwill create new mrtg.cfg file in c:\mrtg\bin directory which overwrites any exiting mrtg.cfg file ifpresent in c:\mrtg\bin directory. In MRTG.CFG file all interfaces of the router will be stored bynumber. These numbers are likely to change whenever we reconfigure router. In order to workaround this we can get cfgmaker to produce a configuration which is based on IP numbers, oreven Interface Descriptions.Following is the very basic sample configuration mrtg.cfg file which is only good for data in andout.TargetDevice's IP Address: Interface Number: Community: IP AddressTarget[IP address]: 1:public@ IP addressThis is the interface speed (Default is 100 megabits; for 100Mbit devices use 12500000 and soon.)MaxBytes[IP address]: 1250000Title[IP address]: Monitor Traffic load on Router: ether0
This section determines how the web page headers will lookPageTop[IP address]: H1 Traffic Analysis for Fastethernet 0/0 /H1 TABLE TR TD Router: /TD TD Monitor Traffic load on Router /TD /TR TR TD Maintainer: /TD TD Administrator /TD /TR TR TD Interface: /TD TD ether0(1) /TD /TR TR TD IP: /TD TD FastEthernet 0/0(IP address) /TD /TR TR TD Max Speed: /TD TD 12.5 MB/s (ethernetCsmacd) /TD /TR /TABLE This section determine the traffic if there is any and its description.Target[IP address.2]: 2:public@ IP address.1MaxBytes[IP address.2]: 125000000Title[IP address.2]: Monitor Traffic load on Router : FastEthernet0/0PageTop[IP address.2]: H1 Traffic Analysis for FastEthernet /H1 TABLE TR TD System: /TD TD Monitor Traffic load on Router /TD /TR TR TD Maintainer: /TD TD Admin /TD /TR TR TD Interface: /TD TD FastEthernet0/0 /TD /TR TR TD IP: /TD TD () /TD /TR TR TD Max Speed: /TD TD 12.5 MB/s (ethernetCsmacd) /TD /TR /TABLE To start MRTG and generate graphs to monitor network traffic we have to run followingcommand on command prompt by going in the directory c:\mrtg-2.15.2\bin:perl mrtg mrtg.cfgIt is normal to get errors for the first two times we run above command. The errors will alertabout the fact that there have not been any log files in existence before.To update the MRTG graphs we have to run perl mrtg mrtg.cfg every five minutes this how mrtgwill give first lines in our graphs.
Configure MRTG to run all the timeIf we want to see the update on MRTG graphs we have to run MRTG manually which is not aprofessional way. To run the MRTG all the time there is option available in the MRTG. We canset in the MRTG configuration file so that MRTG will not terminate after it was started. Insteadit will wait for 5 minutes and then run again automatically. We need to add following option inmrtg.cfgRunAsDaemon: yesand at cmd prompt we have to type following command and execute it:start /Dc:\mrtg-2.15.2\bin perl mrtg --logging eventlog mrtg.cfgto run mrtg after 5 minutes automatically.If we use wperl instead of perl, no console window will show. MRTG should be running in thebackground. If it runs into problems it will log the errors in EventLog. To stop MRTG, open theTask Manager and terminate the wperl.exe process. To mrtg messages and error we can refer toevent log.It is also possible if we addTarget:perl mrtg --logging eventlog mrtg.cfgStart in: c:\mrtg-2.15.2\bininto windows start-up folder, MRTG will now start whenever you login into windows.Basic MRTG configuration fileFollowing is the basic MRTG configuration file to monitor bytes in and out. This mrtg.cfg iscreated in the MINT lab on Cisco router 2600.# Created by : Parvez Ibrahim# cfgmaker public@10.1.32.3 --global "WorkDir: c:\mrtgdata" --output mrtg.cfg### Global Config Options# for UNIX# WorkDir: /home/http/mrtg# or for NT# WorkDir: c:\mrtgdata### Global Defaults# to get bits instead of bytes and graphs growing to the right
# Options[ ]: growright, ######################### System: routerD# Description: Cisco Internetwork Operating System Software#IOS (tm) C2600 Software (C2600-J1S3-M), Version 12.2(15)T7, RELEASE SOFTWARE (fc2)#TAC Support: http://www.cisco.com/tac#Copyright (c) 1986-2003 by cisco Systems, Inc.#Compiled Sat 09-Aug-03 07:18 by ccai# Contact: Parvez Ibrahim# Location: MINT Lab#############
Multi-Router Traffic Grapher Multi-Router Traffic Grapher is a tool that collects, stores, and graphs data on a given interval. SNMP which reads the traffic counters from network device like router and then it is C program logs the traffic data and creates graphs representing the traffic in and out on the network. MRTG consists of a Perl script.