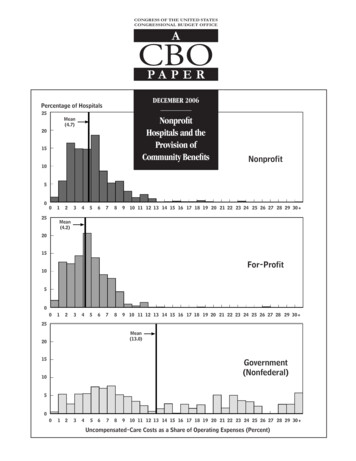
Transcription
Congressional Budget OfficeJuly 21, 2017Correcting for Underreporting ofGovernment Transfers: A Regression-BasedApproach With Preliminary ResultsPresentation at a Workshop Organized by theWashington Center for Equitable GrowthBilal HabibTax Analysis DivisionAs developmental work for analysis for the Congress, the information in this presentation ispreliminary and is being circulated to stimulate discussion and critical comment.
BackgroundCONGRESSIONAL BUDGET OFFICE
CBO regularly produces a report on thedistribution of household income andfederal taxes.This year, the agency is working to changeits analytical framework to treat meanstested transfers as equivalent to taxes.CONGRESSIONAL BUDGET OFFICE
Old Analytical FrameworkMarket IncomeGovernmentTransfers(Includes social insurancebenefits and means-testedtransfers)Before-Tax IncomeFederal TaxesAfter-Tax IncomeCONGRESSIONAL BUDGET OFFICE
New Analytical FrameworkMarket IncomeSocial InsuranceBenefitsMarket IncomePlusSocial Insurance BenefitsMeans-TestedTransfersFederal TaxesIncome AfterTaxes and Transfers(Equal to After-Tax Income)CONGRESSIONAL BUDGET OFFICE
Explicit analysis of government transfersrequires a complete accounting of transferincome.CBO’s tax model uses the Annual Socialand Economic Supplement of the CurrentPopulation Survey (CPS) for transferincome data.CONGRESSIONAL BUDGET OFFICE
Underreporting of transfer income in theCPS has increased over time, as is welldocumented in Wheaton (2008), Meyer,Mok, & Sullivan (2009), and Moffitt &Scholz (2009).As a result, CPS-based analyses are likely tounderstate income growth at the bottomof the distribution and the role of transfersin reducing income inequality.CONGRESSIONAL BUDGET OFFICE
Reporting Rates in the CPS:Means-Tested Transfers, 1979–2013CPS Recipients as a Percentage of Administrative Recipients1008060MedicaidSSISNAP736653402001979 1981 1983 1985 1987 1989 1991 1993 1995 1997 1999 2001 2003 2005 2007 2009 2011 2013CONGRESSIONAL BUDGET OFFICE
CBO’s goal is to obtain a more complete(although partially imputed) accounting ofincome from government transfers in theCPS with enough precision for quintilelevel distributional analysis.CONGRESSIONAL BUDGET OFFICE
The analysis is focused on three of thelargest means-tested transfers—Medicaid,the Supplemental Nutrition AssistanceProgram (SNAP), and SupplementalSecurity Income (SSI)—and the two largestsocial insurance benefits—Social Securityand Medicare.CONGRESSIONAL BUDGET OFFICE
Means-Tested TransfersCONGRESSIONAL BUDGET OFFICE
Researchers typically use three ways tocorrect for underreporting: Administrative matching, Rules-based simulation, and Regression-based estimation.CONGRESSIONAL BUDGET OFFICE
Administrative matching offers near-perfectaccounting, but administrative microdata arenot widely available. Examples: Davern et al.(2009); Meyer and Sullivan (2008).Rules-based simulation offers precise estimatesat the micro level, but requires a significantresearch investment. Example: Zedlewski andGiannarelli (2015).Regression-based estimation is tractable formultiple programs/years but is less precise atthe micro level. Example: Moffitt and Scholz(2009).CONGRESSIONAL BUDGET OFFICE
CBO’s preliminary regression-basedestimation has three steps:1. Use reported data to estimate theprobability of receipt for all units.2. Impute transfer receipt based onestimated probabilities.3. Assign transfer income to recipients.CONGRESSIONAL BUDGET OFFICE
Step 1. Predicted probabilities areestimated using a probit model with CPSreported receipt as the dependentvariable.Independent variables are based onprogram rules and other characteristicsassociated with program participation.CONGRESSIONAL BUDGET OFFICE
Individual characteristics include age,race, education, labor force status,disability, marital status, and receipt ofother means-tested transfers.Household/family characteristics includeincome (as a percentage of the federalpoverty level), income composition,household size and structure, andgeography.CONGRESSIONAL BUDGET OFFICE
Step 2. Transfer receipt is imputed tononreporters with the highest probabilityof receipt until the administrative total isreached. This process is repeated to matchthe targets for each category (e.g., children,elderly).CONGRESSIONAL BUDGET OFFICE
Medicaid Recipiency Rates, by Income, 2010Percentage of Adults Receiving Benefits50The Urban Institute’sTransfer IncomeModel4030CBO (Imputed PlusReported)20CPS (Reported Only)1000255075100 125 150 175 200 225 250 275Annual Family Income as a Percentage of the Federal Poverty LevelCONGRESSIONAL BUDGET OFFICE300
SSI Recipiency Rates, by Income, 2010Percentage of Individuals Receiving Benefits25The UrbanInstitute’sTransferIncome Model2015CBO (ImputedPlus Reported)10CPS(ReportedOnly)500255075100 125 150 175 200 225 250 275Annual Family Income as a Percentage of the Federal Poverty LevelCONGRESSIONAL BUDGET OFFICE300
Distribution of SNAP Recipients, by Annual Household Incomeas a Percentage of the Federal Poverty Level, 1979–2013Percentage of Recipients100100%9090%8080%7070%CPS (Reported Only)CBO (Imputed Plus Reported)200% or 30%3020%2010%1049% or Less0%01979 1984 1989 1994 1999 2004 20091979 1984 1989 1994 1999 2004 2009CONGRESSIONAL BUDGET OFFICE
Distribution of SNAP Recipients, by Annual Household Incomeas a Percentage of the Federal Poverty Level, 2005–2013Percentage of Recipients100100%9090%The Urban Institute’s Transfer IncomeModel200% or MoreCBO (Imputed Plus 040%4050%–99%30%3020%2049% or Less10%100%02005200820112005CONGRESSIONAL BUDGET OFFICE20082011
Step 3. Transfer income is assigned torecipients. The assignment methodologyvaries by program.CONGRESSIONAL BUDGET OFFICE
For SNAP and SSI, CBO derives the averagebenefit per household from reportedvalues (by household size and income-topoverty ratio).Those averages are then assigned to newlyimputed recipients and are adjusted asneeded to match administrative totals.CONGRESSIONAL BUDGET OFFICE
Average Annual SNAP Benefits per Household, 1979–2013Constant 2013 Dollars3,5003,000AdministrativeDataNewly s1,00050001979 1981 1983 1985 1987 1989 1991 1993 1995 1997 1999 2001 2003 2005 2007 2009 2011 2013CONGRESSIONAL BUDGET OFFICE
For Medicaid, CBO derives the averagecost to the government per participantfrom administrative data (by eligibilitycategory).Those averages are then assigned to allrecipients (CPS “reported” values areoverwritten).CONGRESSIONAL BUDGET OFFICE
Average Annual Cost per Medicaid Recipient, 1979–2013Constant 2013 Dollars6,0005,0004,000CBO Averages (FromAdministrative Data)3,000CPS Averages2,0001,00001979 1981 1983 1985 1987 1989 1991 1993 1995 1997 1999 2001 2003 2005 2007 2009 2011 2013CONGRESSIONAL BUDGET OFFICE
CBO’s regression-based approach has bothstrengths and limitations.CONGRESSIONAL BUDGET OFFICE
The approach is straightforward toimplement and easily scalable acrossmultiple programs. Distributional resultsare similar to rules-based methods.CONGRESSIONAL BUDGET OFFICE
It does not, however, account for falsepositives in the CPS, and assumes thatnonreporters have the same characteristicsas reporters. It has a limited ability tosimulate different policy scenarios.CONGRESSIONAL BUDGET OFFICE
Social Insurance BenefitsCONGRESSIONAL BUDGET OFFICE
CBO uses a different approach forimputing social insurance benefits.CBO does not perform any explicitdistributional analysis of social insurancebenefits, since they are included in thebase income measure.CONGRESSIONAL BUDGET OFFICE
Receipt of social insurance benefits isdifficult to model with a regression. It isdependent on life-cycle income/labor forceparticipation, it is not means tested, andthere are no income data for children inthe CPS (which is important for imputingSocial Security survivors’ benefits).CONGRESSIONAL BUDGET OFFICE
Social Security Reporting Rates in the CPS, 2001–2013CPS Recipients as a Percentage of Administrative Recipients100Old Age978580Disability60Survivors40472002001 2002 2003 2004 2005 2006 2007 2008 2009 2010 2011 2012 2013CONGRESSIONAL BUDGET OFFICE
To impute Social Security benefits, CBOcreates a pool of eligible recipients foreach type of benefit and randomly assignsreceipt until the administrative counts arematched.The average benefit for each benefit typeis then assigned to new recipients andaligned to administrative totals as needed.CONGRESSIONAL BUDGET OFFICE
Medicare Reporting Rates in the CPS, 1979–2013CPS Recipients as a Percentage of Administrative Recipients100938060402001979 1981 1983 1985 1987 1989 1991 1993 1995 1997 1999 2001 2003 2005 2007 2009 2011 2013CONGRESSIONAL BUDGET OFFICE
To impute Medicare benefits, CBO makesno change to reported recipients.CBO assigns the average cost to thegovernment per participant to allrecipients. Benefits from the Low IncomeSubsidy for Prescription Drug Coverage areallocated separately.CONGRESSIONAL BUDGET OFFICE
Preliminary ConclusionsCONGRESSIONAL BUDGET OFFICE
Income Inequality, 1979–2013Gini Index0.50Market Income PlusReported SocialInsurance Benefits0.45Market Income PlusImputed SocialInsurance Benefits0.400.350.35Market Income PlusImputed Social InsuranceBenefits Plus ImputedMeans-Tested TransfersMarket Income PlusImputed SocialInsurance BenefitsPlus Reported MeansTested Transfers0.0001979 1981 1983 1985 1987 1989 1991 1993 1995 1997 1999 2001 2003 2005 2007 2009 2011 2013CONGRESSIONAL BUDGET OFFICE
Change in Gini Index, 1979–2013Percentage Change Relative to Market Income Plus Imputed Social Insurance Benefits1979 1981 1983 1985 1987 1989 1991 1993 1995 1997 1999 2001 2003 2005 2007 2009 2011 20130%0-1%-1-2%-2Reported Means-Tested Transfers-3%-3-4%-4-5%-5-6%-6Imputed Means-Tested Transfers-7%-7-8%-8CONGRESSIONAL BUDGET OFFICE
Means-Tested Transfer Rates, by Quintile, 1979–2013Ratio of Means-Tested Transfers to Base Income MeasureQuintile 10.60.5Quintile 2Quintile 3Quintile 5All QuintilesCBO (ImputedPlus Reported)0.40.30.20.1CPS (Reported Only)0Quintile 40.60.50.40.30.20.101979 1984 1989 1994 1999 2004 20091979 1984 1989 1994 1999 2004 2009CONGRESSIONAL BUDGET OFFICE1979 1984 1989 1994 1999 2004 2009
Means-Tested Transfer Rates, Bottom Quintile, 1979–2013Ratio of Means-Tested Transfers to Base Income Measure0.60.5CBO (Imputed Plus Reported)0.40.30.2CPS (Reported Only)0.101979 1981 1983 1985 1987 1989 1991 1993 1995 1997 1999 2001 2003 2005 2007 2009 2011 2013CONGRESSIONAL BUDGET OFFICE
Notes to Figures Slides 7 and 32: The reporting rate equals the weighted sum ofrecipients in the CPS (including CPS imputations) divided by thenumber of recipients in the administrative data, adjusted forrecipients outside the CPS sampling frame. Where administrativetotals are available on a monthly basis, they have been converted toreflect the total number of program participants across the calendaryear. Slide 17: Adults are defined as individuals aged 18–64 who are notdisabled. Slides 17, 18, 19, and 20: Individuals or households are consideredrecipients if they participate in the program at any point during thecalendar year.CONGRESSIONAL BUDGET OFFICE
Notes to Figures (Continued) Slides 17 and 18: The Urban Institute’s Transfer Income Model(TRIM) is a microsimulation model that uses the CPS as a basis tosimulate program rules for various transfer programs. It uses thoserules to determine program eligibility, participation, and benefits.The current version, TRIM3, has publicly available imputations formost major welfare programs going back to 1993. For more details,see Zedlewski and Gianarelli (2015). Slide 33: The reporting rate equals the weighted sum of recipients inthe CPS (including CPS imputations) divided by the number ofrecipients in the administrative data. Slide 35: Reported and imputed social insurance benefits includeSocial Security and Medicare. Reported and imputed means-testedtransfers include Medicaid, SNAP, and SSI.CONGRESSIONAL BUDGET OFFICE
Notes to Figures (Continued) Slide 38: Social insurance benefits include Social Security andMedicare. Means-tested transfers include Medicaid, SNAP, and SSI. Slides 39 and 40: The base income for the CBO (Imputed PlusReported) quintiles and means-tested transfer rates is marketincome plus imputed social insurance benefits. The base income forthe CPS (Reported Only) quintiles and means-tested transfer rates ismarket income plus reported social insurance benefits. Meanstested transfers include Medicaid, SNAP, and SSI.CONGRESSIONAL BUDGET OFFICE
References Bruce D. Meyer, Wallace K. C. Mok, and James X. Sullivan, TheUnder-Reporting of Transfers in Household Surveys: Its Nature andConsequences, Working Paper 15181 (National Bureau of EconomicResearch, July 2009), www.nber.org/papers/w15181. Bruce D. Meyer and James X. Sullivan, Using Two-Sample Methodsto Correct for Reporting Bias in Surveys, Working Paper 0902(University of Chicago, December 2008),https://tinyurl.com/y8jjnqma (PDF; 176 KB). Robert A. Moffitt and John Karl Scholz, Trends in the Level andDistribution of Income Support, Working Paper 15488 (NationalBureau of Economic Research, November 2009),www.nber.org/papers/w15488.CONGRESSIONAL BUDGET OFFICE
References (Continued) Laura Wheaton, Underreporting of Means-Tested Transfer Programsin the CPS and SIPP, (Urban Institute, February 6, 2008),https://tinyurl.com/yd4caq7n. Sheila Zedlewski and Linda Gianarelli, TRIM: A Tool for Social PolicyAnalysis, (Urban Institute, May 2015), https://tinyurl.com/y7sbos8l.CONGRESSIONAL BUDGET OFFICE
Washington Center for Equitable Growth. July 21, 2017. Bilal Habib. Tax Analysis Division. Correcting for Underreporting of Government Transfers: A Regression -Based Approach With Preliminary Results As developmental work for analysis for the Congress, the information in this presentation is