Transcription
GUIDELINES AND STRATEGIESFOROIL SPILL WASTE MANAGEMENTINARCTIC REGIONSFINAL REPORTPrepared for:Joint SecretariatInuvialuit Renewable Resources CommitteesPO Box 2120InuvikNT, X0E 0T0, CanadaPrepared by:Polaris Applied Sciences, Inc.755 Winslow Way, Suite 302Bainbridge IslandWA 98110-2483, USAAPRIL 2009
EXECUTIVE SUMMARYThe report describes key components of the decision process for oil spill wastemanagement in the Arctic and describes a computer Job Aid that has beendeveloped to assist managers and decision makers understand and comparebasic response options.The focus of the study is on those considerations that are integral to the selectionof practical and feasible strategies and tactics for arctic regions and, in particular,for remote areas. The first sections of this report (Sections 3 though 5) present asummary of key information that is necessary for the oil spill waste managementstrategy decision process. This information includes: waste generation, wastetypes, and waste volumes. Elements of waste handling are summarized inSections 6 though 8 and recommendations for the contents of an oil spillresponse waste management plan are discussed in Section 9. An interactive,graphic-oriented, computer Waste Management Calculator Job Aid has beendeveloped for use by non-technical (or technical) managers and decisionmakers. This Job Aid provides comparative waste volumes that potentially wouldbe generated by different cleanup techniques and using different treatmentendpoint standards.The amount of waste generated by oil spill response activities is not controlled bythe size of the spill, nor the location, but rather is a direct function of the responseobjectives and the response methods selected by the spill management team. Itis important therefore to provide the decision makers with relevant informationregarding potential waste generation, waste types, and waste volumes uponwhich they can set the response objectives. One step in the decision process isan evaluation of operational practicality and feasibility, which includes thedevelopment of estimates of the types and volume of waste that would begenerated by the proposed activities and the development of a strategy for wastesegregation, handling, transfer, storage, and disposal.Very little data exist on volumes of waste generated by shoreline treatment orcleanup except as gross or cumulative totals. Data sets reviewed in this studyprovide two maximum volumes for specific individual shoreline segments ofmixed sand, pebble, cobble sediments: Mechanical removal:o based on linear oiled shoreline data - 4.0m3/mo based on oiled area data - 1.3 m3/m2 Manual removal:o based on linear oiled shoreline data - 2.5 m3/mo based on oiled area data - 1.4 m3/m2.Waste Management in Remote Areasi
In both of these cases, treatment end points required removal of almost all of theoiled sediments. Clearly, as these end point standards are relaxed the volumesgenerated would be reduced.In one instance where the primary shoreline treatment tactics were manualscraping and wiping or washing, with very little removal of material,approximately 1 m3 of waste was generated for every 24 m of oiled shoreline thatwas cleaned. This waste, the equivalent of 42 m3/km, was primarily oiled PPEand sorbents. As in the other examples, this was an operation that involvedremoval of almost all of the oil from sediments and hard substrates.For at-sea oil spill response operations in arctic regions the preferred responsestrategies are dispersants and burning, as these generate virtually no waste,whereas mechanical strategies result in the collection of oily wastes products thatthen require handling, transfer, storage, and disposal. Burning is the preferredtreatment option for oil on solid sea ice and may be the only practical option forbroken ice conditions.If shoreline treatment or cleanup is required the preferred options are those insitu techniques that do not generate oil or oily wastes, only operational orlogistics waste materials: Natural Recovery; Mixing; Sediment Relocation;Burning; Dispersants; and Bioremediation. These treatment options areparticularly attractive for remote area operations where waste may have to betransported long distances for recycling or disposal.Each response option generates different waste types that can include oiled andunoiled materials, both liquids and solids, and ice or snow. The wastemanagement planning process involves estimates of the different types ofmaterials that can be generated as these have to be stored, packaged,transported and disposed differently. The critical input parameters for wastegeneration from shoreline treatment are: substrate type; oil type; oil volume; andtreatment end points. These parameters form the core of the Waste ManagementCalculator Job Aid that can be used to compare relative amounts of waste thatwould be generated by different response options.An appendix to the report presents a summary of data and information on wastegeneration from shoreline treatment operations that have been collated frompublished and unpublished sources. Two additional appendices summarizewaste management legislation for Arctic Canada and for Norway (includingSvalbard).Waste Management in Remote Areasii
TABLE OF CONTENTSEXECUTIVE SUMMARY . iTABLE OF CONTENTS .iii1.0Introduction and Objectives .12.0Oil Spill Management and the Decision Process.73.0Waste Generation .93.1 Waste Generation in Marine and Broken Ice Response Operations . 103.2 Waste Generation in Solid Sea Ice Response Operations . 143.3 Waste Generation in Shoreline Response Operations . 154.0Waste Types.185.0Waste Volumes .196.0Waste Handling .227.0Secondary Processing and Packaging .238.0Transfer and Transport .249.0Recommended Contents of a Waste Management Plan.2710.0 Waste Management Calculator Job Aid.2810.1 Input Parameters . 2910.2 Assumptions and Calculations . 3310.3 Output. 3510.4 Operation of the Job Aid. 4011.0 Summary and Conclusions.4212.0 References Cited and Bibliography.45Appendix AWaste Generation from Shoreline Treatment Operations .49Appendix B Definitions and Descriptions.59Appendix B.1 Substrate Types . 59B.1.1 Sand and mixed sediment beaches . 59B.1.2 Coarse sediment beach . 59B.1.3 Cobble/Boulder beach. 60B.1.4 Bedrock or solid (includes ice) . 61B.1.5 Wetland Vegetation. 61B.1.6 Oiled debris. 62B.1.7 Snow . 63Appendix B.2 Oil Types. 64Appendix B.3 Degree of Oiling (Surface Oil Category). 65Appendix B.4 Treatment End Points . 66Appendix B.5 Treatment Tactics . 67B.5.1 Natural recovery. 67B.5.2 Washing and Recovery . 68B.5.3 Manual removal . 69Waste Management in Remote Areasiii
B.5.4 Mechanical removal . 70B.5.5 In situ sediment mixing or relocation . 72B.5.6 In situ burning . 74B.5.7 Bioremediation . 75Appendix B.6 Surface Oil Category. 77Appendix C WasteManagement Plans.78C.1 Waste Management for Contingency Planning . 78C.2 Model Disposal Plan for Oil Spills. 80C.3 Waste Plan References. 85C.4 Tools and Forms. 86C.4.1 Waste Branch Director (or Group Supervisor) . 86C.4.2 Example Waste Manifest Form . 87Appendix D Legislation Summary for Arctic Canada .88GLOSSARY .90Purpose and Summary.911.0Inuvialuit Regional Corporation / Inuvialuit Settlement Region / Joint Secretariat .911.1 Inuvialuit Final Agreement . 911.2 Regulations for the NWT portion of the Inuvialuit Settlement Region . 921.3 Laws and regulations for the Yukon portion of the Inuvialuit SettlementRegion. 922.0Government of Canada.872.1 Canadian Environmental Protection Act (1999) and regulations . 872.1.1Environmental Emergency (E2) Regulations. 872.1.2Hazardous waste regulations . 882.2 Transportation of Dangerous Goods Laws and Regulations . 882.3 Disposal at Sea Regulations . 893.0Government of the Northwest Territories .903.1 Environmental Protection Act laws, regulations and guidelines. 903.1.1Used Oil and Waste Fuel Management. 903.1.2Management of Hazardous Waste . 903.1.3Spill Contingency Regulations . 913.2 Transportation of Dangerous Goods Act laws and regulations. 914.0Government of Yukon .924.1 Environment Act laws and regulations. 924.1.1Special Waste Regulations. 924.1.2Special Waste Transportation Permit . 924.1.3Spills Regulations . 934.2 Dangerous Goods Transportation Act laws and regulations. 935.0Government of Nunavut.935.1 Environmental Protection Act laws and regulations. 945.1.1Management of Hazardous Waste . 945.1.2Spill Contingency Regulations . 945.2 Transportation of Dangerous Goods Act laws and regulations. 956.0 References.96Waste Management in Remote Areasiv
LIST OF FIGURESFigure 1-1Figure 1-2Figure 4-1Figure 8-1Figure 10-1Comparison of spill and waste volumes from marine oil spills. 1Examples of solid versus liquid waste generated . 2Waste types and segregation . 18Typical waste management and transfer model . 24Waste Management Calculator Output – Bouchard B-155 Data . 38LIST OF TABLESTable 1-1Table 3-1Table 3-2Table 3-3Table 4-1Table 5-1Table 5- 2Table 6-1Table 8-1Table 10-1Table 10-2Table 10-3Table 10-4Table A-1Examples of liquid and solid wastes generated from marine oil spillresponse operations . 2Generalized Operational Limits and Order of Magnitude VolumeControl Rates . 12Skimmer Oil/Water Pickup (per cent oil in recovered product) . 12Oily Waste Generation and Labour Requirements for ShorelineTreatment Options. 17Examples of Oiled Man-Made Waste Types . 19Waste Generation from Sediment Removal on Individual Segments . 21Waste Generation from Shoreline Treatment Operations. 21Examples of Packaging and Storage Capacity. 22Helicopter Operational Characteristics . 26Summary of Efficiency Factors for Shoreline Treatment Tactics . 32Applicability of Treatment Options . 34Estimated Waste Volumes (m3/m) Generated based on a Bulk OilRemoval Treatment Endpoint for Light Oil. 35Comparison of Operational Data and Calculated Volumes . 36Waste Generation Data from Shoreline Treatment Operations . 52Waste Management in Remote Areasv
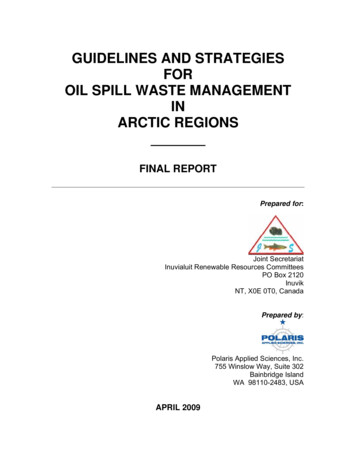
1.0 Introduction and ObjectivesWaste generation is a fact of life for any oil spill response field operation. Theamounts and types of waste that are generated and then must be managed anddisposed vary with the activities. The volume of waste generated during an oilspill response operation is a function of the nature of the spill and the decisionsmade by spill managers who select the treatment and cleanup methods.A review of past spill responses shows that there is no direct correlation betweenthe volumes of waste generated and the original amount of spilled oil (Figure 1-1,Table 1-1).The response to the T/V Erika spill generated more waste ascompared to that generated following the T/V Amoco Cadiz, although the volumespilled was an order of magnitude less.SPILLED OILTOTAL WASTEadH izavenSeBaEm raepr rKa estin sPr a-PestE x M ig exo e tn ulaValdeEr zSeikla Ara and gan ongAyu300250200150100500AmocoC,000 tonnesSpill Volume and Waste Volume(adapted and revised from IPIECA 2004)Figure 1-1Comparison of spill and waste volumes from marine oil spillsWaste Management in Remote Areas1
Table 1-1Examples of liquid and solid wastes generated from marine oil spillresponse operationsINCIDENTOIL LOST(tonnes)T/V Amoco Cadiz- 1978T/V Haven – 1991T/V Braer – 1993T/V Sea Empress – 1996T/V Katina-P – 1992T/V Prestige – 2002T/V Metula – 1974T/V Exxon Valdez – 1989T/V Erika – 1999T/V Aragon – 1989M/V Selandang Ayu – (in part from IPIECA 2004 and ITOPF1)Solid and Liquid Waste VolumesSOLID WASTELIQUID WASTEadiH zavenSea BrEm a epr reKa sstinPr a-PestiEx M gexo etn ulaValdezErSeikla Ara and gC a n onos gco AyBu usan300250200150100500AmocoC,000 tonnesSOLID WASTE(tonnes)Figure 1-21Examples of solid versus liquid waste generatedwww.itopf.comWaste Management in Remote Areas2
The 1999 T/V Erika response primarily involved operations in a denselypopulated and accessible region. This operation generated approximately250,000 tons of oily waste and an additional approximately 50,000 tons oflogistics related non-oiled material for disposal. By comparison, the 1989 T/VExxon Valdez response was in a remote sparsely inhabited region and involvedprimarily shoreline washing rather than removal of oiled sediments. Thisoperation generated approximately 45,000 tons of waste, most of which wasassociated with logistics support rather than treatment actions and all of whichwas transported 5,000 km from this remote area in Alaska by sea to Oregon. Inthe 1974 T/V Metula grounding approximately 54,000 tonnes of oil was spilledand stranded on approximately 250 km of coast in the Straits of Magellan, Chile.No cleanup was conducted in this remote location and so no waste wasgenerated.A relatively small spill of 1000 tonnes (1.8 million L) of fuel oil resulted from thegrounding of M/V Selandang Ayu in 2004 in a remote northern region ofUnalaska Island in the Aleutian Chain of Alaska. Approximately 50 km of oiledshoreline were treated and this operation generated 6,500 metric tons of waste,all of which was transported by barge over 8,000 km for disposal. The majority ofthis waste was generated by the cleanup by sediment removal of 20 km of“heavy” and “moderate” oil category2 shorelines. The entire shoreline treatmentoperation was boat based in this remote island location, with no roads to theoiled shorelines. The decision to clean these remote oiled shorelines resulted inan operation that spanned an 18-month period before the response objectivewas achieved (Owens et al., 2008). The same decision process thatcharacterized this incident is used in most oil spills to determine the level of effortthat is required for an appropriate response.2These terms are defined in the Environment Canada SCAT Manuals (Owens andSergy, 2001, 2004)Waste Management in Remote Areas3
The case history data presented in Figures 1-1 and 1-2 and Table 1-1 illustrate anumber of key points: The actual waste volume generated is not directly related to the amount ofoil lost. Even relatively small spills, such as the Selandang Ayu, cangenerate a large volume of waste if an extensive shoreline cleanupoperation is required. In this case, the volume of waste was approximatelyeight (8) times greater than the amount of oil lost.Similarly, in theresponse to the Erika spill the waste was more than ten (10) times theamount of oil lost. When extensive cleanup is required the volume ofwaste generated can exceed the volume of oil spilled, as occurred duringthe Prestige, Erika, Aragon, and Selandang Ayu response operations. Comparison of the volumes of liquid and solid waste shows that in sevenof these ten cases (that is, except for the Haven, Sea Empress, andPrestige) the solid waste component was more than 95% of the wastesthat were generated. The key factor in waste generation is neither the amount of oil spilled northe amount of shoreline that is oiled. The volume of waste generatedduring a response operation is a function of the nature of the spill (typeand volume of oil, natural weathering processes) and location and lengthof oiled shoreline, combined with the decisions made by spill managerswho select the treatment and cleanup methods and the level of effort(treatment endpoints).The first step in the oil spill response decision process is to conduct a riskanalysis to develop the objectives of the response operation. Once theseobjectives are defined the overall response strategy is designed to meet thoseobjectives and the recovery, treatment or cleanup methods (tactics) are selectedto implement the strategy. One critical objective for spill response is wasteminimization. In arctic regions, this objective carries considerable weight due tothe remoteness of most locations and the distances that are involved in thelogistics of both mounting a response and then in disposing of waste thisWaste Management in Remote Areas4
operation generates. Linked to this waste minimization objective is the need tomake decisions that are environmentally and socially appropriate, operationallyfeasible, and financially acceptable.Arctic operations involve a realignment of standard concepts and a shift fromthose strategies that typically apply to populated and/or accessible areas. Oil spillresponse in the Arctic could involve operations at sea, in ice conditions or onoiled shorelines, or all three environments, at any time of the year. Each of theseoperations involves different waste types. Typically there is a strong emphasis onin situ offshore and onshore treatment options to avoid generating oily wastes orto achieve waste minimization.The concept applied in this project is the use of existing knowledge andinformation to provide practical tools for decision makers. This is achieved, inpart, by illustrations of the consequences of different strategy decisions and byproviding explanations of how policy decisions affect waste generation (e.g. withrespect to shoreline treatment end points).There are a number of oil spill waste management manuals and study reportsthat provide relevant information and guidelines for the implementation of spillresponse operations and in particular waste handling, transfer and disposal(CEDRE 2004, CONCAWE 1981, Environment Canada 2007, ExxonMobil 2005,IPIECA 2004, ITOPF 1984, Marty et al. 1993; NSEL, 2007, Stearns et al. 1997aand 1977b). This study does not replicate those manuals and guidelines.The primary purpose of this project is to develop guidelines and strategies toassist decision makers and the spill response team with respect to wastemanagement as no oily waste management manuals exist for remote and/orArctic regions. The focus of this guide is two-fold:Waste Management in Remote Areas5
1. on those specific elements of the decision process that affect the typesand volumes of waste that are generated by shoreline treatment, ratherthan how waste is generated or handled, and2. on those considerations that are integral to the selection of practical andfeasible shoreline treatment strategies and tactics for arctic regions and, inparticular, for remote areas.The first sections of this report present information that is necessary for thewaste management strategy decision process. This information includes:Waste Generation (Section 3)Waste Types (Section 4)Waste Volumes (Section 5)Elements of what happens to the waste that is generated are summarized inSections 6 though 8 which briefly discuss:Waste Handling (Section 6)Secondary Processing and Packaging (Section 7)Waste Transfer and Transport (Section 8)Recommendations for the contents of a waste management plan are discussedin Section 9.Waste Management Plans (Section 9)An interactive, graphic-oriented computer Job Aid has been developed for use bynon-technical (or technical) managers and decision makers.Waste Management Calculator Job Aid (Section 10)This Job Aid provides comparative waste volumes that potentially would begenerated by different shoreline cleanup techniques and using different cleanendpoint standards and can be used to evaluate response options.Waste Management in Remote Areas6
Five Appendices support the report: A summary table of data and information on waste amounts generated byshoreline treatment operations (Appendix A). A set of definitions and descriptions for terms and parameters used in theWaste Management Calculator (Appendix B). Recommendations for the contents and layout of oil spill wastemanagement plans (Appendix C). A summary of waste management legislation that relates to oil spills inArctic Canada (Appendix D). A summary of waste management legislation that relates to oil spills inNorway, including Svalbard (Appendix E).2.0 Oil Spill Management and the Decision ProcessA key element of a spill response is management by objectives, which involvesan orderly and systematic approach that enables the use of available responseresources in the most effective manner. The development of response objectivesrequires:a)knowledge on the type and volume of spilled oil,b)an estimate of where the oil will go (“spill pathway and fate”),c)knowledge of threats and risks in the spill path,d)understanding the likely effects and impacts of the spilled oil, ande)matching the planned response to minimize the effects of the oil.Typical response objectives at the regional level can include: Control oil at, or as near as possible to, the source. (for spills on land) Prevent oil reaching moving water: e.g. rivers, orthe coast.Waste Management in Remote Areas7
Minimize spreading and additional effects from the oil and theoperations. Protect vulnerable resources at risk. Minimize waste generation.An additional and very critical objective is the definition of the required, ordesired, shoreline treatment end point(s) towards which the operation is targeted.In the case of the M/V Selandang Ayu incident noted above, the shorelinetreatment objective defined by the spill management team involved the removalof virtually all of the oil stranded on the shorelines, which resulted in an intensivelevel of effort and the consequent generation of a large volume of waste.Although waste minimization was one of the operational objectives in thisoperation, this was subordinate to the shoreline treatment objective. By contrast,the response to the much larger spill (52,000 tons: 52 million L) from the T/VMetula in the Straits of Magellan, which oiled approximately 250 km of coast, didnot involve shoreline cleanup and therefore generated virtually no waste.The next critical decision following the definition of the treatment end-point(s) isthe selection of the treatment strategy to achieve that objective (Sergy andOwens, 2007 and 2008).Oiled sediment removal typically generates largevolumes of waste with very small concentrations of oil, often less than 1% byvolume. By contrast the application of in situ shoreline treatment methods, suchas mixing or sediment relocation, results in the generation of only operationalwaste materials with no oiled sediment disposal required. Similarly the decisionwhether to recover oil at sea or to use dispersants or burn the oil on the water,controls the volume of oily material that is generated.These first two elements of the decision process, setting treatment objectives(end points) and selecting the response strategy, are crucial in determining thevolume of waste generated by the response operation. The amount of wastegenerated by the response is not controlled by the size of the spill, nor theWaste Management in Remote Areas8
location, but rather is a direct function of decisions made by the spillmanagement team regarding the response objectives and response methods.Based on the concept of management by objectives, the decision process can beviewed as an 8-step sequence.1. Gather relevant INFORMATION to assess the situation.2. Define the response OBJECTIVE(S).3. Develop STRATEGIES to meet the objectives.4. Select the appropriate TECHNIQUE(S) or method(s) to implementthe strategy.5. Evaluate the FEASIBILITY of the strategies and methods in view ofthe environmental conditions and the nature of the spill.6. Prepare an action or response PLAN.7. Obtain appropriate APPROVALS, PERMISSION, or PERMITS.8. Implement the field RESPONSE OPERATION.Spill managers develop a general plan to guide the response operation andspecific plans that deal with the different components of the response, one ofwhich is the Waste Management Plan.3.0 Waste GenerationThe types and volumes of waste generated by response activities are determinedby the on-water and shoreline objectives set by the spill management team. If the decision is to allow natural recovery, as may be the case for a nonpersistent oil in a high-energy marine environment, then no waste isgenerated. For a marine or broken ice spill in which a r
be generated by different cleanup techniques and using different treatment endpoint standards. The amount of waste generated by oil spill response activities is not controlled by the size of the spill, nor the location, but rather is a direct function of the response objectives and the response methods selected by the spill management team. It