Transcription
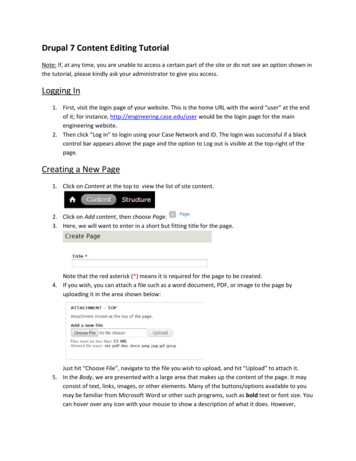
MPLAB ICD 2 TutorialThis document is adapted from the tutorial that forms Chapter 3 of the “MPLAB ICD 2 In‐Circuit DebuggerUser’s Guide”.1INTRODUCTIONThis tutorial walks you through the process of developing a simple project using a sample program,TUT452.asm. This program is an implementation of the PIC18F452 analog‐to‐digital (A/D) converter using thePICDEM 2 Plus Demo Board (DM163022). The program configures the A/D module to convert input from A/Dchannel 0 (connected to the potentiometer on the demo board) and display the results on the four PORTBLEDs (RB3:RB0).Topics covered in this tutorial: Setting Up The Environment Running the Project Wizard Viewing the Project Creating a Hex File Setting Debug Options Setting Up the Demo Board Loading Program Code For Debugging Running TUT452 Debugging TUT452 Programming the Application TUT452 Main Routine and Source Code2SETTING UP THE ENVIRONMENTThe MPLAB IDE software is installed and configured before you begin this tutorial. In the Mechatronics Lab wewill always power the ICD2 (or ICD3) from the USB cable that connects it to the host PC. An external powersupply will be used to power the target board (the PICDEM 2 Plus Demo Board for this tutorial).Remember: You must not inject a signal into the ICD2 (or ICD3) when it is not powered. This means that theICD2 must be connected to the host PC first and disconnected last.Use the following connection/power‐up sequence:1.Apply power to MPLAB ICD 2 by plugging it into the USB cable. DO NOT power the target. DO NOTconnect the ICD 2 to the target.2.Start the MPLAB IDE application which will look similar to Figure 1.3.Under the Debugger menu of MPLAB IDE, select Connect.4.After the host PC establishes USB communications with the MPLAB ICD 2, select Debugger Settings.5.In the Settings dialog, click the Power tab and ensure that the check box for “Power target circuit fromMPLAB ICD 2” is NOT checked. Click OK.6.Power the target system7.Connect the ICD 2 to the target system using the short RJ‐11 cable and then select Debugger Connect.8.All of the self‐tests on the Status tab of the Debugger Settings dialogue should pass.1
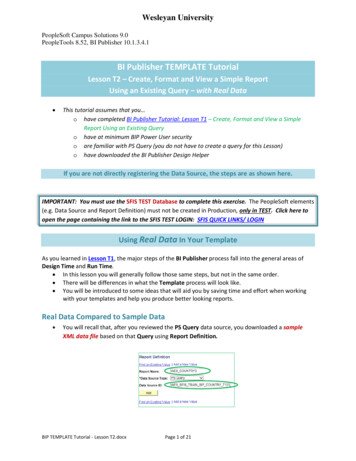
Figure 3.1: MPLAB IDE2.1 Selecting the Device and Development ModeTo select the PIC18F452 device that is on the PICDEM 2 Plus Demo Board for this tutorial:1.Select Configure Select Device.2.In the Device Selection dialog, choose PIC18F452 from the Device list box. The “light” icon next toMPLAB ICD 2 in the Microchip Tool Support section should be green.3.Click OKTo select MPLAB ICD 2 as a debugger:1. Select Debugger Select Tool MPLAB ICD 2. Note that the Debugger menu will also show the otherdebug options available. Also, the Output window will open to display connection information.Note: If MPLAB IDE attempts to connect on start up to the MPLAB ICD 2 but fails because a USBport is being used, allow the connection to fail. The communications port will be setup inthe next step.2. Select Debugger MPLAB ICD 2 Setup Wizard to set up ICD operation:a) Select port: USBb) Select target power supplyc) Enable auto‐connection featured) Enable automatic OS download feature3. Select Debugger Connect to connect to the MPLAB ICD 2.2.2 Updating MPLAB ICD 2 Firmware (Operating System)Depending on the version of MPLAB IDE or the device selected, a message may appear indicating that thefirmware needs to be updated. MPLAB IDE will automatically install new firmware. The update dialog may lookas in Figure 2. Allow the firmware to be updated.2
Figure 2: UPDATING MPLAB ICD 2 FIRMWARE DIALOG3CREATING THE PROJECTThe first thing to do is to obtain the two files that you will need for the tutorial and place them in a directory inyour file space.1.Follow the instructions in section 1.1 of the Mechatronics Laboratory ‐ Facilities document to createand assign permissions to a directory on the u: drive (\\mxlabserver\Groups) that you can share withyour lab partner.2.Make a new directory ‐ say Demo ‐ in the directory that you created in step 1.3.On the desktop there is a link to Coursework Files on Server. Open that link and go toMtrx3700\Initial Workspace\4.Copy the files from Initial Workspace into the directory that you created in step 2, and makethem writable. This is where you will put the project.5.To set up the project, select Project New from the MPLAB dropdown menus.6.Type a name for your project into the “Project Name” window. Select the directory that you created instep 2 by clicking on “Browse”, browse to the directory and then click on “OK”.7.The project has been created but there are no files in it yet. To add files, begin by opening the projectwindow: select View Project.8.Add files to the project by right‐clicking on “Source Files” in the Project Window, and then selecting theassembly language file TUT452.asm. This is the only source file in the project.9.Next you must add a linker script file to the project. A linker script file tells the linker which ranges ofaddresses are valid for particular types of program objects (FLASH program memory) and data objects(RAM). Add a linker file to the project by right‐clicking on “Linker Script” in the Project Window, andthen selecting the linker script file 18f452ai.lkr. Make sure that the file name has an ”i” (Think ICD)in it, which signifies that the particular linker script file reserves program and data memory space to beused by the debug executive.10. Check that the MPASM assembler is selected as the language tool. Select Project Select LanguageToolsuite and check that the Active Toolsuite is “Microchip MPASM Toolsuite”. Make sure that the toolsare set to the proper executables, by default located in the directory C:\ProgramFiles\Microchip\MPASM Suite. MPASM assembler should be pointing to mpasmwin.exe, MPLINK linkershould be pointing to mplink.exe, and MPLIB librarian should be pointing to mplib.exe.Note: You can also use the “Project Wizard” to create a project. For instructions see chapter 3 of the “MPLAB ICD 2 In‐Circuit Debugger User’s Guide”4 VIEWING THE PROJECTWhen the project has been created, the Project Window should look like Figure 2. Double‐clicking on a filename in the Project Window will open the file in the MPLAB editor. It is useful to enable “tabbed” editing ifthis has not been done. With a file open in the editor, select Edit Properties and make sure that “Use TabbedEditing” is checked.It is also useful to maximise the MPLAB window for the following steps.3
Figure 3: PROJECT WINDOW5ASSEMBLING AND LINKING TO CREATE A HEX FILETo create a hex file for debugging, select Project Build All or right click on the project name in the projectwindow and select “Build All” from the popup menu. This will launch the MPASM assembler to assemble eachassembly language file (only one in this tutorial) in the project. The Output Window will open (Figure 3) andyou will see the result of assembler execution. If the assembler succeeds, the linker will then execute. TheMPASM assembler and linker always make a .hex file with the same name as the source .asm file.Figure 4: OUTPUT WINDOW6SETTING DEBUG OPTIONSBefore you begin debugging your code, you will need to set up or check the default settings of several items.6.1 Configuration BitsTo set Configuration bits to be programmed into the device, select Configure Configuration Bits. By clicking onthe text in the “Settings” column, these can be changed.When using MPLAB ICD 2 as a debugger, you can choose to set the Configuration Bits using the MPLAB IDE.This is what we will do in this tutorial. First, un‐check the “Configuration Bits set in code” check box so that theConfiguration Bits dialogue in the IDE is active. In this dialog, the following Configuration bits should be set forthis tutorial: Oscillator: EC‐OS2 as RA6 (For PICDEM 2 Plus. If using another target, you MUST change to match) OSC Switch Enable: Disabled Power‐Up Timer: Enabled Brown‐Out Detect: Disabled Watchdog Timer: Disabled4
CCP2 MUX: RC1 Stack Overflow Reset: Disabled Low Voltage Programming: Disabled (it is incompatible with in‐circuit debugging) All other Configuration bits should be disabled.6.2 Programming OptionsTo set program options for this tutorial, select Debugger Settings and click on the Program tab.Figure 5: MPLAB ICD 2 SETTINGS DIALOG, PROGRAM TAB7 The “Memories” section should have “Program” checked, and “EEPROM” and “ID” unchecked. For the PIC18FXX2 devices, all memory will be erased each time the chip is programmed. Therefore, inthe “Program Options” section, “Erase all before Program” will have no effect. The “Program Memory” addresses (“Start” and “End” address) set the range of program memory thatwill be read, programmed or verified. Click Full Range to set the address range to the maximumprogram memory available based on the device selected. The end of program memory is adjusted toleave room for the MPLAB ICD 2 debug executive. Programs cannot extend beyond this upper limitwhile using MPLAB ICD 2 as a debugger. It is also useful to check “Program after successful build”. For additional information on all the options on the Program tab, see the MPLAB ICD 2 In‐CircuitDebugger User’s Guide.SETTING UP THE DEMO BOARDBefore beginning to debug, make sure the PICDEM 2 Plus Demo Board is set up as follows:5
8 The packaged oscillator has been selected by removing jumper J7. This selects the clock hardwarethat matches the way that the microcontroller clock circuits have been configured by the “EC OSC”selection in the Configuration Bits. LEDs have been enabled by fitting jumper J6 Power is suppliedLOADING PROGRAM CODE INTO THE TARGET FOR DEBUGGINGSelect Debugger Program to program TUT452.hex into the PIC18F452 in the PICDEM 2 Plus demo board.Note: The debug executive code is automatically programmed in upper program memory forMPLAB ICD 2 debug functions. Debug code must be programmed into the target PIC MCUto use the in‐circuit debugging capabilities of the MPLAB ICD 2.Programming may take a little while. During programming, the MPLAB ICD 2 tab of the Output Window showsthe current phase of operation. When programming is complete, the dialog should look similar to Figure 5.Figure 6: OUTPUT WINDOW ‐ MPLAB ICD 2 TAB9RUNNING TUT452 ON THE TARGETMPLAB ICD 2 executes in Real‐Time or in Step mode. Real time execution occurs when the PIC18F452 in the PICDEM 2 Plus demo board is put in the MPLABIDE’s Run mode Step mode execution can be accessed after the processor is halted.The toolbar buttons can be used for quick access to commonly used debug operations.Debugger MenuButtonRunHaltAnimateStep IntoStep OverStep OutReset PC6
Begin in Real‐Time mode:1.Open the TUT452.asm file (double click on the file name in the Project Window or use File Open).2.Select Debugger Run (or click the Run toolbar button).3.On the demo board, turn the potentiometer (RA0) and observe the LEDs. If the program was workingcorrectly, the user would see a binary representation of the voltage value across the potentiometer.However, there is a (deliberate) bug in the TUT452 program. The next section details debugging thecode and correcting it.4.Selecting Debugger Halt (or click the Halt toolbar button) stops the program execution.5.Selecting Debugger Reset resets the program (sets the program counter back to the reset address).10 DEBUGGING TUT452Any of the following could prevent the TUT452 program from working. The A/D converter value is not being properly written to PORTB (LEDs). The A/D converter is not enabled or has not been set to convert. A typing error in the source code is causing the program to function improperly.To explore the first possibility, set a breakpoint at the line of the file that writes the value of the A/D result toPORTB.1.Highlight or place the cursor on the following line of code from TUT452.asm:movwf PORTB;Write A/D result to PORTB2.Right click to display a shortcut menu.3.Select Set Breakpoint from the shortcut menu. This line is now marked as a breakpoint (B in red stopsign) as shown in Figure 6.Figure 7: SET BREAKPOINT4.Select Debugger Run (or click the Run toolbar button) to run the program once again in Real‐Timemode.A breakpoint stops a program’s execution when the pro‐gram executes the line marked as a breakpoint.However, the sample program is not halting.5.Select Debugger Halt (or click the Halt button on the toolbar) to halt the program now.In the source code window, the sample program will have halted on one of the two lines in the Waitroutine as shown in Figure 7 (at the arrow).Based on the halt location and the fact that the program never reaches the breakpoint, it can beconcluded that the problem is in the A/D conversion. The A/D flag for conversion complete is not beingset. A/D conversion initialization and setup occurs at the beginning of the program.7
Figure 8: PROGRAM HALTED6.To reset the program, select Debugger Reset. The first instruction should be indicated with a greenarrow.7.Open a new Watch window to watch the A/D register value change as the program executes. SelectView Watch. The Watch dialog opens with the Watch 1 tab selected. Select “ADCON0”, the A/DControl Register 0, from the list next to Add SFR, and then click the button. ADCON0 is added to theWatch window. Repeat for ADCON1. The selected symbols should now be visible in the Watch windowas shown in Figure 8.Figure 9: WATCH WINDOW8.In the TUT452.asm source code, set a breakpoint at the first instruction after Start. Highlight or placethe cursor in the following line of code from TUT452.asm:clrf PORTB;Clear PORTB9.Right click to display a shortcut menu. Select Set Breakpoint from the shortcut menu. This line will nowbe marked as a breakpoint.Select Debugger Run (or click the Run toolbar button) to run the program in Real‐Time mode. This timethe program will stop after it executes the break‐point line of code and the instruction after thebreakpoint will be indicated as shown in Figure 9.Figure 10: PROGRAM HALTED AFTER BREAK8
10. Single step five times, select
2.1 Selecting the Device and Development Mode To select the PIC18F452 device that is on the PICDEM 2 Plus Demo Board for this tutorial: 1. Select Configure Select Device. 2. In the Device Selection dialog, choose PIC18F452 from the Device list box. The “light” icon next to


![Unreal Engine 4 Tutorial Blueprint Tutorial [1] Basic .](/img/5/ue4-blueprints-tutorial-2018.jpg)