Transcription
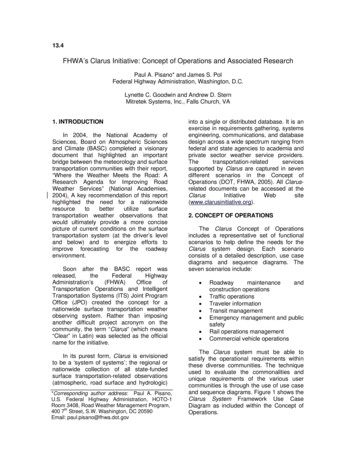
13.4FHWA’s Clarus Initiative: Concept of Operations and Associated ResearchPaul A. Pisano* and James S. PolFederal Highway Administration, Washington, D.C.Lynette C. Goodwin and Andrew D. SternMitretek Systems, Inc., Falls Church, VA1. INTRODUCTIONIn 2004, the National Academy ofSciences, Board on Atmospheric Sciencesand Climate (BASC) completed a visionarydocument that highlighted an importantbridge between the meteorology and surfacetransportation communities with their report,“Where the Weather Meets the Road: AResearch Agenda for Improving RoadWeather Services” (National Academies,2004). A key recommendation of this reporthighlighted the need for a tion weather observations thatwould ultimately provide a more concisepicture of current conditions on the surfacetransportation system (at the driver’s leveland below) and to energize efforts toimprove forecasting for the roadwayenvironment.Soon after the BASC report WA)OfficeofTransportation Operations and IntelligentTransportation Systems (ITS) Joint ProgramOffice (JPO) created the concept for anationwide surface transportation weatherobserving system. Rather than imposinganother difficult project acronym on thecommunity, the term “Clarus” (which means“Clear” in Latin) was selected as the officialname for the initiative.In its purest form, Clarus is envisionedto be a ‘system of systems’; the regional ornationwide collection of all state-fundedsurface transportation-related observations(atmospheric, road surface and hydrologic)*Corresponding author address: Paul A. Pisano,U.S. Federal Highway Administration, HOTO-1Room 3408, Road Weather Management Program,400 7th Street, S.W. Washington, DC 20590Email: paul.pisano@fhwa.dot.govinto a single or distributed database. It is anexercise in requirements gathering, systemsengineering, communications, and databasedesign across a wide spectrum ranging fromfederal and state agencies to academia andprivate sector weather service ed by Clarus are captured in sevendifferent scenarios in the Concept ofOperations (DOT, FHWA, 2005). All Clarusrelated documents can be accessed at g).2. CONCEPT OF OPERATIONSThe Clarus Concept of Operationsincludes a representative set of functionalscenarios to help define the needs for theClarus system design. Each scenarioconsists of a detailed description, use casediagrams and sequence diagrams. Theseven scenarios include: Roadwaymaintenanceandconstruction operationsTraffic operationsTraveler informationTransit managementEmergency management and publicsafetyRail operations managementCommercial vehicle operationsThe Clarus system must be able tosatisfy the operational requirements withinthese diverse communities. The techniqueused to evaluate the commonalities andunique requirements of the various usercommunities is through the use of use caseand sequence diagrams. Figure 1 shows theClarus System Framework Use CaseDiagram as included within the Concept ofOperations.
NOAACollectNon-SurfaceObserv ationsGenerate NOAANumericalForecastsNon-Surface ObservationsIntegrate NOAADataNOAA (non-ISOS)NOAA IntegratorGenerate SevereWeatherForecastsCollect SurfaceObserv ationsNOAA Collector for Clarus DataGenerate GeneralWeather Nowcastsand ForecastsArchive WeatherDataSurface Observ ation NetworksNOAA (ISOS)Prov ide NOAAWeather DataNOAA ResearchProv ide ESSMeasurementsTransfer ESSDataTransferRoadConditionDataESS Data CollectorESS EquipmentClarusCheck and FlagCollected ESSDataSend FlaggedESS DataCheck andFlag RoadCondition DataProv ideRoadw ayConditionsClarus OperatorSend FlaggedRoad ConditionDataRoadw ay ConditionCollectorRoadw ay Condition EquipmentTransfer ExternalWeather DataTransferVehicle DataCheck and FlagVehicle DataProv ide VehicleMeasurementsCheck and FlagNon-ClarusExternalEnvironment DataCompare ESS, Vehicleand Road ConditionData w ith ExternalWeather DataSend FlaggedVehicle DataVehicle Data CollectorVehicleClarus Manually EnteredData CollectorTravelersSend Flagged ESS,Road Condition andVehicle QC'd Data toCollectorsCheck and FlagManuallyEntered DataStore and IndexQuality ControlledDataTransfer of ClarusESS, Vehicle and RoadCondition Data andFlagsWeather InformationUser CommunityServiceProvidersProv ide Trav elerInformationInformation Serv ice ProviderProv ide PublicWeather Data(non-NOAA)Public Weather Observ ationEquipment (non-NOAA)Public Weather Data Collector (non-NOAA)Priv ate SurfaceTransportationWeather Serv ice Prov iderIntegrate andTransform ServiceProv ider DataProv ide PrivateWeather DataPriv ate Sector WeatherObserv ation EquipmentProv ide Valueadded PrivateWeather InformationProv ide Value-addedPriv ate SurfaceTransportationWeather InformationProv ide Valueadded PublicWeather InformationPriv ate Weather Data DisseminatorPriv ate Weather Data CollectorFigure 1 Clarus System Framework Use Case Diagram.Public SurfaceTransportationWeather Serv ice Prov iderProv ide Value-addedPublic SurfaceTransportationWeather InformationPublic Weather Data Disseminator
The use case diagram is used todescribe the outwardly visible operations ofa system and within the Concept ofOperations they define the systemboundary. The use case diagram has fourprimary elements: actors, use n as described below: Actors, represented by the stickfigures, represent any externaloperator or system interfacing withClarus.Use Cases, represented by ovals,describe the things the actors wantthe system to do, such as queryingthe Environmental Sensor Stations(ESS) in order to retrieve data froman ESS Data Collector.The lines connecting actors with usecasesareassociations.Associations indicate that there issome sort of interaction between theactor and the use case. The usecase diagrams are based on thenarrative text of the scenario.The lines, which are attached to onrelationships. The triangle symbol isattached to the actor (or use case)that is the generalized entity (e.g.,“vehicle” is generalized from thespecific “transit vehicle”).To the data user, Clarus will provide a“one stop” Internet location (portal) where s can be accessed in a timelymanner, with or without quality control flagsand metadata. The availability of these datathrough the Clarus portal has the potential tosignificantly improve traveler informationthrough 511, add detail to Highway AdvisoryRadio (HAR) broadcasts and VariableMessage Sign (VMS) alerts, and providenew clarity to transportation agency Websites, all of which support the variety of endusers.Information from Clarus can be used tocreate enhanced decision support tools forDOTs and travelers, as well as spawn newtechnologies that can provide roadconditions and forecasts remotely viadevices such as in-vehicle displays andhandheld personal digital assistants (PDAs)(Figure 2). However, the Clarus conceptdoes not stop with the collection of data fromthe nation’s 2,500 ESS operated by stateand local transportation agencies. Thedatabase will also store a variety of derived(from current technologies) and newobservation-related data sets from all modesof surface transportation. The result isenvisioned to be new data sets and productsfor transportation agencies, weather serviceproviders and researchers.Figure 2 The vision for Clarus to enhance and improve many aspects of surface transportationweather information.
Figure 3 The Clarus Initiative Road Map and development tracks3. CLARUS ROADMAPThe Clarus Initiative has an aggressivetimetable for system design, demonstrationand deployment. The Concept of Operationswas completed in May 2005. The high leveland detailed system requirements werecompleted during the fall of 2005. Thesystemdesignandproof-of-conceptdemonstration will be completed by the endof 2006. Following the proof-of-conceptdemonstration, a formal multi-state regionaldemonstration and evaluation will occur.This will lead to refinement of the systemdesignandasecondregionaldemonstration.system design. Track 3 also provides for amodel deployment and final series ofevaluations followed by updates to thesystem design.At the completion of the Clarus Initiativein 2009, the FHWA will have acomprehensive and tested design ready fornationwide deployment. The final step willbe to identify one or more hosts for asustainable nationwide deployment of theClarus system. Success will be measured bythe level of “buy-in” by those organizationsthat see value in the potential solutions thatthe Clarus Initiative could bring.These users include:The Clarus Initiative roadmap (Figure 3)consists of stakeholder coordination andparticipationthroughtheInitiativeCoordinating Committee (ICC) in Track 1.The ICC is a diverse group of stakeholdersinterested in the development anddeployment of the Clarus system. Theremaining tracks provide a high level view ofa rigorous systems engineering process thatis involved in the creation of the Clarussystem. Track 2 includes the creation of aConcept of Operations, preliminary systemdesignandaproof-of-conceptdemonstration. Track 3 includes a regionaldemonstration, evaluation and update to theState and local agencies: The state andlocal road and transit agencies must see thevalue in participating in the Clarus Initiativeby making their ESS data available tocollection servers, by providing metadataand maintenance information, and in somecases increasing data polling frequencies.Private sector service providers: Theprivate sector weather industry and serviceproviders must see the value in having aone-stop location to obtain quality controlledsurface transportation-related observations.Clarus data sets can be used as input to
weather or road condition models, real-timecollectives or as input into new value-addedforecast and decision support les greater flexibility in value-addedproducts since a common framework forinterface design will be specified.A deployment benefactor: Some entitysuch as a collective of organizations oranother federal agency (e.g., NOAA) mustsee the value in integrating and maintainingthe Clarus system so that there is a viablepath to sustainable operations. Dependingon the origin of the benefactor, differentbusiness models can be used for providingdata, tools and decision support capabilities.4. CLARUS RESEARCHClarus will be a dynamic initiative,growing and changing with the needs of itscustomers and with evolving technologiesduring its six year project time span. Tiedwith the development of the Clarus systemdesign are three specific research activitiesto explore new and existing technologiesthat could provide better insight into theenvironment of the road and the loweratmosphere. These activities include: inclusion of data from environmentalsensors on vehicles,examining the use of Closed CircuitTelevision (CCTV) cameras fordriver level visibility estimation, andtesting the feasibility of using lowcost, low power radar to enhanceobserving in the lower atmosphere.The following three sections discuss theseareas of research.4.1 VehicleResearchInfrastructureIntegrationVehicle Infrastructure Integration (VII)(DOT, JPO, 2005) is an independentinitiative funded and directed by the ITSJPO, and directly linked to Clarus through itsplanned database and quality controlcapabilities. The VII Initiative, whoseparticipants include the US DOT, stateDOTs, local government agencies, and aconsortium of automobile manufacturers,has the potential to change the way thatdrivers receive information from theirvehicles and how their vehicles interact withother vehicles in nearby proximity.The VII Initiative will examine s infrastructure” to re communications across thenation (FHWA, 2005). The primary goal ofVII is to provide a safer driving environment(e.g., reducing the number of crashes,injuries and fatalities). However, the dozensof onboard sensors represent a significantopportunity to sense the weather and roadconditions along the nation’s surfacetransportation system.Theautomobilemanufacturersparticipating in the VII Initiative are workingtoward a common data formatting andcommunications standard. Early in the nextdecade, many new vehicles may beequipped with a short range radiotransceiver. With a typical range of a halfmile (0.8 kilometers), vehicles will be able totransmit data from dozens of onboardsensors to the roadside infrastructure. It isenvisioned that in an initial implementation,there may be 100,000 roadside transceiversat signalized intersections and at strategicintervals along the nation’s freeways, with amature full implementation of over 400,000units. This flow of information could literally“light up” the nation’s transportation arterieswith millions of data messages (includingroad weather information) and change theway meteorologists view weather observingand forecasting in the lower atmosphere andat the surface.The draft VII Functional Architecture andRequirements document (FHWA ITS JPO,2005) describes some of the many dataitems that are envisioned to be available fortransmission. Table 1 provides a subset ofthose items that either directly or indirectlymeasure environmental (atmosphere androad surface) conditions and their potentialuses.
Table 1. VII Environmentally-related dataelements.Onboard VehicleDerivedSensorInformationLocation, drivingGPS vehicledirection and trafficlocationdataPrecipitationWiper system statedetectionHeadlightsLighting conditionsExterior airEstimated ambienttemperatureair temperatureTraffic data/impliedVehicle speedroad conditionsPrecipitationRain sensordetectionLight sensorLighting conditionsFog or visibilityFog lamp usageinformationTraction controlRoad tractionstatestate/mobilityAnti-lock brakeRoad tractionsystem statestate/mobilitySome of the parameters listed in Table1 include values that are directly measured(such as external air temperature or the rainsensor). For other elements, one might beable to infer certain conditions (such as roadicing with the use of the traction controlsystem or the anti-lock braking system). TheNational Center for Atmospheric Research(NCAR) will evaluate and validate the use ofdirectly measured and derived elements andtheir potential value for road weatherobserving and forecasting.4.2 CCTV ResearchMost state DOTs have deployed ClosedCircuit Television (CCTV) cameras atintersections and along freeways to aid intraffic management operations. Thesecameras provide images of not only trafficbut also convey the condition of the roadwayand even some weather information. TheMassachusetts Institute of Technology (MIT)Lincoln Laboratory will study the feasibility ofusing these images to estimate driver levelvisibility and create a set of portablealgorithms that could be customized for anylocation in the country (Hallowell, 2005). Ifsuccessful, this research could use existingtechnologies and infrastructure to provide anew and valuable observational elementwhich would eventually reside within theClarus system database.4.3 Radar ResearchA consortium of universities, and publicand private sector organizations known asthe Collaborative Adaptive Sensing of theAtmosphere (CASA) (CASA, 2005) areperforming research into deploying low cost,low power radars as “gap-fillers” for thenetwork of weather surveillance radarsoperated by the National Weather Service(NWS)andtheFederalAviationAdministration (FAA). A study performed bythe University of Oklahoma indicated that72% of the lower atmosphere (below 0.6miles or 1 km) is not sampled by NWS/FAAradars due to their spacing (18.7 milesversus 62.2 miles or 30 km versus 100 km)and the effects of Earth curvature (Brotzge,2005).The surface transportation weathercommunity would benefit if this researchindicated that these new surveillance radarswould help atmospheric scientists betterunderstand the complex weather and windflow conditions close to the ground. Resultsfrom this research could be used directly inthe routine analysis of the atmosphere, inthe grid initialization of weather models oreven spur the next generation of newboundary layer (land surface) models. It ishoped that this next generation of modelswill have more focus on creating improvedforecasts for surface transportation.5. THE CLARUS FUTUREThe FHWA Office of TransportationOperations and ITS JPO are funding anddirecting the Clarus Initiative during a sixyear period from 2004 to 2009. It isenvisioned that Clarus will leverageinvestments in ESS to collect, qualitycontrol, archive, and disseminate surfacetransportation weather observations. Inaddition, Clarus will fund three researchthreads that could add millions of newobserved and derived weather elementsthrough the use of existing and emergingtechnologies. Clarus will have the ability tochange surface transportation weatherobserving and forecasting, foster thedevelopment of new decision support tools,
and eventually create a more efficient andsafe surface transportation system.6. REFERENCESBrotzge, J, 2005: “Engineering ResearchCenter for Collaborative AdaptiveSensing of the Atmosphere,” presentedto the Federal Highway Administration atthe University of Okalahoma.Collaborative Adaptive Sensing of theAtmosphere (CASA), 2005;http://www.casa.umass.edu/.Department of Transportation, FederalHighway Administration (FHWA), 2005:“Clarus Concept of Operations,”Publication Number cuments.htm.Department of Transportation, JointProgram Office (JPO), 2005: “VehicleInfrastructure Integration (VII) .Federal Highway Administration, 2005;“Cultural Change: Operations andSurface Transportation Weather,”presented to the IntelligentTransportation Society of America,Phoenix, AZ.Federal Highway Administration, IntelligentTransportation Systems (ITS) JointProgram Office (JPO), 2005: “VehicleInfrastructure Integration, VII Architectureand Functional Requirements, Version1.0,”Hallowell, R and M. Matthews, 2005:“Automated Extraction of WeatherVariables from Camera Imagery,” MidContinent Transportation Symposium,Iowa State University, Ames, Iowa.National Academies Press, 2004: “Wherethe Weather Meets the Road: AResearch Agenda for Improving RoadWeather ml/.
Figure 3 The Clarus Initiative Road Map and development tracks 3. CLARUS ROADMAP The Clarus Initiative has an aggressive timetable for system design, demonstration and deployment. The Concept of Operations was completed in May 2005. The high level and detailed system requirements were completed during the fall of 2005. The