Transcription
11th Annual Public Private Partnership ConferenceCommunicating Financial StatementsMetrics and Red FlagsPresented byAnna Hofmeister, CPA, Tate & TryonJ. Scott Denlinger, CPA, CBIZ MHMAugust 25, 20111
AgendaNeeds of BoardsNeeds of ManagementKPIsReservesPotential ObstaclesReportingData VisualizationImplementationDon’t hesitate to ask questions!2
Needs of Boards3 Diversity of background and expertise makesboard reporting complicated Boards see numbers and dollars throughdifferent lens Focus more on how organization is performingin strategic areas rather than operational areas Volunteer leadership have day jobs; time isprecious and must be respected Benchmarking
Needs of Management Focus mostly on operational goals thatfeed into strategic goals Specific areas vs. global Diversity of background and expertise Timely is key Listen to them4
Key Performance Indicators(KPIs) 5Mission-driven- What are we supposed to be doing?Tied to strategic plan- Strategic initiatives determine KPIsMeasurable- Original goals compared to currentreality
KPIs continued Operationally relevantFinancial and/or non-financial- Registrations- Actual member numbers, renewal/retention rate- Giving patterns, duration of pledges, percentagecollected- A/R collections Organizations are different- Needs and culture affects how people look atfinancial reports6
Information Reportingto Meet These Needs7 Dashboard Narrative Financial statements
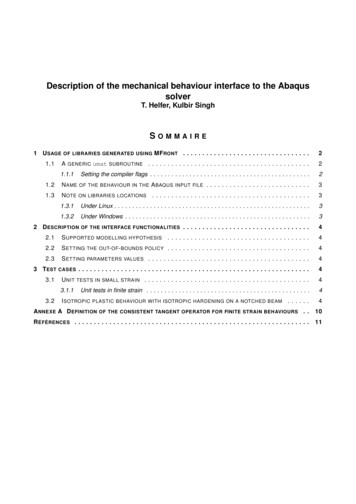
Classic ReportingGood information – can we learn more?8
Dashboard AlternativeCash balances drop in May –good to know for planning9Balances are influenced by marketforces, but also by withdrawals
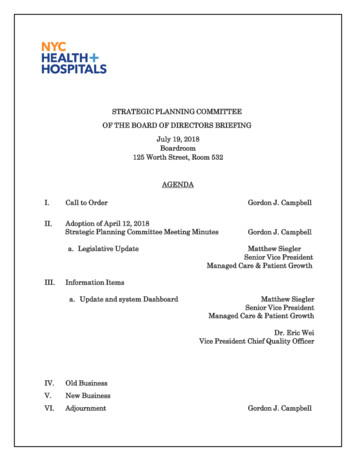
Classic ReportingGood information – can we learn more?10
Dashboard AlternativeYear-to-year comparison11Current year composition
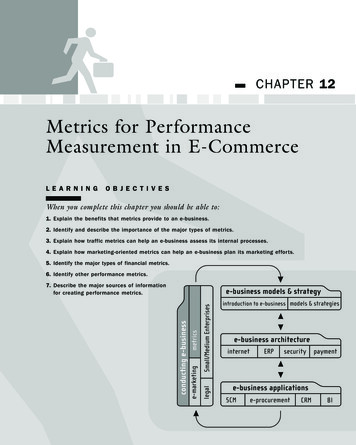
Classic ReportingWhat do we need to know about our liabilities?12
Dashboard AlternativeHow old are the payables?13When will the revenue berecognized?
RatiosCurrent Ratio:Shows organization’s ability to meet short-term obligations.Current AssetsCurrent Liabilities Your current ratio helps you determine if you have enoughworking capital to meet your short-term financial obligations. A general rule of thumb is to have a current ratio of at least 1.0. A current ratio under two may indicate an inability to pay currentfinancial obligations with a measure of safety.14
RatiosQuick Ratio:More stringent test of your ability to meet current obligations.Used by banks and management. Should not be less that 1.0.Quick Assets*Current Liabilities*Quick Assets generally means Current Assets minus Inventory andPrepaid Expenses.15
RatiosIndustry Benchmarks16PublicCharitiesTradeAssociationsQuick Ratio1.421.27Current Ratio2.972.36
RatiosSample RatioTOTAL CURRENT ASSETS 1,004,668 TOTAL CURRENT LIABILITIES17 735,7971.37
RatiosSample RatioTOTAL CURRENT ASSETSLESS: Prepaid expenses 1,004,66859,379TOTAL QUICK ASSETS 945,289 TOTAL CURRENT LIABILITIES18 735,7971.28
Building Reserves What types of reserves(emergency, expansion,equipment, etc.) Time frame for building upreserves19
Operating Reserves20 How do you calculate operatingreserves? What is an appropriate level ofoperating reserves? Building and maintaining anappropriate level of operatingreserves
Operating ReservesHow to Calculate21 Unrestricted net assets – Fixedassets Operating reserve Total expenses – Depreciation Operating expenses Operating reserve divided byoperating expenses
Operating ReservesCalculation ExampleUnrestricted net assetsLess: Fixed assetsOperating reserve Total expensesLess: Depreciation expenseOperating expenses 3,958,0455,144 3,952,901Operating reserve 997,04915,293981,756981,756 Operating expenses 3,952,901This means 25% (or 3 months) of their annual expenses2225%
Operating ReservesWhat Is An Appropriate Level? 23Minimum of 25%, or 3 months, of operatingexpensesOther factors to consider:- Type of organization- Types and diversity of revenue streams- Peaks and valleys in expenses- How susceptible the organization is toeconomic downturns- Large outlays of cash projected in future?
Potential Obstacles Donors Staff Board Desire to fulfill mission(Importance of Communication!)31
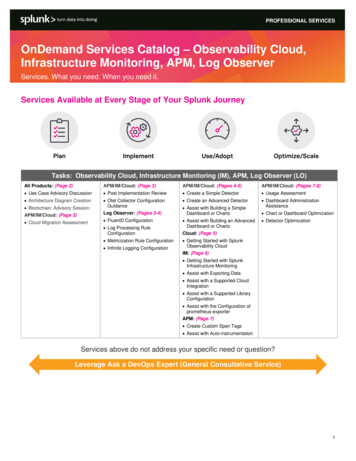
Classic ReportingMembership is down, but why?35
Dashboard AlternativeStacked bar chart – helps to geta sense of the total volume36Line chart – easy to see trendsfor each category
Classic ReportingWhy are event registrations lower?37
Dashboard AlternativeTotal registrations by weeks out– what happened at the end?38Registrations by category –looks like all categories wereaffected.
RatiosOperating Efficiency:Indicates percentage of each dollar spent on programs.AIPBenchmarkProgram related expenses75%Total expenses39
RatiosFundraising Efficiency:A measure of the cost of raising money.AIPBenchmarkFundraising expenses25%Related contributions40(ideally)(no more than 35%)
Sample RatioOperating EfficiencyProgram servicesManagement and generalFundraising 2,943,333602,073412,639Total Expenses 3,958,045Program services 2,943,333 Total Expenses41 3,958,04574%
Sample RatioFundraising EfficiencyFundraising expenses 412,639 Grants and contributions42 1,650,44525%
Cash Budgets & ProjectionsUse operating budget as a starting point:43 Convert accrual basis items to cash basis Back out noncash expense (depreciation andamortization) Add in non-expense outlays, such as loanrepayments or equipment purchases Add in line items for additions to operating orother reserves
XYX OrganizationCash Flow Budget WorksheetYear ending December 31, 20XXAdjustmentsSUPPORT AND REVENUEContributionsInterest and dividend incomeTOTAL SUPPORT AND REVENUEEXPENSESAdministrative feesBoard expensesCleaningCommission - rentalsDepreciationInsuranceMiscellaneous expensesOffice expensePersonnel expensesProperty taxesRepairs and maintenanceSecurityTrash and haulingTravelUtilitiesTOTAL EXPENSESCHANGE IN NET ASSETSabc44 1,404,12552,5251,456,650 stments to reverse out accrualsElimination of non-cash expensesInclusion of cash outflows not recognized as abaa150,00028,47739,6183,934ccca139,741CASH INFLOWSContributionsInterest and dividend incomeTOTAL CASH INFLOWS CASH OUTFLOWSAdministrative feesBoard expensesCleaningCommission - rentalsDepreciationInsuranceMiscellaneous expensesOffice expensePersonnel expensesProperty taxesTransfer to reservePurchases of property and equipmentRepayment of notes payableRepairs and maintenanceSecurityTrash and haulingTravelUtilitiesTOTAL CASH OUTFLOWSNET CASH FLOWS ,68355151,5031,464,56631,016
XYX OrganizationQuarterly Cash Flow Budget WorksheetYear ending December 31, 20XX1st QtrBEGINNING CASH 117,2493rd Qtr 1894th Qtr Total365,117 150,469CASH INFLOWSContributionsInterest and dividend incomeTOTAL CASH 571,495,582CASH OUTFLOWSAdministrative feesBoard expensesCleaningInsuranceMiscellaneous expensesOffice expensePersonnel expensesProperty taxesTransfer to reservePurchases of property and equipmentRepayment of notes payableRepairs and maintenanceSecurityTrash and haulingTravelUtilitiesTOTAL CASH 3,632)NET CASH FLOWSENDING CASH45150,4692nd Qtr(33,221) 117,249 189 365,117 181,48531,016 181,485
Breakeven Cash FlowMonthly fixed costs:- Rent & utilities- Payroll & benefits- Loan/equipment lease payments- Other monthly costsBreakeven cash flow refers to the nondiscretionary coststhat you must cover each month – it is the amount ofcash you must have on hand (not revenue on the books)46
Data Visualization Applications Microsoft Excel- 2007 and 2010 versions have bettercharting capability- You already have it on your computers;no additional purchase necessary- Data are not automatically refreshed;no real-time reporting capability- Can be labor-intensive to set up47
Data Visualization Applications48 NetCharts performance dashboards Tableau Dundas Xcelcius QlikView
Data Visualization Applications 49Web-basedReal-time connectivity/automaticrefreshConnectivity to diverse databasesEase of use/comfortable interfaceTechnical knowledge required?Customizable views/charting
Implementation Suggestions50 Less is more Work with readily available data Assess the reader’s readiness Carefully choose what youpresent
QuestionsJ. Scott Denlinger, CPA, isthe Director in charge ofthe CBIZ MHM OutsourcedServices practice and hasmore than 20 yearsexperience in accounting,tax and auditing.51Anna M. Hofmeister, CPA,is the partner in charge ofTate & Tryon’s OutsourcingServices practice and hasmore than 20 years ofexperience servingnonprofit organizations.Mr. Denlinger designs and manages outsourced CFO andaccounting engagements serving both for-profit andnonprofit organizations. He also performs CFO duties forseveral organizations, assisting in the preparation ofinternal financial statements and presentation to theirBoards. With his extensive auditing experience, Mr.Denlinger is able to assist our outsourcing clients inpreparing for their year-end audits. Combining hiscommunication skills and ability to translate difficultaccounting concepts into laymen’s terms, as well as hispenchant for teaching, Mr. Denlinger is frequently asked tolead seminars and workshops by various organizations ona broad range of financial management and reportingtopics. He is a member of the MACPA Government andNonprofit Conference Committee and serves on the Boardof Family and Children Services of Central Maryland.In her role as an interim or permanent CFO, Ms. Hofmeisterfrequently presents to finance committees and boards ofdirectors on topics such as financial results; key performanceindicators; cash flow projections; budgets and financialprojections; streamlining business operations; internal controldesign and documentation; aligning chart of accounts &financial statements to conform with strategic objectives; costallocations; and federal and private grant accountingrequirements. Anna is a frequent speaker on nonprofitaccounting and financial management topics and haspresented at ASAE’s Finance, HR, and Business OperationsConference and the GWSCPA Not for Profit OrganizationSymposium. She has also written several articles published inASAE’s Dollars & Cents newsletter including “CoreCompetencies of a Finance and Business OperationsProfessional” and “Mastering Functional Expense Allocations.CBIZ MHM, LLC – Bethesda, MD(301) 951-3636 sdenlinger@cbiz.comTate & Tryon – Washington, DC(202) 419-5103 ahofmeister@tatetryon.com
11th Annual Public Private Partnership ConferenceCommunicating Financial StatementsMetrics and Red FlagsPresented byAnna Hofmeister, CPA, Tate & TryonJ. Scott Denlinger, CPA, CBIZ MHMAugust 25, 201152
Your current ratio helps you determine if you have enough working capital to meet your short-term financial obligations. A general rule of thumb is to have a current ratio of at least 1.0. A current ratio under two may indicate an inability to pay current financial obligations with a measure of safety. Current Assets Current Liabilities