Transcription
HSEHealth & SafetyExecutiveExcursion tables in saturation diving decompression implications ofcurrent UK practicePrepared by Unimed Scientific Limited for theHealth and Safety Executive 2004RESEARCH REPORT 244
HSEHealth & SafetyExecutiveExcursion tables in saturation diving decompression implications ofcurrent UK practiceValerie Flook PhD, CPhys, MInstPUNIMED SCIENTIFIC LIMITED123 Ashgrove Road WestAberdeenAB16 5FAUnited KingdomUnimed Scientific Limited has undertaken, on behalf of UK Health and Safety Executive, a study of thedecompression risks of saturation diving with particular reference to the risks which arise from depthchanges during the work shifts, excursions. Decompression safety has increased over the decades forwhich this type of diving has been used in the North Sea, and the risk of decompression sickness tothe individual is low. As in any industry, further improvements can be made and this work has shownpossible options for improvement.Decompression bubble formation has been evaluated using a mathematical model of decompressionvalidated by comparison with Doppler bubble scores and DCI incidence during both trials andoperational hyperbaric conditions.The main conclusion from the work is that neither excursions alone, as currently used, nor thedecompression procedures alone, are likely to cause decompression problems. The risks result fromthe combination of excursions followed by decompression before the bubbles have totally resolved.Starting decompression whilst bubbles are present is the single significant risk factor. This findingexplains the limited success of earlier attempts to reduce risk by either reducing the allowed excursiondepths or prolonging the decompression from saturation.A secondary conclusion is that by taking an approach which considers excursions and decompressiontogether further reductions in risk could be achieved. The reductions could be considerable and, fromthe work reported here, it seems likely that these improvements could be made with an increase inoperational efficiency.This report and the work it describes were funded by the Health and Safety Executive (HSE). Itscontents, including any opinions and/or conclusions expressed, are those of the authors alone and donot necessarily reflect HSE policy.HSE BOOKS
Crown copyright 2004First published 2004ISBN 0 7176 2869 8All rights reserved. No part of this publication may bereproduced, stored in a retrieval system, or transmitted inany form or by any means (electronic, mechanical,photocopying, recording or otherwise) without the priorwritten permission of the copyright owner.Applications for reproduction should be made in writing to:Licensing Division, Her Majesty's Stationery Office,St Clements House, 2-16 Colegate, Norwich NR3 1BQor by e-mail to hmsolicensing@cabinet-office.x.gsi.gov.ukii
CONTENTS1.0 INTRODUCTION12.0 CALCULATIONS32.1 Excursions studied42.2 Decompression from living depth52.3 Significance of the predictions53.0 DOWNWARD EXCURSION RESULTS73.1Pulmonary artery gas73.2Gas in bubbles in brain tissue93.3Effect of duration of hold113.4Effect of repeat excursions123.5Effect of final decompression123.6Bubble growth in the non-average diver154.0 UPWARD EXCURSIONS194.1Pulmonary artery gas194.2Gas in bubbles in brain tissue205.0 CONCLUSIONS23REFERENCES25iii
iv
EXECUTIVE SUMMARYUnimed Scientific Limited was asked by UK Health and Safety Executive to evaluate the risk ofdecompression bubble formation arising from the use of excursions to depths greater or lessthan the living depth during heliox saturation diving. Decompression illness is not unknownfollowing decompression from saturation exposures despite what appear to be conservativedecompressions. One of the factors which can contribute to the extent of decompression bubbleformation is depth changes during the course of bottom time.Decompression safety has increased over the decades for which this type of diving has beenused in the North Sea. As in any industry, further improvements can be made and this work hasshown possible options for improvement, but the possibility to reduce risk does not imply thatcurrent levels of risk are dangerous to the individual. The level of risk described in this report isthe level currently found acceptable; the fact that this study has been made indicates anintention to reduce risk further. The hyperbaric exposures dealt with in this report representcurrent practise.The calculations were made using the USL model of decompression. This model has beenvalidated by comparison of the predictions made by the model, of the volume of gas carried asbubbles, with precordial Doppler scores recorded in trials and under operational conditions, fora wide range of hyperbaric exposures used in diving and compressed air (CA) work. It has alsobeen validated by comparison with the incidence of decompression illness symptoms (DCI) forcompressed air exposures using the HSE database which contains results from about halfmillion exposures collected over several decades. This comparison is especially relevant to thecurrent work as the duration of CA exposures is similar to the duration of excursions.USL has details of the allowed procedures for several diving companies covering both the UKand Norwegian sector of the North Sea. For each saturation depth considered, the excursions tobe studied were selected in the following way:the maximum excursion for the company which allowed the greatest depth change,the special case maximum depth change allowed by a second company,the standard maximum depth case for that company,the maximum depth change allowed in the Norwegian sector.This gave a good spread of allowed exposures for inclusion in the study.The work reports bubbles formation following excursions, bubble decay between excursionsand the effect of the final decompression on bubble formation.v
All aspects of operational saturation diving have been considered. These include;both upward and downward excursions,the effect of different rates of depth changethe effect of different hold times between the last excursion and the finaldecompressionThe predictions for bubble formation following each exposure are presented in several forms;the volume of gas which will form bubbles in the central venous bloodthe percentage of divers who may be expected to form bubbles somewhere in the body,the volume of gas which will form into bubbles in the brain tissue,the percentage of divers who will form bubbles in the brain.The main conclusion from the work is that there are bubbles formed on excursions but thatneither the excursions currently used nor the decompression procedures are likely to causedecompression problems. The risks result from the combination of excursions followed bydecompression before bubbles have totally resolved. Starting decompression whilst bubblesare present is the single significant factor.This is a significant finding because over the years excursions have been seen as the maincause of problems and as a result depth changes have been restricted. Similarly over the yearschanges have been made to decompression schedules, in general slowing down the rate ofchange of pressure in an attempt to reduce the DCI rate, without reference to the fact that thetrouble is more likely to have originated with the preceding excursions. This study hasshown that excursions and decompression must be considered together. This introduces thepossibility that by considering excursions and decompressions together changes can be madewhich will reduce risk without increasing operational costs. Indeed preliminary work suggeststhat the improvements could be made with a considerable increase in operational efficiency.vi
1.0 INTRODUCTIONUnimed Scientific Limited has been asked by UK Health and Safety Executive to evaluate therisk of decompression bubble formation arising from the use of excursions to depths greater orless than the living depth during heliox saturation diving.Decompression illness is not unknown following decompression from saturation exposuresdespite what appear to be conservative decompressions. One of the factors which can contributeto the extent of decompression bubble formation is depth changes during the course of bottomtime. Jacobsen et al ( 1997) reported on the relationship between the incidence ofdecompression illness (DCI) and the pressure profile of 2,622 saturation dives in the Norwegiansector between 1983 and 1990. They concluded that there was a positive relationship betweenDCI rate and the number of depth changes during the saturation period.A common form of depth change is an excursion, to allow divers to work at depths differentfrom the storage depth of the living chambers. This allows greater flexibility and excursions canbe a cost effective move in that the divers are allowed to work at a greater depth than mainstorage without the increased decompression time which would be required from the greaterdepth. An upward excursion allows divers to carry out work at shallower depths withoutsubjecting the whole dive crew to a pressure reduction. Excursions are usually for 6 to 8 hourand as such excursions represent a significant change of gas load in all tissues of the body. A 6hour excursion to a depth 15 metres deeper than storage depth will increase gas load by thesame amount as a 6 hour dive to 15 metres from surface. Nobody would consider doing a no stop decompression from 6 hours at 15 metres whereas that is what is done at the end of a 6hour 15 metres excursion.Most diving companies define limits to the depth changes which can be undertaken as anexcursion and the thinking behind the limits is based on Boyle's Law, that it is not the pressurechange per se which determines the magnitude of bubbles growth but the relative pressurechange. Lesser bubble growth for a given pressure change if the overall depth is greater. Thisapproach presupposes the formation of decompression bubbles on all excursions.The present study has been carried out in order to look at the likely risk of decompressionbubble formation related to excursions, to evaluate the extent of bubble growth and to look atthe effect on the bubbles of the subsequent decompression from saturation.This report is concerned with the risk to health and safety of divers carrying out saturationheliox dives. Decompression safety has increased over the decades for which this type ofdiving has been used in the North Sea. As in any industry, further improvements can be madeand this work has shown possible options for improvement, but the possibility to reduce riskdoes not imply that current levels of risk are dangerous to the individual. The level of riskdescribed in this report is the level currently found acceptable; the fact that this study has beenmade indicates an intention to reduce risk further. The hyperbaric exposures dealt with in thisreport represent current practise.1
2
2.0 CALCULATIONSThe calculations were made using the USL model of decompression which has been describedfully elsewhere (Flook 2004). This model has been validated by comparison of the predictionsmade by the model, of the volume of gas carried as bubbles, with precordial Doppler scoresrecorded in trials and under operational conditions, for a wide range of hyperbaric exposuresused in diving and compressed air (CA) work. It has also been validated by comparison withthe incidence of decompression illness symptoms (DCI) for compressed air exposures using theHSE database which contains results from about half million exposures collected over severaldecades. This comparison is especially relevant to the current work as the duration of CAexposures is similar to the duration of excursions.The model uses an iterative procedure to solve numerically the equations which track gasmovement, both in solution in the tissues and blood and as a separated gas phase in bubbles,throughout the whole of an exposure from compression to the end of decompression and forseveral hours after the end of decompression. The time increments used for the iterations in thecurrent study range from 0.1 minute for the decompression from excursions to 1 minute for thedecompressions from saturation. The individual tissues of the body are grouped together,forming eight groups each defined by the time constant for inert gas movement. At eachiteration the model determines the total volume of gas, that carried in the bubbles plus thevolume remaining in solution, in the tissues and the blood draining those tissues. The volume ofgas carried as bubbles in each compartment, or group of tissues, provides the means to comparedifferent decompressions. The volume of gas in the compartments is also combined, using aweighted mean of the 8 compartments, to give the volume of gas carried as bubbles in thecentral venous, pulmonary artery (PA), blood. This value, in addition to being used to comparedecompressions, relates to the Doppler precordial bubbles score and to the DCI incidence. Thusthe model makes predictions which can be used with reference to individual tissues and withreference to whole body risk.Obviously the model uses values for tissue size and blood flow which describe the averageperson. Therefore all predictions are for the average result which might be expected for a groupof individuals undergoing identical exposures. This means that 50% of individuals will have thepredicted level of gas or more in bubbles and 50% will have the predicted level or less.Working with the average is a useful approach because any hyperbaric exposure which is saferon average will also be safer for the individual. However the level of risk to the individual cannot be predicted in the absence of measurements of tissue blood flow in that individual duringthe exposure.It is possible to make some predictions for the extreme ends of the physiological range, for theindividual who is far from average. For most physiological and anatomical parameters 99.9%of individuals are within 20% of the average value. The model has been used to calculate theoutcome for an individual at the extreme end of the range, in the direction which would lead togreater decompression bubble formation, for a decompression from saturation and theimplications of this are considered in this report.3
2.1 EXCURSIONS STUDIEDTime constraints made it necessary to select excursions for inclusion in the study. USL hasdetails of the allowed procedures for several diving companies covering both the UK andNorwegian sector of the North Sea. For each saturation depth considered, the excursions to bestudied were selected in the following way:the maximum excursion for the company which allowed the greatest depth change,the special case maximum depth change allowed by a second company,the standard maximum depth case for that company,the maximum depth change allowed in the Norwegian sector.This gave a good spread of allowed exposures, as shown in Table 1. Only at one saturationdepth did the maximum excursion allowed in Norwegian waters differ from the standardalready selected.Table 1 includes both upward and downward excursions; one company has lower maximumdepth changes allowed for upward excursions. Depth changes which are only allowed in thedownward direction are marked * and followed (in brackets) by the corresponding depth changefor upward excursions.TABLE 1 Saturation and excursion depths,upward and downward excursions (see text)Saturation depthExcursion Depth180 msw38* (34)3015150 msw35* (31)2613120 msw31* (28)241290 msw26* (25)201060 msw23* (19)18930 msw17* (14)12*6All excursions were assumed to last a maximum time of 8 hours.413
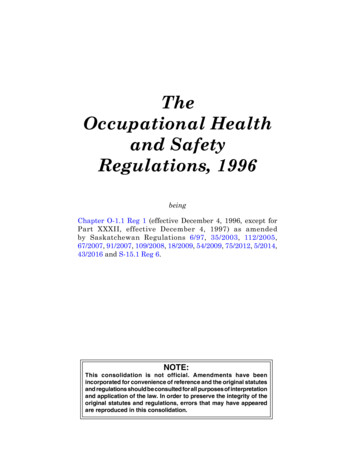
Between the companies there is a range of allowed rates of return to living pressure, from 18msw/min to 10 msw/min, both these rates were used in the calculations. An additional slowerrate of 5 msw/min was also included as USL has experience that this slower rate will bebeneficial in reducing bubble formation in the brain.There is also, between the companies, a small range of oxygen levels allowed duringexcursions. Because of the effect of the oxygen carriage by haemoglobin this difference ininspired oxygen becomes insignificant at tissue level so a single value for inspired oxygen wasused for the excursions, this was 0.7 ATA.2.2 DECOMPRESSION FROM LIVING DEPTHThere are differences in decompression procedures between the companies. Mathematicalsimulation of a decompression from saturation can use well over a quarter million iterativecalculations and therefore it was not possible, within the constraints of the study, to follow morethan one procedure. The alternative decompressions from 180 msw were compared and theprocedure which gave the shortest time was used. The same company's procedures were usedfor decompressions from other depths. The lowest oxygen levels allowed at the saturationdepth and during decompression were chosen. The differences between those used by differentcompanies is insignificant in terms of decompression bubble formation. The combination offastest decompression and lowest oxygen should mean that the worst case was simulated.The decompression profile used was 1.5 msw/hour to 15 msw, thereafter 0.5 msw in every 50minutes with a 4 hour hold in every 24 hours. Inspired oxygen during saturation was taken as0.35 ATA and during decompression as 0.5 ATA with the appropriate adjustment closer to thesurface.According to model predictions this procedure will not cause bubbles in the average diver butmay cause bubbles in divers at the extreme end of the normal range. The significance of this isdealt with where appropriate in this report.2.3 SIGNIFICANCE OF THE PREDICTIONSAs mentioned above it is possible to interpret the model predictions in terms of precordialDoppler scores and of likely incidence of DCI. The UK Health and Safety Executive, at aninternational workshop organised by USL under the sponsorship of the HSE, accepted therecommendations of the assembled scientists that Doppler scores higher than Grade 2 wereconnected with a greatly increased risk of DCI.(Simpson 1999). From the calibration of themodel predictions against measured Doppler scores, Grade 2 corresponds to a central venous(PA) gas in bubbles of 4 µl/ml.Figure 1 shows the relationship between model predictions and DCI rate drawn from thecompressed air data base. The two completely different ways of validating the model coincide,and fit with the recommendations of the workshop. Doppler Grade 2 corresponds to 4 µl/mlwhich is shown on the figure to be the point at which the DCI incidence begins to be ameasurable quantity based on a half million exposures in the CA database.5
Figure 1 Relationship between model predictions and known DCI rate6
3.0 DOWNWARD EXCURSION RESULTSAs described above, the model can be used to determine predicted bubble levels in the wholebody, presented as gas in bubbles in pulmonary artery (PA) blood, and also to look at the riskfor individual tissues. From experience it is known that the tissue most at risk during pressurereduction at the rates considered here, is the brain. The predictions relating to downwardexcursions are therefore presented both for the pulmonary artery gas and the brain.3.1PULMONARY ARTERY GASTable 2 shows the predicted maximum value for gas in bubbles in the pulmonary artery for allexcursions using 10 msw/min as the rate of return. The predictions are the average for all diversand are given as volume of gas carried as bubbles in each ml of central venous blood, µl/ml.Taking 20% as the normal physiological variation it is possible to calculate the percentage ofindividuals who would have some bubbles somewhere in the body and these figures are given inbrackets in the table.TABLE 2 Predicted PA gas (µl/ml) and percentage who will bubbleSaturation depth180 msw150 msw120 msw90 msw60 msw30 mswExcursion Depth38 msw30 msw15 msw13 msw0.43 (99)0.31 (95)0.10 (63)0.07 (56)35 msw26 msw13 msw0.47 (99)0.30 (93)0.09 (56)31 msw24 msw12 msw0.59 (100)0.33 (95)0.09 (56)26 msw20 msw10 msw0.50 (99)0.33 (93)0.00 (44)23 msw18 msw9 msw0.61 (100)0.45 (96)0.00 (37)17 msw12 msw6 msw0.67 (99)0.33 (69)0.00 (5)7
It must be remembered that the predictions are the average for all divers; where the average gasin bubbles is 0.0 µl/ml fewer than 50% of divers will have bubbles, as shown by the number inbrackets.Reference to section 2.3 shows that these levels of bubble formation are low and should notcause DCI symptoms in the average diver. The level below which bubbles would beundetectable in most divers using either Doppler or ultrasonic scanning is about 2 µl/ml.The columns correspond each to a single source for the excursion depths; column 2 relates tothe maximum allowed by one company, column 3 to special exposures for another company andcolumn 4 to the standard exposures. This is of interest because it might be expected that anysingle company would use, as maximum excursions, depth changes chosen to give a similarlevel of risk; another company might be expected to design to a different level of risk. Thedifferent levels of bubble formation between columns is clear but there is no evidence that thereis constant risk within any column. For example the allowed excursions from 60 msw give agreater level of bubble formation than those for other depths in both columns 2 and 3.3.1.1Effect of rate of ascentThree rates of ascent were studied, 18, 10 and 5 msw/min. Table 3 shows the range of predictedbubbles for each excursion, the fastest rate of ascent giving the most bubbles. The ranges aresmall, different rates of ascent have relatively little effect.TABLE 3 The effect of ascent rate on predicted PA gas in bubbles (µl/ml)Saturation depth180 msw150 msw120 msw90 msw60 msw30 mswExcursion Depth38 msw30 msw15 msw13 msw0.439 - 0.4230.312 - 0.3030.098 - 0.0960.071 - 0.06335 msw26 msw13 msw0.472 - 0.4540.303 - 0.2960.087 - 0.08531 msw24 msw12 msw0.593 - 0.5690.335 - 0.3280.090 - 0.08826 msw20 msw10 msw0.508 - 0.4890.332 - 0.3260.00023 msw18 msw9 msw0.618 - 0.5960.448 - 0.4400.00017 msw12 msw6 msw0.674 - 0.6610.332 - 0.3240.0008
3.2GAS IN BUBBLES IN BRAIN TISSUETable 4 shows the predicted volume of gas carried as bubbles (µl/ml) in brain tissue andvenous blood draining the brain together with the percentage of divers who would havebubbles in the brain. For most excursions most divers will form bubbles in the brain tissue onreturn to living depth.TABLE 4 Gas in bubbles (µl/ml) in brain and percentage with bubblesSaturation depth180 msw150 msw120 msw90 msw60 msw30 mswExcursion Depth38 msw30 msw15 msw13 msw0.112 (90)0.065 (84)0.008 (56)0.004 (50)35 msw26 msw13 msw0.120 (93)0.059 (84)0.006 (50)31 msw24 msw12 msw0.164 (96)0.066 (84)0.005 (50)26 msw20 msw10 msw0.121 (93)0.059 (84)0.000 (38)23 msw18 msw9 msw0.150 (90)0.088 (87)0.000 (32)17 msw12 msw6 msw0.146 (90)0.036 (50)0.000 (4)Model predictions of the volume of brain gas in bubbles are not easily compared with anyknown measurements. Neuropathologists have some experience of the extent to which thecontents of the skull can increase in volume before death is the inevitable outcome. A figureof 4%, 4 ml per 100 ml, 40 µl/ml, is sometimes quoted as the limit. This compares well with adeath from decompression bubbles which was not preventable by recompression treatment,following an explosive decompression which the model predicted to give 35.5 µl/ml for gas inbubbles in the brain. Trials of military diving, for which there is a great deal of Doppler dataand information about the DCI rate, used procedures predicted by the model to give amaximum volume of gas carried as bubbles in the brain of 11.6 µl/ml, so this can be taken as alevel which can be survived. No CNS DCI cases were reported in those trials. These numbercan be used to put the results in Table 4 into some kind of perspective.9
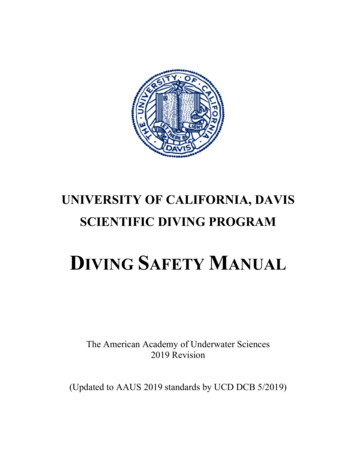
3.2.1Effect of rate of ascentTable 5 shows the effect of the three ascent rates on brain bubbles. The range is shown, thefastest rate causing the highest volume of gas in bubbles. The benefits of slowing the ascentare obvious. Taking an extra few minutes over the return reduces the brain gas to 75% or less.Although the volumes shown in Table 4 would appear to carry no risk it must be rememberedthat they are for the average. It must also be remembered that brain blood flow is very labileand the increased levels of oxygen during an excursion may cause local transient reductions inflow during which that portion of the brain will not be able to offload gas and bubbles mayform. Once formed they will not resolve when blood flow returns to normal. Given the fewminutes which the slower return would add it should always be good practice to give the brainthis extra protection.TABLE 5 The effect of ascent rate on brain gas (µl/ml)Saturation depth180 msw150 msw120 msw90 msw60 msw30 mswExcursion Depth38 msw30 msw15 msw13 msw0.122 - 0.0900.071 - 0.0530.009 - 0.0060.005 - 0.00335 msw26 msw13 msw0.131 - 0.0970.066 - 0.0490.006 - 0.00431 msw24 msw12 msw0.179 - 0.1320.073 - 0.0540.006 - 0.00026 msw20 msw10 msw0.133 - 0.0990.065 - 0.0480.00023 msw18 msw9 msw0.167 - 0.1230.097 - 0.0710.00017 msw12 msw6 msw0.162 - 0.1160.042 - 0.0000.000Figure 2 compares the effect of the different ascent rates on pulmonary artery gas (dotted line)10
and brain (solid line) for the ascent from a 38 msw excursion from living depth of 180 msw.Figure 2 Effect of ascent rate on bubbles in pulmonary artery blood (dotted line) andin brain (solid line)3.3EFFECT OF DURATION OF HOLDThe diving companies all specify a period of time for which the divers, following a downwardexcursion, should remain at the living pressure before the start of decompression. Theintention is to allows any bubbles formed during the return to be resolved. Table 6 shows theamount of gas carried as bubbles in the pulmonary artery blood at the end of holds of 6, 12 or24 hours, expressed as a percentage of the volume immediately on return to living depth. Anempty cell in the table indicates an excursion which produced no bubbles. The reduction inbubbles, even from a 6 hour hold, is valuable but only after the mildest of excursions are thebubbles resolved during a hold as long as 24 hours.The operational procedures on the duration of this hold were written long before it wasrealised how long bubbles could last.11
TABLE 6 Percentage of original bubbles remaining at the end of the holdDuration of hold (hours)Saturation 4.0%EFFECT OF REPEAT EXCURSIONSDivers are expected to do a work shift each day which means that excursions are repeatedwith approximately 16 hours between each. Any bubbles remaining from the previousexcursion would be compressed on the return to the deeper depth and the gas leaving thebubbles would add to the gas load in solution. When the previous excursion has lasted 8hours and the second excursion is to the same depth, for the same time, the gas load at the endof the second excursion, in all except the slowest tissues, is the same as that for the firstexcursion because most tissues are saturated by an 8 hour excursion. The exception is theslowest tissue, the fat. The first 8 hour excursion brings this tissue to 99.81% saturationwhereas the addition of the remaining gas load to the uptake of the second excursion brings itto 99.96% saturation. This results in an increase in gas in bubbles, following the secondexcursion, of less than 0.02%The difference between first and second excursions, the risk of build up of gas as the numberof excursions increase, would be greater than quoted above if the excursion duration were lessthan 8 hours. However the gas levels can only increase to saturation so the gas in bubbles willnot go above the values quoted in this report by more than 0.02%.3.5EFFECT OF FINAL DECOMPRESSIONIn section 2.2 it was stated that in the average diver the decompression from saturation willnot cause bubbles to form. From section 2.3 it is apparent that the bubbles formed followingexcursions, as quoted in the tables above, do not reach levels in the average diver which might12
cause DCI. Cases of DCI do occur in saturation diving and according to Jacobsen et al (1997)the incidence relates to the number of depth changes undertaken by the individual.Table 6 shows that gas bubbles can continue for over 24 hours after many excursions andtherefore the decompression is likely to be started with bubbles present. These bubbles willsimply expand as the pressure is reduced no matter how small they were at the start of thedecompression. Whether or not the bubbles persist throughout the decompression isdependent on the rate at which the blood flow through the tissue can remove the gas from thebubbles compared to the rate of change of pressure. If the blood flow is not sufficient toremove enough gas to limit the volume increase as the pressure falls then bubbles will growthroughout the whole decompression.The effect of the final decompression has been studied for three depths, 180, 120 and 60 msw.The decompression has been started following holds of 6, 12 or 24 hours and the return fromthe excursion was carried out at 10 msw/min. Table 7 gives the maximum volume of gas inbubbles (µl/ml) in the central venous blood. For some combinations of excursion anddecompression the maximum gas in bubbles occurs on return to surface, for others it occursearlier as the rate of removal of inert gas by the blood surpasses the effect of the pressuredecrease. In Table 7 the * indicates where the maximum volume of gas in bubbles occursbefore the end of decompression. For these results the value given in brackets is the depth(msw) at which the maximum occurs. Blank cells indicate both excursions which produced nobubbles and excursions for which the bubbles were resolved during the hold prior to the startof decompression.TABLE 7 Maximum PA gas in bubble
decompression illness (DCI) and the pressure profile of 2,622 saturation dives in the Norwegian sector between 1983 and 1990. They concluded that there was a positive relationship between DCI rate and the number of depth changes during the saturation period. A common form of depth change is an excursion, to allow divers to work at depths different