Transcription
Capital One Securities, Inc.Alan R. CurtisSVP and Chief Financial OfficerOceaneering International, Inc.Safe Harbor StatementStatements we make in this presentation that express abelief, expectation, or intention are forward looking.Forward-looking statements are generally accompanied bywords such as “estimate,” “project,” “predict,” “believe,”“expect,” “anticipate,” “plan,” “forecast,” “budget,” “goal,” orother words that convey the uncertainly of future events oroutcomes. These forward-looking statements are based onour current information and expectations that involve anumber of risks, uncertainties, and assumptions. Among thefactors that could cause the actual results to differ materiallyfrom those indicated in the forward-looking statements are:industry conditions, prices of crude oil and natural gas, ourability to obtain and the timing of new projects,projects and changesin competitive factors. Should one or more of these risks oruncertainties materialize, or should the assumptionsunderlying the forward-looking statements prove incorrect,actual outcomes could vary materially from those indicated.gg these and other factors,,For additional information regardingsee our periodic filings with the Securities and ExchangeCommission, including our most recent Reports on Forms10-K and 10-Q.10th Annual Energy ConferenceDecember 9, 2015New Orleans, LA
OII in the Offshore Oilfield Life SIONING#1 MarketDriver# of OperatingFloating Drilling Rigs# Subsea TreeInstallations# Subsea TreesIn Service# of FieldAbandonmentsBusinessSegmentP d tProductandServiceRevenueStreams ROV Survey (SP) Tooling (SSP) ROV Remotely Operated VehiclesROVSurvey (SP)Tooling (SSP)IWOCS – Installation &Workover Control Systems(SSP)Subsea Hardware (SSP)Umbilicals (SSP)Vessel--based InstallationVesselServices (SP)IInspectionti ServicesS i(AI)SSP Subsea Products ROVTooling (SSP)IWOCS (SSP)Subsea Hardware (SSP)Vessel--based Inspection,VesselMaintenance & RepairServices (SP) Inspection Services (AI)SP Subsea Projects ROV Tooling (SSP) IWOCS (SSP)AI Asset Integrity
OII Offshore Life Cycle Business ExposureRevenue Mix5%15%25%55%ExplorationSource: OII EstimatesDevelopmentProductionDecommissioning
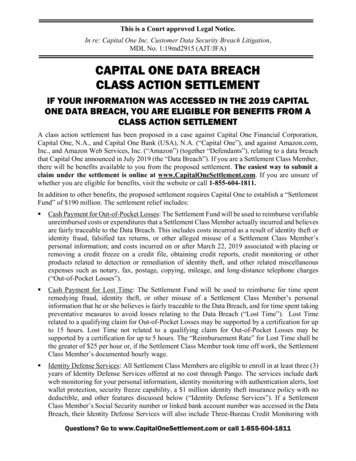
Earnings Per Share Guidance2015 Estimate 2 2.6060 to 2 2.6666ActualLow EstimateHigh EstimateEarnings per Share 5.00 4.00 3.00 2 00 2.00 1.00 0.00200820092010OII 2015 Guidance Range as of October 28, 201520112012201320142015E
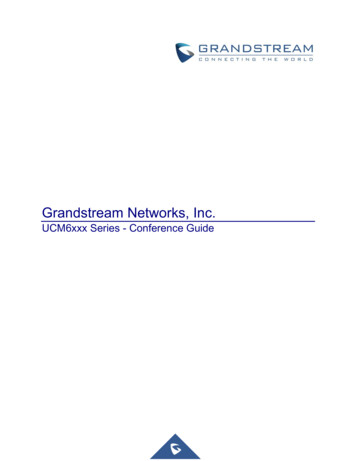
Relative EPS PerformanceTo 2008 OSX PeakOIIOSX w/o OII150%125%Relative to:2008 Up 55%2014 Down 30%100%75%50%25%0%Relative to:2008 Down 55%2014 Down 40%-25%-50%-75%20082009201020112012Based on First Call Actual and Mean Estimates as of October 30, 2015201320142015E
Cost-Cutting Initiatives Partnering with Customers and Suppliers to FindCost Effective Solutions Right-Sizing Workforce Reducing Training Expenses Obtaining Supplier Price Concessions Reducing Incentive & Deferred Compensation Lowering Organic CAPEX
Segment OutlookQ4 2015SEGMENT OPERATING INCOMEROV Q3Subsea Products Q3Subsea Projects Q3Asset Integrity Q3Advanced Technologies Q3Unallocated Expenses Q3
2015 Capital Sources & AllocationsCurrent Sources CashC h att SeptS t 30,30 2015– 271 MM Estimated 2015 EBITDA– 640 MM Bank Revolver– 500 MM UndrawnPotential Allocations OrganicOi CapC EEx– 200 MM to 250 MM Acquisitions– 230 MM & More Cash Dividends– 108 MM Share Repurchases– 101 MM TBD
Strong Free Cash Flow in millions2015YTD*YTDNet Income for the Period 204Cash Flows from Operating ActivitiesP hPurchasesoff PropertyPt andd EquipmentE it 373(139)Free Cash Flow 234Free Cash Flow as % of Net Income115%*Through September 30, 2015
2016 Earnings Outlook Less Than 2015 Projected Earnings– Additional Customer Spending Cuts Reductions in Offshore Activities, includingFewer Contracted Floating Rigs
Long Term: Offshore is EssentialDeepwater Remains Significant90Incremental BblsExisting Fields BblsSource ofAdditional 29Mm B/DCrude ProductionCrude andd CondensateeMMMB/D804.319 359.35706050404.743.37.29Ultra DeepwaterDDeepwatertShelfUS ShaleConventional LandSource: Morgan Stanley Research , Wood Mackenzie, Rystad Energy, and Company Data – June 2015
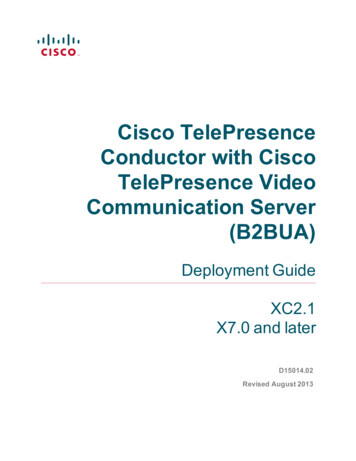
Offshore Final Investment Decisions (FIDs)Expected Capital Expenditure Approvals in billions 400 350 300 250 200 150 100 50 0201020112012Approved Producing2013201420152016Approved DevelopmentSource: Rystad Energy, Morgan Stanley Research – July 6, 2015201720182019Pending Approval2020
OII Summary Challenging Time– Well Positioned for Inevitable Rebound Intend to Continue Investing for the Future& Returning Capital to Our Shareholders Deepwater Focus Remains Sound– Long-Term Prospects Are Promising
Supplemental Financial Information
EBITDAin millionsActualLow Estimate 1,000 900 800 700 600 500 400 300 200 100 0* 2015 - 640 MM- 660 MMBased on OII EPS Guidance as of October 28, 2015See Next Slide For Non-GAAP Reconciliation to Net IncomeHigh Estimate
EBITDA Reconciliation to Net IncomeEarnings before interest, taxes, depreciation and amortization (EBITDA) is a non-GAAP financial measurement.Oceaneering’s management uses EBITDA because we believe that this measurement is a widely accepted financialindicator used by investors and analysts to analyze and compare companies on the basis of operating performance,and that this measurement may be used by some investors and others to make informed investment decisions. Youshould not consider EBITDA in isolation from or as a substitute for net income or cash flow measures prepared inaccordance with generally accepted accounting principles or as a measure of profitability or liquidity. EBITDAcalculations by one company may not be comparable to EBITDA calculations made by another company. Thefollowing table provides a reconciliation between net income (a GAAP financial measure) and EBITDA (a non-GAAPfinancial measure) for Oceaneering’s historical and projected results on a consolidated basis for the periods indicated:Period Ended December 31,(in millions of )201020112012 2013 20142015E 2015ELOW HIGHNet Income200.5 235.7 289.0 371.5 428.3255265Depreciation & Amortization153.7 151.2 176.5 202.2 229.8245250Subtotal354.2 386.9 465.5 573.7 658.15005154.42525Income Tax Expense104.7 102.2 132.9 170.8 195.1115120EBITDA464.3 489.3 600.7 746.2 857.7640660Interest Expense/Income, Net5.4.22.31.6
Free Cash Flow“Free Cash Flow” (FCF) is a non-GAAP financial measurement. FCF represents cashflow from operations less organic capital expenditures (i.e., capital expendituresexcluding those for business acquisitions or other investments). Management believesthat this is an important measure because it represents funds available to pursueopportunities that enhance shareholder value such as making acquisitions or otherinvestments, and returning cash to owners through share repurchases and dividends, orto reduce debt.
Business SegmentsRevenueOperating Income4% 3%11%27%12%19%41%20%30%September YTD 201533%ROVSubsea ProductsSubsea ProjectsAsset IntegrityAdtech
Supplemental Market Information
Rig Fleet, Non-PBR Brazilat September 30,30 2015 173 Rigs Under Contract OII on 65% OII on 75% of Drillships/6th Gen Rigs 47 Rigs On Order 8 Rigs Have Operator Contracts– 7 ROV Contracts - OII– 1 ROV Contract - Competitor 39 Rigs Do Not Have Operator ContractsSource: IHS-Petrodata Data & OII Estimates, September 30, 2015
Yeear-End Coontracted Flloating RigssFloating Rig Demand History300275250200150100Source: IHS-PetrodataDemand at Sept 30, 2015 - 222
Leading Market PositionRemotely Operated VehiclesOwnershipDrill Support Market ShareOII - 33636%Worldwide Fleet937 Vehicles*OII – 12757%222 Floating Rigs Contracted**Source: *OII Estimates - December 2014; **IHS Petrodata – September 2015
Oilfield ROV FleetOwnershipDrill Support Market ShareOII – 33636%Worldwide Fleet937 VehiclesVehicles*OII – 12757%OIISubsea 7FugroDOF oating Rigs Contracted**Source: *OII Estimates - December 2014; **IHS Petrodata and OII Estimates – September 30, 2015
OII ROV FleetGeographicg pProfile – 7 VehiclesAsia/PacOther
OII ROVs on 24GOMAfricaNorwayAsiaOther97 VehiclesOperatorsContractors
OII ROV Pricing and Fleet UtilizationRevenue / Day on HireFleet Utilization 11,000100% 9,00090% 7,00080% 5 000 5,00070% 3,00060% 1,00050%* September YTD
Leading Market PositionSpecialty Subsea ProductsUmbilicalsTooling &Subsea Work SystemsInstallation andWorkover ControlSystemsSubsea Hardware
Subsea Products BacklogAt Period Endin millions 1,000 800 600 400 200 02009*September 2015201020112012201320142015*
Oilfield ROV Fleet Ownership Drill Support Market Share OII - 127 57% OII - 336 36% OII Subsea 7 Fugro DOF Subsea Saipem C-Innovations Helix Technip TMT Other Worldwide Fleet 937 Vehicles* 222 Floating Rigs Contracted** 937 Vehicles Source: *OII Estimates - December 2014; **IHS Petrodata and OII Estimates - September 30, 2015