Transcription
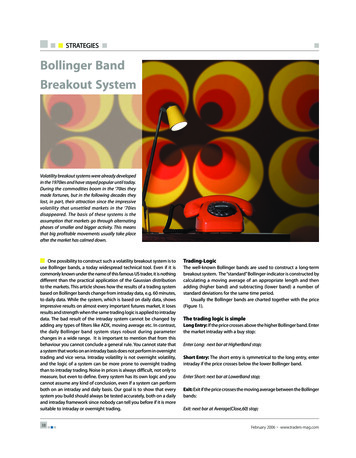
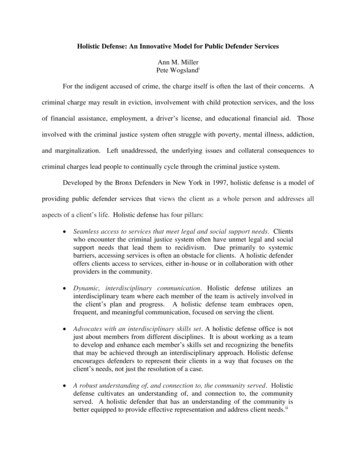
BOLLINGER BANDS - The methods as explained by John Bollinger in his book , Bollinger on Bollinger BandsINTRODUCTIONTrading bands, which are lines plotted in and around the price structure to form an envelope, are the action of prices near theedges of the envelope that we are interested in. They are one of the most powerful concepts available to the technically basedinvestor, but they do not, as is commonly believed, give absolute buy and sell signals based on price touching the bands. Whatthey do is answer the perennial question of whether prices are high or low on a relative basis. Armed with this information, anintelligent investor can make buy and sell decisions by using indicators to confirm price action.But before we begin, we need a definition of what we are dealing with. Trading bands are lines plotted in and around the pricestructure to form an "envelope." It is the action of prices near the edges of the envelope that we are particularly interested in.The earliest reference to trading bands I have come across in technical literature is in The Profit Magic of Stock TransactionTiming; author J.M. Hurst's approach involved the drawing of smoothed envelopes around price to aid in cycle identification.Figure 1 shows an example of this technique: Note in particular the use of different envelopes for cycles of differing lengths.The next major development in the idea of trading bands came in the mid to late 1970s, as the concept of shifting a movingaverage up and down by a certain number of points or a fixed percentage to obtain an envelope around price gained popularity,an approach that is still employed by many. A good example appears in Figure 2, where an envelope has been constructedaround the Dow Jones Industrial Average (DJIA). The average used is a 21-day simple moving average. The bands are shiftedup and down by 4%.FIGURE 2:
The procedure to create such a chart is straightforward. First, calculate and plot the desired average. Then calculate the upperband by multiplying the average by 1 plus the chosen percent (1 0.04 1.04). Next, calculate the lower band by multiplyingthe average by the difference between 1 and the chosen percent (1 - 0.04 0.96). Finally, plot the two bands. For the DJIA,the two most popular averages are the 20- and 21-day averages and the most popular percentages are in the 3.5 to 4.0 range.The next major innovation came from Marc Chaikin of Bomar Securities who, in attempting to find some way to have themarket set the band widths rather than the intuitive or random-choice approach used before, suggested that the bands beconstructed to contain a fixed percentage of the data over the past year. Figure 3 depicts this powerful and still very usefulapproach. He stuck with the 21-day average and suggested that the bands ought to contain 85% of the data. Thus, the bandsare shifted up 3% and down by 2%. Bomar bands were the result. The width of the bands is different for the upper andlower bands. In a sustained bull move, the upper band width will expand and the lower band width will contract. Theopposite holds true in a bear market. Not only does the total band width change across time, the displacement around theaverage changes as well.FIGURE 3:BOLLINGER’S BRAINSTORMAsking the market what is happening is always a better approach than telling the market what to do. In the late 1970s, whiletrading warrants and options and in the early 1980s, when index option trading started, I focused on volatility as the keyvariable. To volatility, then, I turned again to create my own approach to trading bands. I tested any number of volatilitymeasures before selecting standard deviation as the method by which to set band width. I became especially interested instandard deviation because of its sensitivity to extreme deviations. As a result, Bollinger Bands are extremely quick to react tolarge moves in the market.
In Figure 5, Bollinger Bands are plotted two standard deviations above and below a 20-day simple moving average. The dataused to calculate the standard deviation are the same data as those used for the simple moving average. In essence, you areusing moving standard deviations to plot bands around a moving average. The time frame for the calculations is such that it isdescriptive of the intermediate-term trend.Note that many reversals occur near the bands and that the average provides support and resistance in many cases.There is great value in considering different measures of price. The typical price, (high low close)/3, is one such measurethat I have found to be useful. The weighted close, (high low close close)/4, is another. To maintain clarity, I willconfine my discussion of trading bands to the use of closing prices for the construction of bands. My primary focus is on theintermediate term, but short- and long-term applications work just as well. Focusing on the intermediate trend gives onerecourse to the short- and long-term arenas for reference, an invaluable conceptFor the stock market and individual stocks. a 20-day period is optimal for calculating Bollinger Bands. It is descriptive of theintermediate-term trend and has achieved wide acceptance. The short-term trend seems well served by the 10-day calculationsand the long-term trend by 50-day calculations.The average that is selected should be descriptive of the chosen time frame. This is almost always a different average lengththan the one that proves most useful for crossover buys and sells. The easiest way to identify the proper average is to chooseone that provides support to the correction of the first move up off a bottom. If the average is penetrated by the correction,then the average is too short. If, in turn, the correction falls short of the average, then the average is too long. An average thatis correctly chosen will provide support far more often than it is broken. (See Figure 6.)
Bollinger Bands can be applied to virtually any market or security. For all markets and issues, I would use a 20-daycalculation period as a starting point and only stray from it when the circumstances compel me to do so. As you lengthen thenumber of periods involved, you need to increase the number of standard deviations employed. At 50 periods, two and a halfstandard deviations are a good selection, while at 10 periods one and a half do the job quite well.50 periods with 2.5 standard deviation10 periods with 1.5 standard deviationUpper Band 50-day SMA 2.5(s)Middle Band 50-day SMALower Band 50-day SMA - 2.5(s)Upper Band 10-day SMA 1.5(s)Middle Band 10-day SMALower Band 10-day SMA - 1.5(s)In most cases, the nature of the periods is immaterial; all seem to respond to correctly specified Bollinger Bands. I have usedthem on monthly and quarterly data, and I know many traders apply them on an intraday basis.ANSWERING THE QUESTIONSTrading bands answer the question whether prices are high or low on a relative basis. The matter actually centers on the phrase"a relative basis." Trading bands do not give absolute buy and sell signals simply by having been touched; rather, they providea framework within which price may be related to indicators.Some older work stated that deviation from a trend as measured by standard deviation from a moving average was used todetermine extreme overbought and oversold states. But I recommend the use of trading bands as the generation of buy, selland continuation signals through the comparison of an additional indicator to the action of price within the bands.If price tags the upper band and indicator action confirms it, no sell signal is generated. On the other hand, if price tags theupper band and indicator action does not confirm (that is, it diverges). we have a sell signal. The first situation is not a sellsignal; instead, it is a continuation signal if a buy signal was in effect.It is also possible to generate signals from price action within the bands alone. A top (chart formation) formed outside thebands followed by a second top inside the bands constitutes a sell signal. There is no requirement for the second top's positionrelative to the first top, only relative to the bands. This often helps in spotting tops where the second push goes to a nominalnew high. Of course, the converse is true for lows.INTRODUCING %B AND BANDWIDTHAn indicator derived from Bollinger Bands that I call %b can be of great help, using the same formula that George Lane usedfor stochastics. The indicator %b tells us where we are within the bands. Unlike stochastics, which are bounded by 0 and 100,%b can assume negative values and values above 100 when prices are outside of the bands. At 100 we are at the upper band, at0 we are at the lower band. Above 100 we are above the upper bands and below 0 we are below the lower band. See Figure 7for the exact formula.Indicator %b lets us compare price action to indicator action. On a big push down, suppose we get to -20 for %b and 35 forrelative strength index (RSI). On the next push down to slightly lower price levels (after a rally), %b only falls to 10, whileRSI stops at 40. We get a buy signal caused by price action within the bands. (The first low came outside of the bands, while
the second low was made inside the bands.) The buy signal is confirmed by RSI, as it did not make a new low, thus giving us aconfirmed buy signal.Trading bands and indicators are both good tools, but when they are combined, the resultant approach to the markets becomespowerful. Band width, another indicator derived from Bollinger Bands, may also interest traders. It is the width of the bandsexpressed as a percent of the moving average. When the bands narrow drastically, a sharp expansion in volatility usuallyoccurs in the very near future. For example, a drop in band width below 2% for the Standard & Poor's 500 has led tospectacular moves. The market most often starts off in the wrong direction after the bands tighten prior to really getting underway, of which January 1991 is a good example (Figure 9).FIGURE 9:AVOIDING MULTIPLE COUNTINGA cardinal rule for the successful use of technical analysis requires avoiding multicolinearity amid indicators. Multicolinearityis simply the multiple counting of the same information. The use of four different indicators all derived from the same seriesof closing prices to confirm each other is a perfect example.So one indicator derived from closing prices, another from volume and the last from price range would provide a useful groupof indicators. But combining RSI, moving average convergence/divergence (MACD) and rate of change (assuming all werederived from closing prices and used similar time spans) would not. Here are, however, three indicators to use with bands togenerate buys and sells without running into problems. Amid indicators derived from price alone, RSI is a good choice.Closing prices and volume combine to produce on-balance volume, another good choice. Finally, price range and volumecombine to produce money flow, again a good choice. None is too highly colinear and thus together combine for a goodgrouping of technical tools. Many others could have been chosen as well: MACD could be substituted for RSI, for example.The Commodity Channel Index (CCI) was an early choice to use with the bands, but as it turned out, it was a poor one, as ittends to be colinear with the bands themselves in certain time frames. The bottom line is to compare price action within thebands to the action of an indicator you know well. For confirmation of signals, you can then compare the action of anotherindicator, as long as it is not colinear with the first.BASIC RULESOne of the great joys of having invented an analytical technique such as Bollinger Bands is seeing what other people do withit. While there are many ways to use Bollinger Bands, following are a few rules that serve as a good beginning point. Bollinger Bands provide a relative definition of high and low.That relative definition can be used to compare price action and indicator action to arrive at rigorous buy and selldecisions.Appropriate indicators can be derived from momentum, volume, sentiment, open interest, inter-market data, etc.Volatility and trend have already been deployed in the construction of Bollinger Bands, so their use forconfirmation of price action is not recommended.The indicators used for confirmation should not be directly related to one another. Two indicators from the samecategory do not increase confirmation. Avoid colinearity.
Bollinger Bands can also be used to clarify pure price patterns such as M-type; tops and W-type bottoms,momentum shifts, etc.Price can, and does, walk up the upper Bollinger Band and down the lower Bollinger Band.Closes outside the Bollinger Bands can be continuation signals, not reversal signals--as is demonstrated by the useof Bollinger Bands in some very successful volatility-breakout systems.The default parameters of 20 periods for the moving average and standard deviation calculations, and two standarddeviations for the bandwidth are just that, defaults. The actual parameters needed for any given market/task may bedifferent.The average deployed should not be the best one for crossovers. Rather, it should be descriptive of the intermediateterm trend.If the average is lengthened the number of standard deviations needs to be increased simultaneously; from 2 at 20periods, to 2.1 at 50 periods. Likewise, if the average is shortened the number of standard deviations should bereduced; from 2 at 20 periods, to 1.9 at 10 periods.Bollinger Bands are based upon a simple moving average. This is because a simple moving average is used in thestandard deviation calculation and we wish to be logically consistent.Be careful about making statistical assumptions based on the use of the standard deviation calculation in theconstruction of the bands. The sample size in most deployments of Bollinger Bands is too small for statisticalsignificance and the dist
Bollinger Bands can be applied to virtually any market or security. For all markets and issues, I would use a 20-day calculation period as a starting point and only stray from it when the circumstances compel me to do so. As you lengthen the number of periods involved, you need to increase the number of standard deviations employed. At 50 periods, two and a half standard deviations are a good .