Transcription
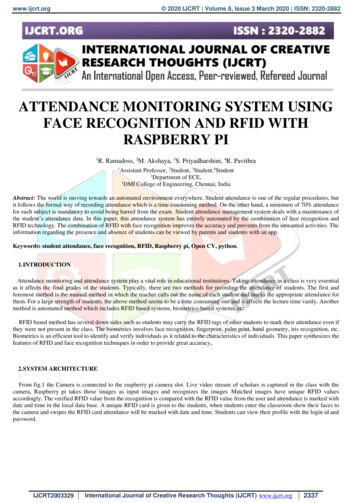
IOSR Journal of Research & Method in Education (IOSR-JRME)e-ISSN: 2320–7388,p-ISSN: 2320–737X Volume 4, Issue 4 Ver. III (Jul-Aug. 2014), PP 23-31www.iosrjournals.orgData Monitoring of Student Attendance at Bina NusantaraUniversity Using Control ChartsHeruna Tanty1; Anita Rahayu21,2Department of Statistics, Bina Nusantara University, JakartaAbstract: The need of data monitoring of student attendance by tapping on the machine Radio FrequencyIdentification (RFID) provides several advantages. But sometimes there are some students do not attend classafter tapping. It is a problem faced by university because of the lack of correspondence between the numbers ofstudents who are tapping the number of students who attend class. Because of these problems, then conductedresearch on monitoring of correspondence between the number of students tapping on RFID machine with thenumber of students who attend class. In addition, from the observed data, can also be used to monitor theattendance of students at Bina Nusantara university using control charts. The long-term goal of this research isto reduce the level of fraud and monitor the attendance of students in class. The sample in this study are 04PHT(Computer Science), 04 PJM (Information Systems), 02 PBS (Civil Engineering), 02 PEU (Graphic Design NewMedia), and 04 PBO (Marketing Communication). From this research results, concluded that the p controlchart, for the absence of the characteristic number of students in the fifth classes under controlled conditions.Furthermore, concluded also that the p control chart, to characteristic number of students cheating in class 04PHT courses basic communication networks and systems of data under controlled conditions. A process is saidto be controlled if the value is within the interval statistics UCL (Upper Control Limit) and LCL (Lower ControlLimit).Keywords: attendance, control charts, descriptive statistics, monitoring, radio frequency identificationI.IntroductionAttendance is one measure whether a lecture in accordance with properly or not. The attendance ofstudents determines if they are actively following the lecture or not. Even in some institutions, studentattendance determines whether they are eligible to take the test or not.Recording and monitoring of student attendance in lectures is one of the activities that can beimplemented using information technology. In the field of education, information technology plays a role inteaching methods, learning tools, competency standards, decision support system, educational facilities,educational management tools, and educational infrastructure [1]. Attendance information system allows usersto record its attendance in the system. One of the information technologies that can be used is by using RadioFrequency Identification (RFID). Recording the attendance data using RFID has advantages, the data recordingprocess easy and student attendance information that can be monitored in real time. Another advantage is theease of the services available to monitor academic class’s filled and empty class.Not always have the advantage of information technology sophistication. Weakness recordingattendance data using RFID can be viewed in terms of monitoring. If faculty does not monitor thecorrespondence between the numbers of students tapping the number of students who attend class, there will bethe possibility of some students to commit fraud. Cheating they can do is not get in and did not follow thelectures in class after tapping. Therefore, to reduce the level of fraud on the student's attendance in class, then doresearch on monitoring student attendance data at Bina Nusantara University using a control chart. Control chartis a chart that provides an overview of the behavior of a process. Control chart is used to understand whether aprocess running in a controlled environment or not. Control chart is used are variable and attribute controlcharts. Variable control chart used to monitor the characteristics of student attendance, while the attributecontrol chart is used to monitor the characteristics of the number of students who commit fraud.II.Literature Study2.1 Control ChartsControl chart is one component of the seven tools in Statistical Quality Control (SQC) and is a chartthat provides an overview of the behavior of a process. Control chart is used to understand whether a processrunning in a controlled environment or not. A process that is fairly stable, but goes beyond the expected limits,should be repaired immediately to find the cause in order to get the fundamental improvement.www.iosrjournals.org23 Page
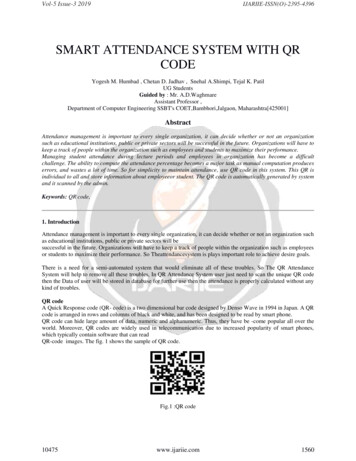
Data Monitoring Of Student Attendance At Bina Nusantara University Using Control ChartsFig 1. Example of Control ChartBased on the number of quality characteristics are measured, control chart is divided into two kinds,namely the univariate and multivariate control chart [3]. Univariate control chart is used if there is only onequality characteristics are measured, while the multivariate control chart is used if the use of two or more relatedquality characteristics together. Univariate control chart can be divided into two types, namely variable andattribute control charts.a. Variable Control ChartVariable control chart based on characteristics derived from measurement results. There are all types ofvariables control chart [2].(1) x and R control chartFormula UCL, CL, and LCL forxcontrol chart :UCL x A2 R(1)CL x(2)LCL x A2 R(3)Formula UCL, CL, and LCL for R control chart :UCL RD4(4)CL R(5)LCL RD3(6)(2) x and S control chartFormula UCL, CL, and LCL for x control chart :UCL x 3S(7)c4 nCL x(8)3SLCL x (9)c4 nFormula UCL, CL, and LCL for S control chart :UCL B4 S(10)CL S(11)LCL B3 S(12)b.Attribute Control ChartAttribute control chart based on characteristics derived from the calculation. There are all types ofattribute control chart [2].www.iosrjournals.org24 Page
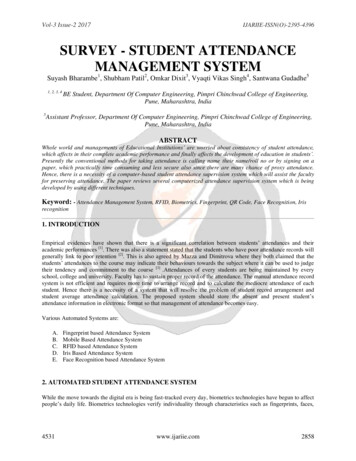
Data Monitoring Of Student Attendance At Bina Nusantara University Using Control Charts-p control chartUCL p 3 p1 pn (13)CL pLCL p 3 p1 pn(14) (15)III.Research MethodologyThe data used in this study is primary data obtained from observations between the number of studentstapping on RFID machines and the number of student’s attendance at Bina Nusantara University. The sampleused in this study is as much as 5 class, which consists of 04PHT (Computer Science), 04 PJM (InformationSystem), 02PBS (Civil Engineering), 02PEU (DKV New Media), and 04 PBO (Marketing Communication). Foreach class, data collection was done in three courses, and each course is done as much as 3 data collectionsessions. So the amount of data used in this study is a 3 x 3 x 5 45 data. There is a flow chart used in thisstudy.Fig 2. Flow Chart of ResearchIV.Research ResultsDetermination of the class that is used as a sample at Bina Nusantara University has five coursesconsisting of undergraduate programs, undergraduate programs (BINUS online learning), undergraduateprograms (double degree), undergraduate programs (international), and graduate programs (business school). Inthis study, using a program of undergraduate study programs, this is because these programs demand a lot morewhen compared with four other programs.Undergraduate programs have seven faculties where each faculty is composed of several departments.The total number of undergraduate majors in as many as 29 major programs. Here is a list of faculty and majorsfor undergraduate programs at Bina Nusantara University.Table 1. Faculty and Undergraduate Programs Department at Bina Nusantara UniversityNo.1.2.FacultyEconomics and AccountingFinanceMarketing communicationHotel managementArchitectural engineeringComputer engineeringCivil engineeringIndustrial enginneringwww.iosrjournals.org25 Page
Data Monitoring Of Student Attendance At Bina Nusantara University Using Control Charts3.School of Computer Science4.School of Design5.6.School of Business and ManagementSchool of Information 20.21.22.23.24.25.26.27.28.29.Mobile application and technologyGame application and technologyComputer scienceDouble degree in computer science and mathematicsDouble degree in computer science and statisticsDKV animationDKV creative advertisingDKV new mediaInterior designInternational business and managementAccounting information systemsComputerized accountingInformation systemInformation system auditDouble degree in information systems and accountingBusiness lawChina languageEnglish languageInternational relationsJapanese languagePsychologyTo determine the number of faculty that will be used as a sample, it can be used the following Slovin formula.n n N21 N in this study, N is the number of faculty and α is 0,2. So :71 7 0,2 2 777 51 7 0,04 1 0,28 1,28Based on the calculation above Slovin formula can be concluded that there is a faculty of sevenundergraduate programs at Bina Nusantara University, will be taken as samples 5 faculty research. Thedetermination of the faculty conducted by simple random sampling technique using a random number table,where each sample (in this case each faculty) has an equal chance of being drawn.Table 2. Five Faculties Selected Using Simple Random Sampling TechniquesNo.1.2.3.4.5.Number of Faculty0205010300FacultySchool of Computer ScienceSchool of Information SystemEngineeringSchool of DesignEconomics and CommunicationBased on Table 2., it can be concluded that the five faculties which will be used as the sample in thisstudy is the school of computer science faculty, school of information systems, engineering, school of design,and the faculty of economics and communications. The faculty of each sample will be taken, namely the majors.The number of courses that are taken from any one department faculty. So in this study the total sample to beused is five majors.Table 3. Five Departments Selected Using Simple Random Sampling TechniquesNo.1.2.3.4.5.FacultySchool of Computer ScienceSchool of Information SystemEngineeringSchool of DesignEconomics and CommunicationNumber of Department0000000000DepartmentComputer ScienceInformation SystemCivil engineeringDKV New MediaMarketing CommunicationOn Table 3., seen that there are five departments that will be used the samples in this study, there aredepartment of computer science, information systems, civil engineering, DKV new media, and marketingcommunication. Because there are many majors in the class, then only selected one class for each department.Making the class as a sample with nonprobability sampling technique.Table 4. Five Classes Selected Using Nonprobability Sampling TechniqueNo.1.2.3.4.5.DepartmentComputer ScienceInformation SystemCivil engineeringDKV New MediaMarketing Communicationwww.iosrjournals.orgClass04 PHT04 PJM02 PBS02 PEU04 PBO26 Page
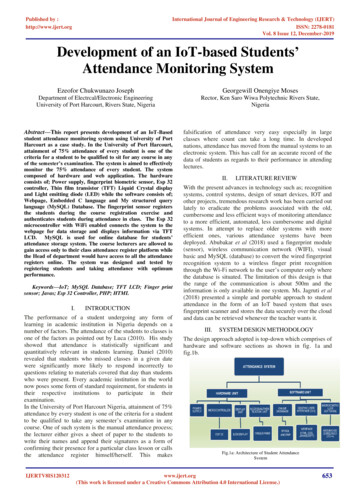
Data Monitoring Of Student Attendance At Bina Nusantara University Using Control ChartsIn this study, three subjects used for each class with each course there are 3 meetings. So as much asthe total data used: 3 x 3 x 5 45 data.4.1 Descriptive StatisticsThe goal of descriptive statistics is to find a picture of the number of active students, the number ofstudents attendance in the class, and the number of students in class tapping. Descriptive statistics were used inthe form of tables and bar charts. There are the descriptive statistics the number of active students using SPSSsoftware.Table 5. Descriptive Statistics for the Number of Active StudentsDEPARTMENT1Computer Science231DKV New Media231Information System231Marketing Communication 231Civil Engineering23THE NUMBER OF ACTIVE STUDENTS696969494748646664494949262624Beside the descriptive statistics for the number of active students, can be also display descriptivestatistics for the number of students attendance in the class and number of students tapping on machine RFID, soit can be seen the number of students who are not tapping and the number of students who commit fraudbecause the students tapping on machine RFID but not attendance in the class.(a)(b)(c)(d)www.iosrjournals.org27 Page
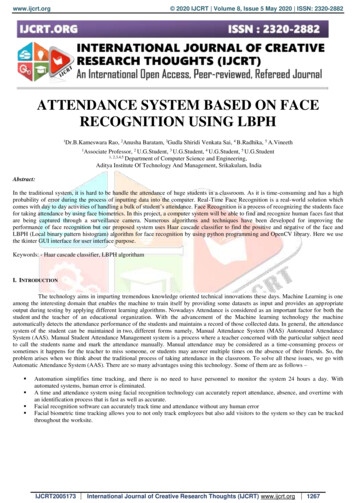
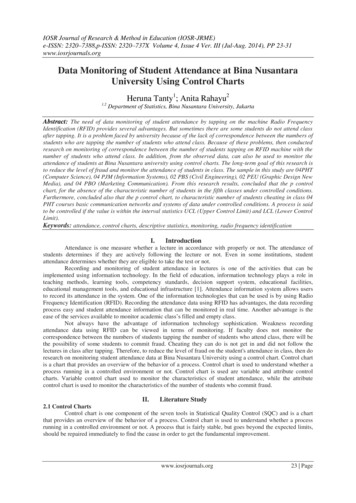
Data Monitoring Of Student Attendance At Bina Nusantara University Using Control Charts(e)Fig 3. Bar Chart for Number of Students Tapping (blue) and Attendance in Class (Green)(a) Class of 04PHT, (b) Class of 04PJM, (c) Class of 02PBS (d) Class of 02PEU, and (e) Class of 04PBOBased on Fig 3., if the blue color of bar is higher than the green color of bar, it means that in the classon a particular subject and meeting a lot of students who commit fraud, meaning that the students tapping onmachine RFID but not to be present in the class.So it appears that the class of cheating, in terms of the number of students in class tapping but notpresent in the class is the class of 04 PHT. There are 5 students who commit fraud in 2 subjects (communicationnetwork) meeting to-1 and there are 3 students who commit fraud in 2 subjects (communication network) 3rdmeeting. In addition there are three students who commit fraud on the 3rd course (basic system data) meeting1st and 2nd, and there are 4 students who commit fraud on the 3rd course (basic system data) at a meeting to-3.4.2 Data Monitoring of Student Absence Using p Control Chartp control chart is used to monitor a characteristic that can be calculated. In this study, thecharacteristics of which can be counted is the number of student absences, which can be calculated by thenumber of active students subtracted the number of students who attend class. There are calculations of theUCL, CL, and LCL for each class using p control chart with Minitab software [4].p Control Chart Course 1p Control Chart Course 20,200,25UCL 0,2316UCL 0,18130,20Proportion0,10P 0,08210,15P 0,11590,100,050,050,00LCL 012Sample0,003LCL 0,000312Sample3p Control Chart Course 30,18UCL 0,17370,160,140,12ProportionProportion0,150,10P 0,07730,080,060,040,020,00LCL 012Sample3Fig 4. p Control Chart for Absence Characteristics in Class of 04PHTwww.iosrjournals.org28 Page
Data Monitoring Of Student Attendance At Bina Nusantara University Using Control Chartsp Control Chart Course 2p Control Chart Course 10,450,5UCL 0,46820,35Proportion0,4ProportionUCL 0,41910,40P 0,29690,30,30P 0,25760,250,200,20,150,10LCL 0,1255LCL 0,09610,112Sample132Sample3p Control Chart Course 30,30UCL 0,29240,25Proportion0,20P 0,15630,150,100,05LCL 0,02010,0012Sample3Fig 5. p Control Chart for Absence Characteristics in Class of 04PJMp Control Chart Course 2p Control Chart Course 10,200,30UCL 0,2811UCL 0,18110,250,15Proportion0,15P 0,10260,100,10P 0,05130,050,050,000,00LCL 012SampleLCL 0132Sample3p Control Chart Course 30,30UCL 0,27860,250,20ProportionProportion0,200,15P 0,09720,100,050,00LCL 012Sample3Fig 6. p Control Chart for Absence Characteristics in Class of 02PBSwww.iosrjournals.org29 Page
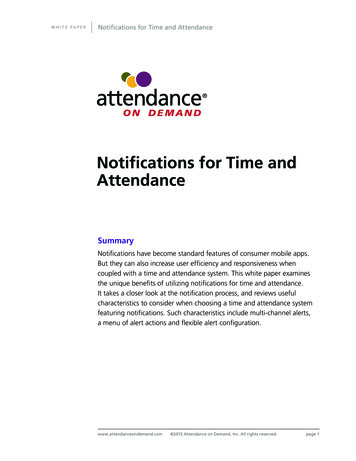
Data Monitoring Of Student Attendance At Bina Nusantara University Using Control Chartsp Control Chart Course 1p Control Chart Course 20,140,50UCL 0,12560,120,25ProportionProportion0,100,080,06P 0,04080,04LCL 0UCL 0P 00,00-0,250,020,00LCL 012Sample-0,50312Sample3p Control Chart Course 30,50Proportion0,25LCL 0UCL 0P 00,00-0,25-0,5012Sample3Fig 7. p Control Chart for Absence Characteristics in Class of 02PEUp Control Chart Course 2p Control Chart Course 10,25UCL 0,2423UCL 0,21010,200,20ProportionProportion0,150,15P 0,10880,100,10P 0,08840,050,050,000,00LCL 012SampleLCL 0132Sample3p Control Chart Course 30,20UCL 0,1876Proportion0,150,10P 0,07480,050,00LCL 012Sample3Fig 8. p Control Chart for Absence Characteristics in Class of 04PBOBased on Fig 4. until Fig 8. can be concluded that the p control chart, for absence characteristic in class04 PHT, 04 PJM, 02 PBS, 02 PEU, and 04 PBO is controlled conditions. This is indicated by the statisticalvalue (in this study are the average proportion between the number of students who do not present the number ofactive students) are in the interval UCL (Upper Control Limit) and LCL (Lower Control Limit).4.3 Data Monitoring Using p Control ChartIn this study, the p control chart used in addition to the characteristics of absence, can be also used forcheating characteristics. In this case it means cheating the students tapping on machine RFID but not present inthe class. Based on Fig 3. can be seen that the class that cheating is class of 04PHT, it can be shown with highwww.iosrjournals.org30 Page
Data Monitoring Of Student Attendance At Bina Nusantara University Using Control Chartsblue color bar chart (number of students in class tapping) is higher than the green color bar chart (number ofstudents present in class). The fraud occurred in the course communication network and basic system data.CommunicationCourseDiagram Pengendalip Kelas 04PHTNetworkMata KuliahJaringan KomunikasiBasicSystemof MataDataKuliahCourseDiagram Pengendalip Kelas04PHTSistem Basic Data0,120,14UCL 0,10830,100,06P 0,03860,040,02Proportion0,08ProportionUCL 0,12570,120,100,080,06P 0,04830,040,020,00LCL 012Sample30,00LCL 012Sample3Fig 9. p Control Chart for Class of 04PHTV.Conclusions And RecommendationsConclusions1. Based on the p control chart can be concluded that the characteristics of the number of absences for classof 04PHT, 04PJM, 02PBS, 02PEU, and 04PBO in controlled conditions (no observations were out ofcontrol).2. Based on the p control chart can be concluded that the fraud amount for characterizing the class of 04PHTstudents on network communications courses and basic system data in controlled conditions (noobservations were out of control).RecommendationsSome recommendations related to the results of this study are:1. When monitoring student attendance, need to do more research on the reasons for student cheating bytapping but not present in the class.2. As a follow-up to this study, the lecturer can give warning to students who commit fraud. As well aslecturers should provide penalties reminder to all students who commit fraud.3. To minimize the cheating student, it should be at every meeting, the lecturers always perform validation(match) between the number of students tapping and the number of students who attend class.References[1].[2].[3].[4].Bastian dan Reza A., Teknologi Informasi Pendidikan (Kedaulatan Rakyat, 2005).Montgomery, D.C., Introduction to Statistical Quality Control. 07 (John Wiley & Sons, Inc. , 2012). ISBN : 978-1118146811.Pattihahuan S., Setiawan A., dan Sasongko, L.R., Penerapan Grafik Pengendali Berdasarkan Estimasi Fungsi Densitas KernelBivariat (Program Studi Matematika, Fakultas Sains dan Matematika, Universitas Kristen Satya Wacana, 2012). ISBN : 978-97917763-5-6.Ryan B.F., Joiner B L., and Cryer J.D., Minitab Handbook. 06 (Cengage Learning, 2012). ISBN : 978-1133939443.www.iosrjournals.org31 Page
lectures in class after tapping. Therefore, to reduce the level of fraud on the student's attendance in class, then do research on monitoring student attendance data at Bina Nusantara University using a control chart. Control chart is a chart that provides an overview of the behavior of a process. Control chart is used to understand whether a