Transcription
Streaming Telemetry:Considerations & ChallengesMike Korshunov, TME @ Ciscomkorshun@cisco.com
Agenda1Brief Telemetry Overview2Closer Look at Telemetry Components3The Progress So Far4Final Thoughts
“Scream Stream If You Wanna Go Faster”Telemetry: an automated communications process by which measurements and other data are collected atremote or inaccessible points and transmitted to receiving equipment for Visibility erlefuData ibi nilesticBNGPeeringrouter
Telemetry EvolutionInitial FocusSystem /Control planeHardware /Data planeSNMPYANGCLIStep TwoFuture ideasBMPsyslog trapsNPU statssFlownetFlowINT
Agenda1Brief Telemetry Overview2Closer Look at Telemetry Components3The Progress So Far4Final Thoughts
Two Approaches for ModelsNative (Proprietary)ModelsOpenConfigModels
Pay Attention to DetailsCisco OC-NI yang
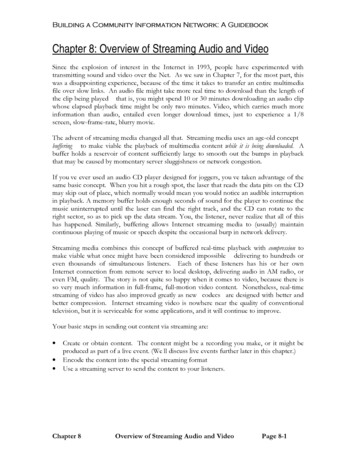
Check Deviations For Not Supported LeafsArista OC-NI Model tworkinstance/arista-netinst-deviations.yangCisco OC-NI Model ork-instance-deviations.yang
How to Select the Protocolssource: www.kisspng.comGRPCsource: www.novatoys.ruTCPsource: www.adventuremotorcycle.comUDP
TCP And UDP Are SimpleGood to knowif there is anadditionalheader inside
gRPC Comes With an Overhead Magic number tostart HTTP2 phaseSettings fromthe routerWindow sizefrom the routerHTTP2 detailsWindow size/settingsfrom the forethe datais streamed
But Brings Some Good BenefitsSpeedControl(from thecollector side)
Many Asked About SecuritygRPC Dial-in (NO-TLS)gRPC Dial-in (TLS)Password exchangePassword exchangeMessage contentMessage content
Is It Enough To State gRPC Support?Cisco gRPC call protoservice gRPCConfigOper {// Configuration related commandsrpc GetConfig(ConfigGetArgs) returns(stream ConfigGetReply) {};rpc MergeConfig(ConfigArgs) returns(ConfigReply) {};rpc DeleteConfig(ConfigArgs) returns(ConfigReply) {};rpc ReplaceConfig(ConfigArgs) returns(ConfigReply) {};rpc CliConfig(CliConfigArgs) returns(CliConfigReply) {};rpc CommitReplace(CommitReplaceArgs)returns (CommitReplaceReply) {};// Do we need implicit or explicit commitrpc CommitConfig(CommitArgs) returns(CommitReply) {};rpc scardChangesReply) {};// Get only returns oper datarpc GetOper(GetOperArgs) returns(stream GetOperReply) {};// Get Telemetry Datarpc CreateSubs(CreateSubsArgs) returns(stream ddy-network-telemetryproto/blob/master/staging/mdt grpc dialin/mdt grpc dialin.protoJuniper gRPC call protoservice OpenConfigTelemetry {// Request an inline subscription for data at the specified path.// The device should send telemetry data back on the same// connection as the subscription request.rpc telemetrySubscribe(SubscriptionRequest)returns (stream OpenConfigData) {}// Terminates and removes an exisiting telemetry subscriptionrpc est)returns (CancelSubscriptionReply) {}// Get the list of current telemetry subscriptions from the// target. This command returns a list of existing subscriptions// not including those that are established via configuration.rpc returns (GetSubscriptionsReply) {}// Get Telemetry Agent Operational Statesrpc quest)returns (GetOperationalStateReply) {}// Return the set of data encodings supported by the device for telemetryrpc getDataEncodings(DataEncodingRequest)returns (DataEncodingReply) lemetry/telemetry.proto
Which Encoding To hing binary (exceptvalues that are strings)String keys and binary values(except values that are strings)Everything strings: keys andvaluesWireEfficiencyOther ConsiderationsHighProto file per model. Extra Opscomplexity.Medium LowSingle .proto file for decodingheader.LowFriendly. Human readable, easyfor humans and code to parse
In Numbers?GPBMessage length: 330 bytesKV-GPBMessage length: 1142 bytesJSONMessage length: 1325 bytes
Agenda1Brief Telemetry Overview2Closer Look at Telemetry Components3The Progress So Far4Final Thoughts
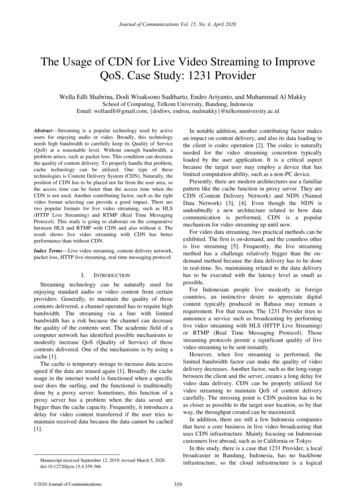
Design Your Transport Network Properly Peak bandwidth gRPCTCPUDP315k countersEvery 5 seconds
How Will Telemetry Fill Your Links?Large collections caseBandwidthMDT PeakTimeSmall collections caseBandwidthMDT PeakLonger Sample IntervalsShorter Sample IntervalsTime
Start Exploring Telemetry TodayGo With Open Source ToolsData BorderrouterHow to build up the 6-04-ios-xr-telemetry-collectionstack-intro
Is Your Collector Fast Enough?Decoded messages volumeMake sure the collector has enough power to process your telemetry data.
Is Your Hard Drive Write Speed Fast Enough?HDD-based server (SAS)SSD-based server (SAS)More about hard drives, DRAM and CPU for MDT -10-is-your-infra-ready-for-telemetry/
Don’t Forget To Set The Correct Time!RP/0/RP0/CPU0:ios-xr# sh clockSun Apr 1 20:56:15.074 PDT20:56:15.167 PDT Sun Apr 1 2019cisco@ubuntu51-1: dateSun Apr1 23:13:11 PDT 2019RP/0/RP0/CPU0:ios-xr#sh tele m subscription if-statsSun Apr 1 20:50:17.883 PDTSubscription: if-stats------------State:ACTIVEDSCP/Qos marked value: DefaultSensor groups:Id: if-statsSample Interval:5000 msSensor s/interfaces/interface[interface-name 'Bundle-Ether*']/latest/generic-countersSensor Path State:ResolvedDestination Groups:Group Id: DGroup1Destination IP:Destination f-describing-gpbgrpcActive
What To Think About Selecting a ata.com/https://prometheus.io/CategoryReal-time AnalyticsMonitoring SystemSupported MeasurementsHigh Availability (HA)Underlying TechnologyStorage Backendmetrics, eventsDouble writing 2 serversGolangCustommetricsDouble writing 2 serversGolangCustomSupported Data Typesint64, float64, bool, and stringfloat642.2nanosecondBytes per point aftercompressionMetric PrecisionWrite Performance - SingleNodeQuery Performance (1 host,12hr by 1m)Query LanguageCommunity l-time SearchReal-time Analyticsmetrics, eventsClusteringJavaDocumentstring, int32, int64, float32,float64, bool, nullmetricsClusteringJava, HadoopHadoop 470k metrics / sec (custom HW) 800k metrics / sec30k metrics / sec32k metrics /sec (calculated)3.78 ms (min), 8.17 (avg)tbd13.23 ms (min), 28.6 (avg)tbdInfluxQL (SQL like)largeStablePromQLlargeStableQuery DSLlargeStablelookup onlymediumstableFull table: https://tinyurl.com/jsd4esyGood to read: https://tinyurl.com/ybaw4ww6int64, float32, float64InfluxDB vs OpenTSDB: https://tinyurl.com/y8ofbjyyInfluxDB vs Cassandra: https://tinyurl.com/y83vv9ysDB ranking: https://tinyurl.com/ya8rrrjpInfluxDB vs Elasticsearch: https://tinyurl.com/y7yxjf6v
You Can See a Lot. In Real TimeReal-time BGP mapReal-time traffic loadRIB/FIB inconsistency check
sTelemetry For Optical Transceivers and Platformssensor-path deep-dive
Different Companies Are Starting To Be Involved
gNMI part of the Solution Network management interface defined by OpenConfig (mostly lead byGoogle) Configuration management and streaming telemetry in a single protocol Data model independent Based on Google RPC framework and HTTP/2The main goal for Telemetry is to provide a “standard” approach forencoding and transport protocols support across different vendors.
gNMI Implementation in Cisco IOS XR Telemetry MDT is based on gNMI v0.4.0 Introduced in release IOS XR 6.5.1 The only IOS XR Configuration needed:grpcport 10000 . 57999 TLS is enabled by default. To disable TLS:grpcno-tls
Agenda1Brief Telemetry Overview2Closer Look at Router3The Progress So far4Final Thoughts
Key Messages Streaming Telemetry is here for you.Start to receive benefits from it today! Select encoding and transport wisely. Good startfor beginners with Key-Value GPB & gRPC. It’s easy to explore. Scripts to bring up stackavailable. Should take less than 15 mins toprovision. Read for more materials:https://xrdocs.io/telemetry/
Have a Full Picture in Your jectionConfig / opermodelsgRPC NetworkManagementInterface(gNMI)gRPC NetworkOperationsInterface(gNOI)gRPC RoutingInformationBase try is just a piece of a puzzle
Thank you!Questions / Comments?Drop me a note: mkorshun@cisco.com
InfluxDB vs OpenTSDB: https://tinyurl.com/y8ofbjyy InfluxDB vs Cassandra: https://tinyurl.com/y83vv9ys DB ranking: https://tinyurl.com/ya8rrrjp InfluxDB vs Elasticsearch: https://tinyurl.com/y7yxjf6v

