Transcription
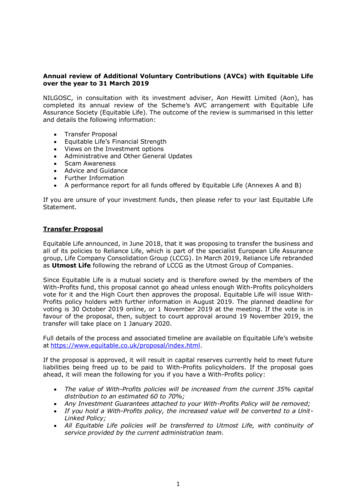
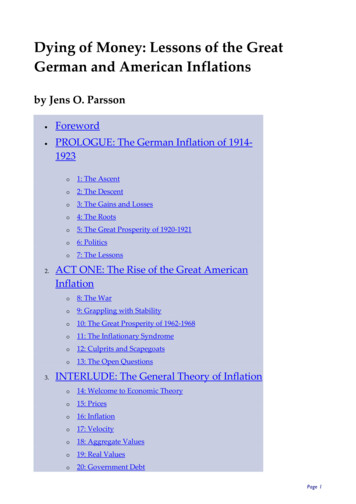
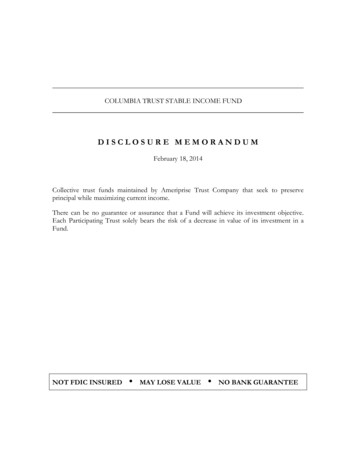
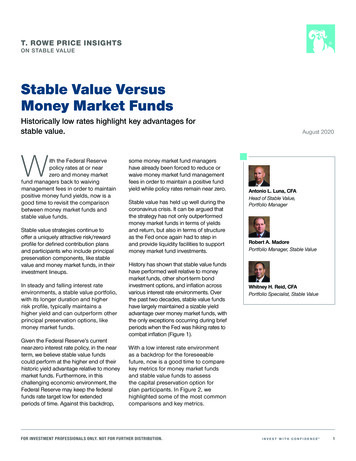
T. ROWE PRICE INSIGHTSON STABLE VALUEStable Value VersusMoney Market FundsHistorically low rates highlight key advantages forstable value.With the Federal Reservepolicy rates at or nearzero and money marketfund managers back to waivingmanagement fees in order to maintainpositive money fund yields, now is agood time to revisit the comparisonbetween money market funds andstable value funds.Stable value strategies continue tooffer a uniquely attractive risk/rewardprofile for defined contribution plansand participants who include principalpreservation components, like stablevalue and money market funds, in theirinvestment lineups.In steady and falling interest rateenvironments, a stable value portfolio,with its longer duration and higherrisk profile, typically maintains ahigher yield and can outperform otherprincipal preservation options, likemoney market funds.Given the Federal Reserve’s currentnear‑zero interest rate policy, in the nearterm, we believe stable value fundscould perform at the higher end of theirhistoric yield advantage relative to moneymarket funds. Furthermore, in thischallenging economic environment, theFederal Reserve may keep the federalfunds rate target low for extendedperiods of time. Against this backdrop,some money market fund managershave already been forced to reduce orwaive money market fund managementfees in order to maintain a positive fundyield while policy rates remain near zero.Stable value has held up well during thecoronavirus crisis. It can be argued thatthe strategy has not only outperformedmoney market funds in terms of yieldsand return, but also in terms of structureas the Fed once again had to step inand provide liquidity facilities to supportmoney market fund investments.History has shown that stable value fundshave performed well relative to moneymarket funds, other short‑term bondinvestment options, and inflation acrossvarious interest rate environments. Overthe past two decades, stable value fundshave largely maintained a sizable yieldadvantage over money market funds, withthe only exceptions occurring during briefperiods when the Fed was hiking rates tocombat inflation (Figure 1).August 2020Antonio L. Luna, CFAHead of Stable Value,Portfolio ManagerRobert A. MadorePortfolio Manager, Stable ValueWhitney H. Reid, CFAPortfolio Specialist, Stable ValueWith a low interest rate environmentas a backdrop for the foreseeablefuture, now is a good time to comparekey metrics for money market fundsand stable value funds to assessthe capital preservation option forplan participants. In Figure 2, wehighlighted some of the most commoncomparisons and key metrics.FOR INVESTMENT PROFESSIONALS ONLY. NOT FOR FURTHER DISTRIBUTION.1
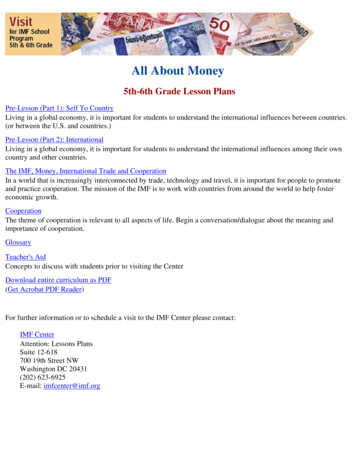
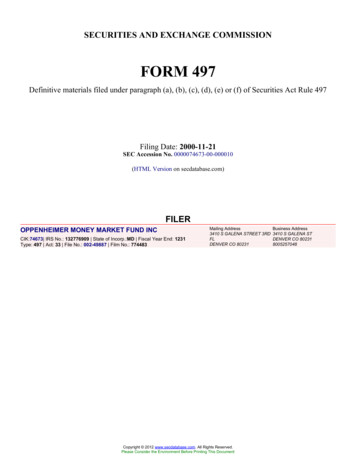
Historical Yield Comparison(Fig. 1) Stable value can offer more attractive yields relative to money markets3.5109Hueler Index¹3.0Lipper Money Market Index²2.5Bloomberg Barclays U.S. Intermediate Government/Credit Bond 201020122014201620182020As of June 30, 2020.Past performance is not a reliable indicator of future performance. Money market and stable value funds have different risks. It is important that youcarefully review the legal documents for each type of vehicle prior to investment to determine if it is appropriate for you.Figures are calculated in U.S. dollars.1The Hueler Pooled Fund Index is provided by Hueler Analytics, Inc., a stable value data and research firm, which has developed the Hueler Analytics Stable ValuePooled Fund Comparative Universe (Universe) for use as a comparative database to evaluate collective trust funds and other pooled vehicles with investments inGICs and other stable value instruments. The Hueler Pooled Fund Index is an equal‑weighted total return average across all participating funds in the Universeand represents approximately 75% of the stable value pooled funds available to the marketplace. Universe rates of return are reported gross of management fees(see Additional Disclosures).2Source for Lipper index data: Lipper Inc. (See Additional Disclosures.)3The Bloomberg Barclays U.S. Intermediate Government/Credit Bond Index is a component of the Bloomberg Barclays U.S. Government & Credit Index. TheGovernment & Credit Index includes securities in the Government and Credit Indices. The Government Index includes Treasuries (i.e., public obligations of theU.S. Treasury that have remaining maturities of more than 1 year) and agencies (i.e., publicly issued debt of U.S. government agencies, quasi‑federal corporations,and corporate or foreign debt guaranteed by the U.S. government). The Credit Index includes publicly issued U.S. corporate and foreign debentures and securednotes that meet specified maturity, liquidity, and quality requirements.There is no standardized industry‑accepted benchmark for stable value portfolios; all information on this page is provided for illustrative purposes only.Source for Bloomberg Barclays index data: Bloomberg Index Services Limited. Please see Additional Disclosures for information about this Bloomberg information.While both investment options offerparticipants daily liquidity and a stablenet asset value, stable value fundscan offer yield advantages over moneymarket funds. As highlighted in Figure 3,this yield advantage has translated intostronger long‑term performance relativeto money market funds in the past.In addition to performing well relativeto money market funds, given theirlonger underlying durations, stable valuefunds also perform well relative to otherlow‑duration strategies, such as ultrashort‑term bond and short‑term bond,over a full market cycle. Additionally,stable value has kept pace with inflationas measured by the U.S. consumer priceindex (Figure 4).Specific to periods of Fed easing,stable value funds have also held upwell relative to money market fundsand kept pace with low‑duration fixedincome strategies, like ultra short‑termand short‑term bond, through periodsof Fed easing (Figure 5). As was thecase in prior rate easing cycles, plans2
Comparison Table(Fig. 2) Stable value and money market funds have some important differencesMoney Market FundStable Value FundNet Asset Value (NAV)StableStableParticipant LiquidityDailyDailyPlan WithdrawalsDailySubject to withdrawal provisions1Participant rsDailyDaily to noncompetinginvestment options20.86% 42.31%5Annualized Yield3Most stable value portfolios are subject to a put provision, meaning that plan sponsors need to notify theasset manager and wait a set amount of time before exiting.2Stable value participants generally may not directly exchange assets from stable value to a competinginvestment option (typically shorter‑duration bond funds and money market funds) unless such transfer isfirst subject to a 90‑day transfer into a noncompeting fund.3As of June 30, 2020.4Based on the Lipper Money Market Index.5Based on the Hueler Pooled Fund Index.1Growth of USD 100(Fig. 3) Stable value can offer more opportunity for income relative to money markets180Bloomberg Barclays U.S. Intermediate Government/Credit Bond Index1Hueler Pooled Fund Index2Lipper Money Market Fund 620182020As of June 30, 2020Past performance is not a reliable indicator of future performance.Figures are calculated in U.S. dollars.1The Bloomberg Barclays U.S. Intermediate Government/Credit Bond Index is a component of the Bloomberg Barclays U.S. Government & Credit Index. TheGovernment & Credit Index includes securities in the Government and Credit Indices. The Government Index includes Treasuries (i.e., public obligations of the U.S.Treasury that have remaining maturities of more than 1 year) and agencies (i.e., publicly issued debt of U.S. government agencies, quasi‑federal corporations, andcorporate or foreign debt guaranteed by the U.S. government). The Credit Index includes publicly issued U.S. corporate and foreign debentures and secured notesthat meet specified maturity, liquidity, and quality requirements.2The Hueler Pooled Fund Index is provided by Hueler Analytics, Inc., a stable value data and research firm, which has developed the Hueler Analytics Stable ValuePooled Fund Comparative Universe (Universe) for use as a comparative database to evaluate collective trust funds and other pooled vehicles with investments inGICs and other stable value instruments. The Hueler Pooled Fund Index is an equal‑weighted total return average across all participating funds in the Universe andrepresents approximately 75% of the stable value pooled funds available to the marketplace. Universe rates of return are reported gross of management fees (seeAdditional Disclosures).3Source for Lipper index data: Lipper Inc. (See Additional Disclosures.)There is no standardized industry‑accepted benchmark for stable value portfolios; all information on this page is provided for illustrative purposes only.Source for Bloomberg Barclays index data: Bloomberg Index Services Limited. Please see Additional Disclosures for information about this Bloomberg information.3
and participants have benefited fromsome of stable value’s advantages, suchas capital preservation but with accessto attractive yields, during the currenteasing cycle and global crisis. Stablevalue remains an attractive investmentoption through multiple markets andinterest rate environments.Given stable value funds’ performancehistory and risk/return profile relativeto money market funds and othershort‑term bond strategies, now couldbe the time to reassess your plan’scapital preservation options andconsider a stable value fund.Historical Performance Comparison(Fig. 4) Stable value has fared well compared with other low‑duration strategies and inflationTen Years Ended May 31, 2020322Average Annual Return (%)Average Annual Return (%)Five Years Ended May 31, 2020310-1-110-1012-1Average Annual Standard Deviation (%)012Average Annual Standard Deviation (%)Lipper U.S. Treasury Money Markets Funds IndexBloomberg Barclays 1–3 Yr. Gov’t./Credit IndexBloomberg Barclays Short-Term Gov't./Corp. IndexHueler Pooled Fund IndexU.S. Consumer Price IndexPast performance is not a reliable indicator of future performance.Money market funds, trust, separate accounts, and mutual funds have different risks, including the possible loss of principal. It is important that youcarefully review the legal documents for each type of vehicle to determine if it is appropriate for you prior to investment.Figures are calculated in U.S. dollars using monthly data and are gross of fees. Returns would have been lower as the result of the deduction of applicable fees.The Lipper Money Market Funds Index is an equally weighted performance index of the largest qualifying funds in the Lipper category. Lipper index gross-of-feesperformance data are not available.Source for Lipper index data: Lipper Inc. (See Additional Disclosures.)Source for Bloomberg Barclays index data: Bloomberg Index Services Limited. Please see Additional Disclosures for information about this Bloomberg information.Copyright Hueler Companies, Inc. and Hueler Analytics, Inc. 2020. All rights reserved (see Additional Disclosures).4
Historical Rate Easing Cycles(Fig. 5) Stable value has been attractive through multiple market types1010January 3, 2001December 11, 2001September 18, 2007December 16, 5Y43Y62Y66M65Y10Y30Y63Y82Y86M83M8November 30, 2015June 30, 20205Y10Y30YJanuary 9, 1991December 20, 1991Nov. 2015–June 2020 Fed EasingPercent3Y102007–2008 Fed EasingPercent2Y2001 Fed EasingPercent6M1991 Fed Easing1991 Fed Easing—PeriodReturns (Annualized)2001 Fed Easing—PeriodReturns (Annualized)2007–2008 Fed Easing—Period Returns (Annualized)Nov. 2015–June 2020 Fed Easing—Period Returns 1088866644422243210Money Stable Ultra ShortMarket Value Short- TermTerm BondBond0Money Stable Ultra ShortMarket Value Short- TermTerm BondBond0Money Stable Ultra ShortMarket Value Short- TermTerm BondBond0Money Stable Ultra ShortMarket Value Short- TermTerm BondBondPast performance is not a reliable indicator of future performance.Money Market market funds, trust, separate accounts, and mutual funds have different risks, including the possible loss of principal. It is importantthat you carefully review the legal documents for each type of vehicle to determine if it is appropriate for you prior to investment.Money Market is represented by the Lipper US Treasury Money Market Index; Ultra Short-Term Bond is represented by the Bloomberg Barclays 9–12 MonthT-Bill Index; Short-Term Bond is represented by the Bloomberg Barclays U.S. 1–3 Year Government/Credit Bond Index; Stable Value is represented by the HuelerPooled Funds Index.Ultra Short-Term Bond is represented by the Bloomberg Barclays 6 month Bell Weather Index for the 1991 Fed easing cycle.Sources: Hueler Analytics, Lipper, Inc. (see Additional Disclosure), U.S. Department of the Treasury, and T. Rowe Price.Source for Bloomberg Barclays index data: Bloomberg Index Services Limited. Please see Additional Disclosures for information about this Bloomberg information.5
T. Rowe Price focuses on delivering investment managementexcellence that investors can rely on—now and over the long term.Additional DisclosuresCopyright Hueler Companies, Inc. and Hueler Analytics, Inc. 2020. All rights reserved. Hueler Index statistics are presented for comparative purposes only. Anyfurther dissemination, distribution, or copying of the Hueler Universe data is strictly prohibited without prior approval or authorization from Hueler Analytics.Portions of the information contained in this display was supplied by Lipper, a Refinitiv Company, subject to the following: Copyright 2020 Refinitiv. All rightsreserved. Any copying, republication or redistribution of Lipper content is expressly prohibited without the prior written consent of Lipper. Lipper shall not beliable for any errors or delays in the content, or for any actions taken in reliance thereon.Bloomberg Index Services Limited. BLOOMBERG is a trademark and service mark of Bloomberg Finance L.P. and its affiliates (collectively “Bloomberg”).BARCLAYS is a trademark and service mark of Barclays Bank Plc (collectively with its affiliates, “Barclays”), used under license. Bloomberg or Bloomberg’slicensors, including Barclays, own all proprietary rights in the Bloomberg Barclays Indices. Neither Bloomberg nor Barclays approves or endorses this material,or guarantees the accuracy or completeness of any information herein, or makes any warranty, express or implied, as to the results to be obtained therefromand, to the maximum extent allowed by law, neither shall have any liability or responsibility for injury or damages arising in connection therewith.Important InformationThis material is being furnished for general informational and/or marketing purposes only. The material does not constitute or undertake to give advice of any nature,including fiduciary investment advice, nor is it intended to serve as the primary basis for an investment decision. Prospective investors are recommended to seek independentlegal, financial and tax advice before making any investment decision. T. Rowe Price group of companies including T. Rowe Price Associates, Inc. and/or its affiliates receiverevenue from T. Rowe Price investment products and services. Past performance is not a reliable indicator of future performance. The value of an investment and any incomefrom it can go down as well as up. Investors may get back less than the amount invested.The material does not constitute a distribution, an offer, an invitation, a personal or general recommendation or solicitation to sell or buy any securities in any jurisdiction or toconduct any particular investment activity. The material has not been reviewed by any regulatory authority in any jurisdiction.Information and opinions presented have been obtained or derived from sources believed to be reliable and current; however, we cannot guarantee the sources’ accuracyor completeness. There is no guarantee that any forecasts made will come to pass. The views contained herein are as of the date written and are subject to change withoutnotice; these views may differ from those of other T. Rowe Price group companies and/or associates. Under no circumstances should the material, in whole or in part, becopied or redistributed without consent from T. Rowe Price.The material is not intended for use by persons in jurisdictions which prohibit or restrict the distribution of the material and in certain countries the material is provided uponspecific request. It is not intended for distribution to retail investors in any jurisdiction.USA—Issued in the USA by T. Rowe Price Associates, Inc., 100 East Pratt Street, Baltimore, MD, 21202, which is regulated by the U.S. Securities and Exchange Commission.For Institutional Investors only. 2020 T. Rowe Price. All rights reserved. T. Rowe Price, INVEST WITH CONFIDENCE, and the bighorn sheep design are, collectively and/or apart, trademarks or registeredtrademarks of T. Rowe Price Group, Inc.ID0003534 (08/2020)202008‑12997686
1 The Hueler Pooled Fund Index is provided by Hueler Analytics, Inc., a stable value data and research firm, which has developed the Hueler Analytics Stable Value Pooled Fund Comparative Universe (Universe) for use as a comparative database to evaluate collective trust funds and other pooled vehicles with investments in