Transcription
Technical Paper No. 294Patterns and Trendsin Subsistence Salmon Harvests,Norton Sound and Port Clarence,1994-2003ByJames S. Magdanz,Eric Trigg,Austin Ahmasuk,Peter Nanouk,David S. Koster,andKurt R. KamletzAugust 2005Alaska Department of Fish and GameDivision of Subsistence
3YMBOLS AND !BBREVIATIONS4HE FOLLOWING SYMBOLS AND ABBREVIATIONS AND OTHERS APPROVED FOR THE 3YSTÒME )NTERNATIONAL Dg5NITÏS 3) ARE USEDWITHOUT DEFINITION IN THE FOLLOWING REPORTS BY THE IVISIONS OF 3PORT &ISH AND OF #OMMERCIAL &ISHERIES &ISHERY-ANUSCRIPTS &ISHERY ATA 3ERIES 2EPORTS &ISHERY -ANAGEMENT 2EPORTS AND 3PECIAL 0UBLICATIONS !LL OTHERSINCLUDING DEVIATIONS FROM DEFINITIONS LISTED BELOW ARE NOTED IN THE TEXT AT FIRST MENTION AS WELL AS IN THE TITLES ORFOOTNOTES OF TABLES AND IN FIGURE OR FIGURE CAPTIONS 7EIGHTS AND MEASURES TERLITERMETERMILLILITERMILLIMETER7EIGHTS AND MEASURES %NGLISHCUBIC FEET PER SECONDFOOTGALLONINCHMILENAUTICAL MILEOUNCEPOUNDQUARTYARD4IME AND TEMPERATUREDAYDEGREES #ELSIUSDEGREES &AHRENHEITDEGREES KELVINHOURMINUTESECOND0HYSICS AND CHEMISTRYALL ATOMIC SYMBOLSALTERNATING CURRENTAMPERECALORIEDIRECT CURRENTHERTZHORSEPOWERHYDROGEN ION ACTIVITY NEGATIVE LOG OFPARTS PER MILLIONPARTS PER THOUSANDVOLTSWATTSCMD,GHAKGKM,MM,MMFT SFTGALINMINMIOZLBQTYDD#& HMINS!#!CAL #(ZHPP(PPMPPTy67'ENERAL!LASKA !DMINISTRATIVE#ODEALL COMMONLY ACCEPTEDABBREVIATIONS!!#E G -R -RS 0- ETC !-ALL COMMONLY ACCEPTEDPROFESSIONAL TITLESATCOMPASS DIRECTIONS EASTNORTHSOUTHWESTCOPYRIGHTCORPORATE SUFFIXES #OMPANY#ORPORATION)NCORPORATED,IMITED ISTRICT OF #OLUMBIAET ALII AND OTHERSET CETERA AND SO FORTHEXEMPLI GRATIA FOR EXAMPLE&EDERAL )NFORMATION#ODEID EST THAT ISLATITUDE OR LONGITUDEMONETARY SYMBOLS 5 3 MONTHS TABLES ANDFIGURES FIRST THREELETTERSREGISTERED TRADEMARKTRADEMARK5NITED 3TATES ADJECTIVE5NITED 3TATES OF!MERICA NOUN5 3 # 5 3 STATEE G R 0H 2 . ETC %.37 #O #ORP )NC ,TD # ET AL ETC E G &)#I E LAT OR LONG *AN EC 5 3 53!5NITED 3TATES#ODEUSE TWO LETTERABBREVIATIONS E G ! 7!-EASURES FISHERIESFORK LENGTHMIDEYE TO FORKMIDEYE TO TAIL FORKSTANDARD LENGTHTOTAL LENGTH-ATHEMATICS STATISTICSALL STANDARD MATHEMATICALSIGNS SYMBOLS ANDABBREVIATIONSALTERNATE HYPOTHESISBASE OF NATURAL LOGARITHMCATCH PER UNIT EFFORTCOEFFICIENT OF VARIATIONCOMMON TEST STATISTICSCONFIDENCE INTERVALCORRELATION COEFFICIENT MULTIPLECORRELATION COEFFICIENT SIMPLECOVARIANCEDEGREE ANGULARDEGREES OF FREEDOMEXPECTED VALUEGREATER THANGREATER THAN OR EQUAL TOHARVEST PER UNIT EFFORTLESS THANLESS THAN OR EQUAL TOLOGARITHM NATURALLOGARITHM BASE LOGARITHM SPECIFY BASEMINUTE ANGULARNOT SIGNIFICANTNULL HYPOTHESISPERCENTPROBABILITYPROBABILITY OF A TYPE ) ERROR REJECTION OF THE NULLHYPOTHESIS WHEN TRUEPROBABILITY OF A TYPE )) ERROR ACCEPTANCE OF THE NULLHYPOTHESIS WHEN FALSESECOND ANGULARSTANDARD DEVIATIONSTANDARD 6 & T ETC #)2RCOVDF%(05%LNLOGLOG ETC g.3(/ 0 3 3%6ARVAR
Technical Paper No. 294Patterns and Trendsin Subsistence Salmon HarvestsNorton Sound and Port Clarence,1994-2003byJames S. MagdanzAlaska Department of Fish and Game, Division of SubsistenceEric TriggKawerak Inc., Department of Natural ResourcesAustin AhmasukKawerak Inc., Department of Natural ResourcesPeter NanoukAlaska Department of Fish and Game, Division of Commercial FisheriesDavid S. KosterAlaska Department of Fish and Game, Division of SubsistenceKurt R. KamletzAlaska Department of Fish and Game, Division of SubsistenceDivision of SubsistenceAlaska Department of Fish and GameJuneau, AlaskaAugust 2005Final Report to the Arctic-Yukon-Kuskokwim Sustainable Salmon Initiative to fulfill obligations for Study No. 401.Third Printing (October 2008).
The Division of Subsistence Technical Paper Series was established in 1979 and represents the most completecollection of information about customary and traditional uses of fish and wildlife resources in Alaska. The paperscover all regions of the state. Some papers were written in response to specific fish and game management issues.Others provide detailed, basic information on the subsistence uses of particular communities which pertain to a largenumber of scientific and policy questions. Technical Paper Series reports are available through the Alaska StateLibrary and on the Internet: blctns/techpap.cfmJames MagdanzAlaska Department of Fish and Game, Division of SubsistenceBox 689, Kotzebue, AK 99752-0689 USAEric Trigg and Austin AhmasukKawerak Inc., Department of Natural ResourcesBox 948, Nome, AK 99762-0948 USAPeter NanoukAlaska Department of Fish and Game, Division of Commercial FisheriesPouch 1148, Nome, AK 99762-1148 USADavid Koster and Kurt R. KamletzAlaska Department of Fish and Game, Division of Subsistence,333 Raspberry Road, Anchorage, AK 99518-1599 USAThis document should be cited as:Magdanz, J.S., E. Trigg, A. Ahmasuk, P. Nanouk, D.S. Koster, and K.R. Kamletz. 2005. Patterns and trends insubsistence salmon harvests, Norton Sound and Port Clarence, 1994-2003. Alaska Department of Fish and Game,Division of Subsistence Technical Paper No. 294. Juneau.The Alaska Department of Fish and Game (ADF&G) administers all programs and activities free from discriminationbased on race, color, national origin, age, sex, religion, marital status, pregnancy, parenthood, or disability. The department administers all programs and activities in compliance with Title VI of the Civil Rights Act of 1964, Section 504of the Rehabilitation Act of 1973, Title II of the Americans with Disabilities Act of 1990, the Age Discrimination Actof 1975, and Title IX of the Education Amendments of 1972.If you believe you have been discriminated against in any program, activity, or facility please write: ADF&G ADA Coordinator, PO Box 115526, Juneau, AK 99811-5526. U.S. Fish and Wildlife Service, 4040 N. Fairfax Drive, Suite 300 Webb, Arlington, VA 22203 Office of Equal Opportunity, U.S. Department of the Interior, Washington DC 20240.The department’s ADA Coordinator can be reached via phone at the following numbers:(VOICE) 907-465-6077, (Statewide Telecommunication Device for the Deaf) 1-800-478-3648, (Juneau TDD)907-465-3646, or (FAX) 907-465-6078.For information on alternative formats and questions on this publication, please contact:ADF&G, Division of Subsistence, Website: http://www.subsistence.adfg.state.ak.us/
AbstractUsing harvest data from the northwest salmon survey project, thisproject explored patterns and trends in subsistence salmon harvestsin ten communities in the Norton Sound – Port Clarence Area. Researchers retrieved archived annual data files, imported them into aSQL database, and then aggregated the ten annual data sets into asingle household-level SPSS database. Working with local researchassistants, researchers verified household identifiers and gatheredadditional information on household characteristics.Estimated subsistence salmon harvests from 1994 through 2003trended lower by 5.8 percent annually. Most of the declines occurredduring the first five years (1994-1998), when harvests trended lowerby about 8 percent annually. During the latter years (1999-2003),harvests trended lower by about 1 percent annually across all communities. While harvests appeared to have stabilized in the latteryears, it would not be correct to characterize the overall situation asimproving, at least through 2003. For half of the study communities,the lowest estimated harvests occurred in 2003.Despite variation in household harvests, there were harvest patterns, patterns that might be used to refine estimation and prediction. Through many different levels of abundance, through a decadeof varied weather, with harvests ranging from 67,000 to 140,000salmon, each year about 23 percent (range, 21.8 to 24.6 percent)of the households harvested 70 percent of the salmon, by weight.Predictable patterns were also apparent in the harvests by the ageand gender of household heads. Setting aside teacher householdsand households that usually did not fish, harvests increased with theage of the household heads, and decreased when household headswere single, especially single males. Households that consistentlyharvested salmon also were among the high harvesting households intheir communities. Neither commercial fishing retention nor familyevents (death, marriage, divorce) seemed to affect harvest levels.Given these predictable overall patterns, were the same households responsible for a majority of the harvests year after year? Somehouseholds did contribute consistently to the community harvest.Yet in every community, there were many unpredictable households,households that usually contributed much and then in one year contributed little, or vice versa. This was not apparent without time-seriesdata on household harvests.i
Revision Notes for the Second PrintingJanuary 2006Page i: "Given these predictable overall patterns, were the same households responsible fora majority of the households harvests year after year?"Page 25: Figure 3-4 revised to remove vegetation data from the pie chart. Figure title andnote changed to clarify that only meat and fish are included.Page 26: "Wild fish and meat accounted for 74 75 percent of all meat and fish consumed bythe respondents. Salmon alone contributed 36 33 percent of the total." (To reflect changesto Figure 3-4).Page 26. "one of the largest contributors to the local diet wild salmon" changed to "wildsalmon are one of the largest contributors to the local diet."July 2006Corrected minor typographical errors throughout document.Page 6. Removed sentence in final paragraph: "A series of supplemental figures allowsreaders who are interested in a particular analysis or a particular community to explore thosesubjects in greater detail than was possible in the body of the report."Page 27. Reversed headings "Patterns" and "Trends" in the definitions box. (Error introducedin the January 2006 revision.)Page 36. "Elim havested 3,529 large salmon in 1995 2003."Page 43. References to Figure 4-12 changed to Figure 4-13.Page 46. "Lines that fall to the upper right left." Reference to Figure 4-13 changed toFigure 4-16.Page 53. Second paragraph rewritten to improve clarity. Reference to Figure 2-2 added tocaption.Page 66. ".were the same households responsible for a majority of the households harvestsyear after year?"Page 77. ".were the same households responsible for a majority of the households harvestsyear after year?"Revision Notes for the Third PrintingOctober 2008Corrected misspelling of Kurt Kamletz' name on cover. Replaced author name "Brian Davis"with author name "Kurt R. Kamletz" on title page and colophon to match cover page.ii
Table of ContentsAbstract. iList of Figures.ivList of Tables. viAcknowledgments. viiChapter 1. 6Chapter 2. Methods.7The Northwest Salmon Harvest Survey.7The Patterns and Trends Project.10Phase 1: Harvest Data Aggregation.12Phase 2: Verification and Characteristics.13Phase 3: Data Merge.14Phase 4: Data Analysis.16Data Presentation.18Chapter 3. The Setting.21Populations and Incomes.23The Role of Wild Foods.24Chapter 4. Findings.27Harvest Trends.29Trends by Species.29Trends by Community.33Population, Effort, and Harvest.38Harvest Patterns.41The 30-70 Hypothesis.41Household Social Type.48Consistent and Intermittent Fishing.50Salmon Retained from Commercial Fishing.55Family Events.59Roles of Individual Households.61Chapter 5. Summary and Discussion.67Methodological Issues.67Trends.68Patterns.71Use of Time-Series Data.78References.79Appendix 1: Survey Instruments, 1994-2003.83Appendix 2: Project Personnel, 1994-2003.105Appendix 3: Supplemental Survey, 2004.109Appendix 4: Variable Lists, 1994-2003.113iii
List of FiguresFigure 1-1 Estimated subsistence and reported commercialsalmon harvests, Norton Sound, 1993-2004.3Figure 1-2 Estimated number of salmon harvested for subsistencein the Norton Sound and Port Clarence Districts.5Figure 2-1 Pareto chart examples.19Figure 2-2 Boxplot example.20Figure 3-1 The study area.21Figure 3-2 Community populations and incomes.22Figure 3-3 Cost of Food and Heating Oil.24Figure 3-4 Survey estimates of wild food consumption.25Figure 4-1 Salmon harvest trends in Port Clarence and NortonSound, 1994-2003.28Figure 4-2 Species composition of subsistence harvests.29Figure 4-3 Estimated total subsistence harvests by species byyear, Port Clarence, 1994-2003.30Figure 4-4 Estimated total subsistence harvests by species byyear, Norton Sound, 1994-2003.31Figure 4-5 Large salmon harvest trends, Brevig Mission andTeller.33Figure 4-6 Large salmon harvest trends, White Mountain andGolovin.35Figure 4-7 Large salmon harvest trends, Elim and Koyuk. .36Figure 4-8 Large salmon harvest trends, Shaktoolik andUnalakleet.37Figure 4-9 Large salmon harvest trends, St. Michael andStebbins. . .38Figure 4-10 Numbers of total, surveyed, usually fish, andharvesting households, 1994-2003.39Figure 4-11 Per capita salmon harvests in growing and shrinkingcommmunities, 1994-2003.40Figure 4-12 Concentration of salmon harvests by year.42Figure 4-13 Concentration of salmon harvests by community.43Figure 4-14 Pareto chart, all communities 1994-2003.44Figure 4-15 Pareto charts by year, Port Clarence communities.46iv
Figure 4-16 Pareto charts by year, Norton Sound communities.47Figure 4-17 Average pounds of salmon harvested annually, byhousehold type.48Figure 4-18 Average pounds of salmon harvested by householdtype, Port Clarence communities.49Figure 4-19 Average pounds of salmon harvested by householdtype, Norton Sound communities.50Figure 4-20 Consistent and intermittent fishing households, bycommunity.52Figure 4-21 Annual percentile harvest rank by harvest category.53Figure 4-22 Contributions of consistent and intermitent fishinghouseholds.54Figure 4-23 Salmon sources for commercial fishing households.56Figure 4-24 Total number of salmon reported by commercialfishing households.57Figure 4-25 Scattergram, harvests by commercial fishinghouseholds.58Figure 4-26 Pounds harvested by family event category.59Figure 4-27 Pounds harvested by family event category andhosuehold type. .60Figure 4-28 Annual harvest rank by household, Brevig Missionand Teller.62Figure 4-29 Annual harvest rank by household, White Mountain,Golovin, Elim and Koyuk.64Figure 4-30 Annual harvest rank by household, Shaktoolik,Unalakleet, St. Michael, and Stebbins.65Figure 5-1 Salmon harvest trends in Norton Sound, 1994-2003.69Figure 5-2 Per capita salmon harvests in growing and shrinkingcommunities.71Figure 5-3 Pareto chart, all communities 1994-2003.72Figure 5-4 Average pounds of salmon harvested annually, byhousehold type.73Figure 5-5 Pounds harvested by family event category andhousehold type.75Figure 5-6 Variation in salmon harvests, Teller and Koyuk.77v
List of TablesTable 2-1 Summary of harvest survey samples, by communityand by year, 1994-2003. 9Table 2-2 Data collection schedule, by community, 2004. 13Table 2-3 Example of household ID verification.15Table 2-4 Summary of selected variables in aggregateddatabase.17vi
AcknowledgmentsScores of people in all ten study communities worked over an entiredecade to gather the data analyzed in this project, and the analysiswould not have been possible without them. The average sampleincluded 88 percent of the occupied households, 784 households ayear. Achieving such consistently large samples was not easy to do,and was a testament to the dedication of community researchers andthe fisheries technicians who worked with them. It was also a testament to the growing capacity of Kawerak Inc. to direct field researchprojects, under the guidance provided by Eileen Norbert, Rose AtukFosdick, Sandra Tahbone, and Don Stiles.Nor would that data have been so useful to this project if it hadnot been so carefully and consistently reviewed, organized, and archived. Consistent survey instruments and analysis procedures weremaintained by ADF&G research staff, in particular Susan Georgette,David Caylor, Charles Utermohle, and Robert Walker.ADF&G’s field staff provided an essential link between thecommunity researchers and ADF&G project leaders. The field stafftraveled from community to community supervising and assistingwith the data collection efforts. During the decade, ADF&G’s fieldstaff included Betsy Brennan, Carl “Bones” Brown, Erin Lillie, PaulMcNeil, Peter Nanouk, Kate Persons, Sandra Prufer, Joel Saccheus,Vicki Vanek, and Cheryl Yamamoto.The ADF&G Division of Commercial Fisheries and Managementprovided most of the funding for the project. Charles Lean, Fred Bue,Tracy Lingnau, Tom Kron, Allegra Banducci, Wes Jones, and JimMenard administered the Nome subdistrict salmon permit system,and provided many helpful suggestions. Field researchers were paidwith funds from the Bering Sea Fishermen’s Association.In Brevig Mission, data were collected by Michael Olanna, RoyHenry, Sarah Henry, Marilyn “Janie” Goodhope, and Matilda Olanna.In Teller, data were collected by Sam Komok, Lillian Weyanna, Norman Menadelook, Etta Kugzruk, Karla Kugzruk, Tanya Noyakuk,and Carlson Tingook.In White Mountain, data were collected by Dean Lincoln and Carl“Bones” Brown. In Golovin, data were collected by Thomas Punguk,Dora Smith, Isaac Larsen, Peter Amaktoolik, Carl “Bones” Brown,and Clarabelle Katchatag. In Elim, data were collected by StantonNakarak, Joel Saccheus, and Amelia Amaktoolik. In Koyuk, data werevii
collected by Lloyd K. Kimoktoak, Dean Kimoktoak, Leslie Charles,Ruby Nassuk, Fannie Nassuk, Lane Douglas, Becky Anasogak, andAbigail Anasogak.In Shaktoolik, data were collected by William Takak, PriscillaSavetilik, Carrie Takak, Karen Nashalook, Ralph Takak, and MyronSavetilik. In Unalakleet, data were collected by Dawn Blankenship,Warren Katchatag, Burkher Ivanoff, Robin Caudill, Gloria Johnson,Nancy Rusin, Louisa Paniptchuk, Teri Paniptchuk, Carla Soxie, CarolCharles, Nixie Nick, Howard Slwooko, Karen Bradley, David Ivanoff,and Jolene Katchatag.In St. Michael, data were collected by Pius Washington, DoraLockwood, Harold Cheemuk, Vera Niksik, Steve Otten, Preston Otten,Stephanie Lockwood, and Paul Agibinik. In Stebbins, data were collected by Cornelius Dan, Ted Katcheak, Joseph Steve, Tania Snowball,Tom Kirk, Rennie Jack, Patrick Katcheak, and George Washington.James Magdanz would also like to thank Lawrence Hamilton atthe University of New Hampshire for his helpful comments on different approaches to statistical analysis, as well as Bruce Ruttenburgand Superior Court Judge Richard Erlich for their insights on socialissues related to subsistence harvest patterns. Bridgette Easley helpedcoordinate data organization for the project, while James Simon andJesse Dizard reviewed results and supervised our progress. Althoughhe is no longer with the Division of Subsistence, Robert Wolfe’s ideasand approaches continue to guide our research.Many more people than we can name here have contributed to thiseffort. To each of you, we offer our appreciation.viii
1IntroductionFrom 1994 through 2003, the Alaska Department of Fish and Gameand Kawerak Inc. documented subsistence salmon harvests in theNorton Sound – Port Clarence area through a series of systematichousehold surveys, the northwest salmon survey. The survey datawere used primarily to estimate the total annual harvests of salmonby residents of the survey communities. Survey results were published in annual management reports and in annual summary reports.No additional analyses had been conducted on this data set.This project retrieved the ten annual harvest survey data files,translated them into a common data format, standardized variablenames across years, and then merged the ten separate data sets intoa single database. This project also verified household identificationcodes in each survey community, corrected household identification code errors, collected additional information on householdcharacteristics, and then merged the harvest survey data with thehousehold characteristics data. Using the merged database, researchers explored patterns of salmon harvests at the householdlevel. Researchers stratified households and explored patterns andtrends in salmon harvests among groups of similar households. Theproject also tested hypotheses on subsistence production that havenot been explored previously with time-series data.The project was funded by the Arctic-Yukon-Kuskokwim Sustainable Salmon Initiative (AYK-SSI). It was conducted jointly byKawerak, Inc., the regional non-profit corporation for the NortonSound – Bering Strait region, and the Division of Subsistence ofthe Alaska Department of Fish and Game.The project addressed three objectives listed as interim prioritiesfor the AYK-SSI request for proposals for 2004-05. First, it refinedan existing salmon database, which will be available for additionalresearch in the future. Second, it conducted retrospective data analyses that increased knowledge of harvesting patterns at the householdlevel, which in turn could be used to refine models that attempt topredict future salmon harvests. Third, it should help future researchers design sampling strategies for village-based harvest surveys ifdeclining funding requires reductions in sample sizes.1
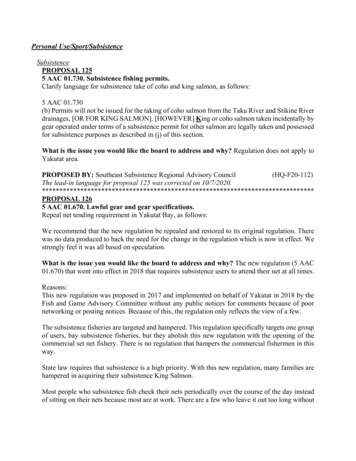
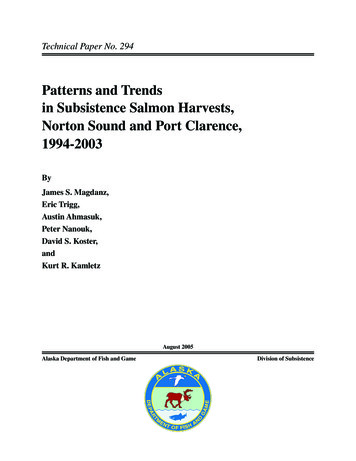
IntroductionWhile the objectives of this study tended to be technical – sampling strategies and analyses methods – the study also was an opportunity to review the recent history salmon harvests in the NortonSound – Port Clarence Area in more detail than had been possiblepreviously. The surveys occurred during a time of declining subsistence harvests and even more pronounced declines in commercialharvests (Figure 1-1). These declines created considerable hardshipin the region, which will be evident in the harvest data.ObjectivesThe project had five objectives:1 Review annual survey data sets to verify variable naming consistency and to verify year-to-year household identifiers, thencombine household records of subsistence salmon harvests forten Norton Sound and Port Clarence district communities from1994 to 2003 in a single database.2 Gather additional data on household characteristics, and addthese data to the database.3 Stratify households into different social and economic categories,based on their harvest histories and other characteristics.4 Compare harvest patterns among the different household strataover time, and test hypotheses about factors related to subsistencesalmon harvests.5 Publish a technical paper describing findings.RationaleEstimating and predicting wild food harvests in rural Alaska presents many challenges. Most management agencies and independentresearchers rely primarily on household surveys to gather wild foodharvest data. This project – which analyzed subsistence harvest datafrom 7,838 household surveys conducted over ten years – is yetanother example. Surveys are time consuming and labor intensive,so researchers are inclined to sample rather than census rural populations. Because household harvests are widely varied and are notnormally distributed, sampling introduces a host of challenges. Thisproject explores some of those challenges, using salmon harvestdata collected in a series of ten annual censuses.Most wild food survey projects can be categorized into twogeneral types. One type is the recurrent, annual survey of a particular species by residents of many communities. The northwest2
IntroductionLARGE mber of 199719981999Subsistence (Large Salmon)2000200120022003Commercial (Large Salmon)PINK SALMON1,200,0001,038,4291,000,000Number of 01994199519961997Subsistence (Pink Salmon)1998199920002001Commercial (Pink Salmon)Figure 1-1. Estimated subsistence and reported commercial salmon harvests, subdistricts 2-6, Norton Sound,1993-2004. Declining salmon abundance and deteriorating salmon markets both contributed to declines inharvests.(ThereFigureare nosalmonfisheriesin subdistrict1 ofNortonNortonSoundor in Port Clarence.)Supplemental2-).commercialSubsistence andCommercialHarvests,(Multiple Items),Sound,1994-2003.3
Introductionsalmon survey project is an example of a recurrent project (Figure1-2). The second type is the occasional, comprehensive survey ofthe harvests of all species by residents of a single community orsmall group of communities during a single year. Most analyses ofsubsistence harvests have been based on occasional comprehensivesurveys (e.g. Anderson et al 1999, Georgette and Loon 1993). Amuch smaller group of studies have explored comprehensive datafrom more than one year (Braund 1993; Burch 1985; Fall andUtermohle 1995, 1999).Relatively few analyses have been conducted on recurrent harvest assessments spanning a decade or more. If one is interested inhow communities adapt to changing social, economic, or ecological changes over time, then analyses of time series data such as thenorthwest salmon surveys should be more instructive than analysesof single-year data. If one is interested in improving sampling strategies, then an exploration of harvest data from a multi-year censusshould suggest approaches to increase confidence in estimations.In any analysis based on household level data, the assumptionmust be that the household is a useful unit of analysis. Some researchers consider households to be the primary unit of subsistenceproduction in the North (Usher et al 2003). That’s true if one iscomparing
Page 25: Figure 3-4 revised to remove vegetation data from the pie chart. Figure title and note changed to clarify that only meat and fish are included. Page 26: "Wild fishand meat accounted for 74 75 percent of all meat and fish consumed by the respondents. Salmon alone contributed 36 33 percent of the total." (To reflectchanges to Figure 3-4).