Transcription
10.18462/iir.gl.2018.1104MINIMUM AIRFLOW RATES TO DILUTE R290 CONCENTRATIONSARISING FROM LEAKS IN ROOM AIR CONDITIONERSD Colbourne(a), K O Suen(b)(a)Re-phridgePO Box 4745, Stratford-upon-Avon, CV37 1FE, UK, 44 1789 268285, d.colbourne@re-phridge.co.uk(b)Department of Mechanical Engineering, University College LondonTorrington Place, London, WC1E 7JE, UK, k.suen@ucl.ac.ukABSTRACTCurrently R290 is used to a limited extent in room air conditioners, such as split, portable and window types.The product standard IEC 60335-2-40 currently specifies requirements to limit the charge of flammablerefrigerants in such a way that it obstructs the wider use of R290. This is particularly challenging in warmcountries where the heat load is greater and thus charge sizes need to be larger for a given room size,inferring higher concentrations in the event of a leak. Relying on the airflow of an indoor unit can be used todilute a refrigerant leak and thus prevent flammable concentrations forming, despite the charge quantitybeing substantially greater than that currently permitted in the current standard. Research has been carriedout to determine the minimum airflow rate from an air conditioner necessary to achieve sufficient dilution. Anumerical model based on entrainment theory was developed and supported by experimentally analysing thebehaviour of releases under various conditions with RACS airflow.Keywords: Hydrocarbon refrigerant, R290, flammable, leakage, concentration, safety, room air conditioner1INTRODUCTIONThere is a need to enable larger quantities of R290 within room air conditioning systems (RACS) than safetystandards currently permit. In the event of a refrigerant leak from the indoor components of a RACS, asubstantial volume of flammable refrigerant-air mixture should not be allowed to build up, which couldotherwise lead to injury and/or damage in the event of ignition. Various measures to mitigate such anoccurrence are available (e.g., Colbourne et al., 2012), one of which is to use the forced airflow from theindoor unit (IDU) of the air conditioner itself to disperse the leaked refrigerant. RACS normally have a setairflow rate which is defined by the manufacturer to provide a given capacity, air throw, etc. and usersusually have control to some extent by means of several incremental fan speed settings. It is necessary toidentify whether the minimum airflow setting is adequate to dilute a release of refrigerant in case of a leakand thus whether the manufacturer would need to assign a higher minimum airflow rate to achieve dilution.Too low airflow will result in formation of a flammable mixture at the room floor (under a given leakcondition), whereas a requirement for excessively high airflow may result in unwarranted equipment costs(large fan/motor and housing) and energy costs.Various methods for determining minimum airflow rate for prevention of flammable mixtures have beenproposed elsewhere. A formula is provided within IEC (2015) that can be transposed for minimum airflowrate of extract ventilation (equation 1), for the presumption that a given continuous release does not form aflammable mixture greater than 1% of the room volume.𝑚𝑚̇𝑓𝑓 ̇𝑚𝑚𝑚𝑚𝑚𝑚 𝜌𝜌𝑙𝑙𝑙𝑙𝑙𝑙𝑙𝑙 𝜌𝜌 ��𝑣(1)where 𝑉𝑉̇𝑚𝑚𝑚𝑚𝑚𝑚 is the minimum airflow rate (m3 s-1), 𝑚𝑚̇𝑙𝑙𝑙𝑙𝑙𝑙𝑙𝑙 is the release mass flow rate (kgs-1), 𝜌𝜌𝑔𝑔 is the gasdensity (kg m-3), 𝜙𝜙 is a dimensionless multiplier for the lower flammability limit (LFL), dictating theventilation outlet concentration (i.e., 1 to ensure the mixture is non-flammable), 𝐿𝐿𝐿𝐿𝐿𝐿𝑣𝑣 is LFL as volumefraction and 𝑓𝑓 is a factor used to account for the internal mixing efficiency that may range from 1 (e.g., anempty room) up to 5 (e.g., a highly congested room). Alternatively, Colbourne and Suen (2008) proposed anexpression for determining maximum floor concentration arising from a refrigerant release due to severalinstallation and equipment characteristics which can be transposed to estimate minimum airflow rate. Morerecently the proposal of IEC (2017) for “A2L” refrigerants defines a minimum airflow rate (equation 2) anddischarge velocity of 1.0 m s-1.𝑉𝑉̇𝑚𝑚𝑚𝑚𝑚𝑚 30 𝑚𝑚𝑐𝑐 /𝐿𝐿𝐿𝐿𝐿𝐿𝑚𝑚13th IIR Gustav Lorentzen Conference, Valencia, 2018(2)
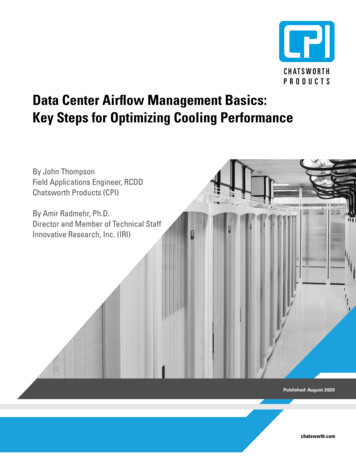
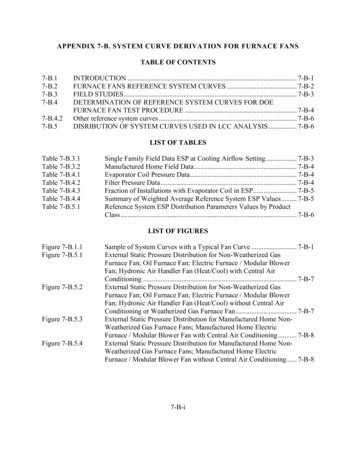
10.18462/iir.gl.2018.1104where 𝑉𝑉̇𝑚𝑚𝑚𝑚𝑚𝑚 is the minimum airflow rate (m3 h-1), 𝑚𝑚𝑐𝑐 is system refrigerant charge (kg), 𝐿𝐿𝐿𝐿𝐿𝐿𝑚𝑚 is LFL as massper volume (kg m-3) and 30 is a constant relating to assumed refrigerant leak mass flow rate.There are several short-comings with these approaches. IEC (2015) assumes infinite release duration and thatthe airflow removes some of the mixture from the room whilst replenishing with fresh air; this does notsuitably represent the case of a RACS in a closed room. Colbourne and Suen (2008) is based on a variety ofhighly pessimistic assumptions, such as the release originating from outside the unit housing and at lowmomentum and very high release mass flow rates, and the application of the formula itself is possibly toounwieldly for use in a standard. IEC (2017) only accounts for a fixed and similarly high release rate but alsoneglects the effect of RACS discharge or room air speed on mixing. Thus there is a clear need for a broadlyuniversal approach for determining the minimum airflow rate of RACS, taking account of the variousconstruction and installation characteristics of RACS as well as being relatively simple to apply for nonspecialists. In order to do this, the airflow conditions associated with a RACS are identified and theapplicable principles for airflow mixing are introduced. This leads to the development of a general formula,which is then examined with respect to practicalities experimentally and eventually the formulae are adjustedto account for empirical findings.2CONCEPT DEVELOPMENT2.1 Basic approachWhen a jet of air (e.g., from a RACS outlet grille) discharges into a free volume it entrains air from thesurroundings so that that total volumetric airflow rate of the field gradually increases (Figure 1). If that jetcomprises a stream of leaked refrigerant then the concentration of refrigerant within the flow field shouldalso gradually decrease as more air is entrained, assuming that the flow within the jet remains turbulent.Greater discharge volume flow rate increases rate of entrainment and therefore leads to more dilution.Eventually the flow will terminate, either at the opposite wall or on the room floor, depending upon whetherthe buoyancy effects or the momentum effects of the jet dominate; also indicated in Figure 1. Thus themaximum concentration observed at the opposite wall or floor would correspond to the mean concentrationwithin the cross-section of that jet at the pointthat it terminates. If this maximumJet dischargeconcentration at jet termination is set tocomprising air andEntrained airImpingingonrefrigerant LFL, then the correspondingrefrigerantopposite wallminimum airflow rate and jet outletcharacteristics may be determined.Jet centreline (x)Jetcentreline(x)Impinging onfloorFigure 1: Schematic of entrainment process and jetterminationThe analysis requires a number ofassumptions: that there is negligible airexchange between the room and itssurroundings, conditions are isothermal, .thatthe refrigerant vapour is denser than air, leakis of constant mass flow rate, negligibletransit time for an element of refrigerant toflow from the IDU to the floor or wall, and –for the present work – the air dischargedirection is horizontal.2.2 EntrainmentClassical entrainment hypothesis is that the rate of entrainment of surrounding fluid across a jet or plumeboundary is proportional to the average centreline velocity and perimeter of the flow field:𝑑𝑑𝑉𝑉̇𝑑𝑑𝑑𝑑 𝑃𝑃𝑃𝑃𝑢𝑢 𝑐𝑐(3)where 𝑉𝑉̇ is volume flow rate (m3 s-1), 𝑥𝑥 is distance along the jet (m), 𝑃𝑃 is perimeter around the flow field (m),𝛼𝛼 is entrainment coefficient and 𝑢𝑢 𝑐𝑐 is centreline velocity along 𝑥𝑥 direction (m s-1). From this, Etheridge andSandberg (1996) derive closed equations for volume flow rate of neutrally buoyant jets at some distancefrom the jet exit. Since most RACS IDUs have high aspect ratio outlets, their model for plane jets is selected:13th IIR Gustav Lorentzen Conference, Valencia, 2018
� (𝑥𝑥) 𝑏𝑏𝑉𝑉𝑜𝑜̇ 𝐴𝐴𝑜𝑜(4)where the constant 𝑏𝑏 25/4 2.4 and 𝐴𝐴𝑜𝑜 is the area of the jet outlet aperture (m2).At any distance 𝑥𝑥 from the outlet, the flow rate 𝑉𝑉̇ (𝑥𝑥) is the sum of the outlet airflow rate (𝑉𝑉𝑜𝑜̇ ) and theadditional airflow that has been entrained until distance 𝑥𝑥. Therefore the total entrained airflow, Σ𝑉𝑉𝑒𝑒̇ until 𝑥𝑥 is𝑉𝑉̇ (𝑥𝑥) minus that from the outlet:𝛼𝛼𝛼𝛼Σ𝑉𝑉𝑒𝑒̇ (𝑥𝑥) 𝑏𝑏𝑉𝑉𝑜𝑜̇ 𝑉𝑉𝑜𝑜̇𝐴𝐴𝑜𝑜(5)2.3 Jet terminationA negatively buoyant jet is discharged horizontally comprising denser than air refrigerant will eventuallyimpinge on the floor. From Etheridge and Sandberg (1996), using the constants for a plane jet with identicalboundary for flow and concentration fields, the expression for the distance travelled until termination (𝑥𝑥𝑇𝑇 )along an unobstructed jet centreline is:0.43.75𝐴𝐴𝑜𝑜 𝑜𝑜 𝑏𝑏 𝛼𝛼𝑥𝑥𝑇𝑇 ere 𝐴𝐴𝐴𝐴𝑜𝑜 is the non-dimensional Archimedes number based on the outlet conditions, as given below, ℎ𝑜𝑜 isthe centre height of the jet outlet (m) and 𝑓𝑓(𝐼𝐼) is a combination of volume, momentum, energy and buoyancyflux integrals determined analytically by Etheridge and Sandberg; 𝑓𝑓(𝐼𝐼) 0.39. Archimedes number for theIDU discharge condition is:𝐴𝐴𝐴𝐴𝑜𝑜 𝑔𝑔′ 𝐴𝐴𝑜𝑜𝑢𝑢𝑜𝑜2(7)where 𝑔𝑔′ is the reduced gravity (m s-2) and 𝑢𝑢𝑜𝑜 is the velocity at IDU air discharge (m s-1).Note that as the jet proceeds into the surroundings and more air is entrained the average concentration willreduce, so 𝑔𝑔′ and thus Archimedes number become smaller; the result is the trajectory becomes less steep solengthening 𝑥𝑥𝑇𝑇 . Were this aspect to be accounted for in the model it forms an implicit solution and thereforedifficult to compute. Since using 𝐴𝐴𝐴𝐴𝑜𝑜 must produce a more pessimistic result (higher floor concentration)then it was opted to adopt this simplification of using IDU discharge 𝐴𝐴𝐴𝐴𝑜𝑜 . Since 𝑢𝑢𝑜𝑜 𝑉𝑉𝑜𝑜̇ /𝐴𝐴𝑜𝑜 :𝐴𝐴𝐴𝐴𝑜𝑜 8)Since to be in a useable form 𝑔𝑔′ must be based on the IDU discharge condition, i.e., at the start of the releasewhere surrounding air is uncontaminated and discharge concentration (𝐶𝐶𝑜𝑜 ) is known:𝜌𝜌𝑚𝑚 𝜌𝜌𝑎𝑎 𝜌𝜌𝑎𝑎𝑔𝑔′ 𝑔𝑔 (9)where 𝑔𝑔 is gravity, 𝜌𝜌𝑚𝑚 is density of the refrigerant-air mixture (kg m-3) and 𝜌𝜌𝑎𝑎 is air density (kg m-3). Themixture density may be approximated as 𝜌𝜌𝑚𝑚 𝐶𝐶𝑜𝑜 𝜌𝜌𝑎𝑎 , where 𝐶𝐶𝑜𝑜 is refrigerant concentration (kg m-3) in thedischarged air.For the time being, assuming that the release mixes homogenously with the entire airflow within the IDUhousing, bulk mean concentration of the discharged jet would be:𝐶𝐶𝑜𝑜 ̇𝑜𝑜(10)Substituting (10), (9) and (8) into (6), and combining the constants yields:𝑥𝑥𝑇𝑇 ℎ𝑜𝑜 𝑔𝑔𝑚𝑚̇1/2.59.6𝑉𝑉̇𝑜𝑜3 𝜌𝜌𝑎𝑎 1.5𝑙𝑙𝑙𝑙𝑙𝑙𝑙𝑙 𝐴𝐴𝑜𝑜 𝑏𝑏 𝛼𝛼(11)However, if the room is sufficiently small then the jet can impinge on the opposite wall of the room in whichcase termination distance is taken as the representative distance across the room:𝑥𝑥𝑇𝑇 𝐴𝐴𝑟𝑟𝑟𝑟13th IIR Gustav Lorentzen Conference, Valencia, 2018(12)
10.18462/iir.gl.2018.1104where 𝐴𝐴𝑟𝑟𝑟𝑟 is the room floor area (m2).With higher refrigerant leak rates or lower airflow rates the distance to the floor is generally less than 𝐴𝐴𝑟𝑟𝑚𝑚 .Therefore it is reasonable to use the approach for a negatively buoyant jet impinging on the floor for theanalysis.2.4 Dilution processRefrigerant concentration within the IDU air discharge was defined in equation (10). At the time that therelease begins (say, at time 𝑡𝑡1 ) and assuming the jet enters an uncontaminated space and that therefrigerant continues to mix homogenously within the progressing jet, concentration at some distance (𝑥𝑥)along the jet is:𝐶𝐶̅ (𝑥𝑥) ̇ (𝑥𝑥)(13)Over time, the discharged refrigerant will mix within the room and therefore the entrained air comprises anincreasingly richer mixture, peaking at cessation of the leak. Thus the total volume of air that has beenentrained into the jet for the duration of the leak, or the volume of air within the room, whichever thesmaller, is used to estimate the average concentration of the surrounding air at the time of cessation of therelease (time 𝑡𝑡2), ��𝑡2 𝑚𝑚𝑚𝑚𝑚𝑚{Σ𝑉𝑉̇ 𝑡𝑡 𝑟𝑟𝑒𝑒 𝑙𝑙𝑙𝑙𝑙𝑙𝑙𝑙 ,𝑉𝑉𝑟𝑟𝑟𝑟 }(14)where 𝑚𝑚𝑟𝑟 is the total mass of refrigerant released (kg) and 𝑡𝑡𝑙𝑙𝑙𝑙𝑙𝑙𝑙𝑙 is the time over which it is released (s), i.e.,𝑡𝑡2 𝑡𝑡1.In practice, there is usually a minimum IDU airflow rate associated with a given capacity (typically in theorder of 75 m3 h-1 per kW) and thus room size on account of the associated heat load and a certain airdischarge opening area to ensure the necessary air throw. Quantifying the term Σ𝑉𝑉𝑒𝑒̇ 𝑡𝑡𝑙𝑙𝑙𝑙𝑙𝑙𝑙𝑙 across a wide rangeof conditions, including leak time, indicates that 𝑉𝑉𝑟𝑟𝑟𝑟 will always be exceeded by up to a factor of five.Whilst this does not guarantee that the released refrigerant will be perfectly distributed throughout the entireroom, it does provide some confidence that the term 𝑚𝑚𝑚𝑚𝑚𝑚 Σ𝑉𝑉𝑒𝑒̇ 𝑡𝑡𝑙𝑙𝑙𝑙𝑙𝑙𝑙𝑙 , 𝑉𝑉𝑟𝑟𝑟𝑟 can simply revert to 𝑉𝑉𝑟𝑟𝑟𝑟 ; thus̅𝐶𝐶𝑠𝑠𝑠𝑠𝑠𝑠,𝑡𝑡2is the mean room concentration. This assumption has been further supported by CFD simulationsover a wide range of scenarios (see Figure 3).For any given time, the maximum concentration at floor level must correspond to the concentration withinthe jet as it approaches the floor or wall. At the beginning of the release (𝑡𝑡1), that maximum concentrationcorresponds to the termination position of the jet as in equation (10), when setting 𝑥𝑥 𝑥𝑥𝑇𝑇 , i.e.:̅𝐶𝐶𝑚𝑚𝑚𝑚𝑚𝑚,𝑡𝑡1 ̇ (𝑥𝑥𝑇𝑇 )̅𝐶𝐶𝑚𝑚𝑚𝑚𝑚𝑚,𝑡𝑡2 𝑚𝑚̇𝑙𝑙𝑙𝑙𝑙𝑙𝑙𝑙 𝑚𝑚̇𝑠𝑠𝑠𝑠𝑠𝑠 ̇ (𝑥𝑥𝑇𝑇 )(15)As mentioned above, moments before cessation of the release the entrained air along the trajectory of the jetwill also comprise refrigerant mixed within the room and in addition the refrigerant within the air drawn intothe IDU suction. Thus, at cessation of the leak the maximum concentration will be:(16)where 𝑚𝑚̇𝑠𝑠𝑠𝑠𝑠𝑠 is the mass flow of refrigerant from the surroundings (kg s-1), i.e. from the entrained mixture, is:̅𝑚𝑚̇𝑠𝑠𝑠𝑠𝑠𝑠 𝑠𝑠𝑠𝑠𝑠 𝑜𝑜̇(18)And 𝑚𝑚̇𝑠𝑠𝑢𝑢𝑢𝑢𝑢𝑢 is the mass flow of refrigerant into the IDU suction (kg s-1); since the volume flow of air into theIDU must be the same as that being discharged (𝑉𝑉𝑜𝑜̇ ), then:Substituting equations (14), (17) and (18) into (16), the maximum concentration at cessation of the releasecan be expressed as a function of exit airflow rate:13th IIR Gustav Lorentzen Conference, Valencia, 2018
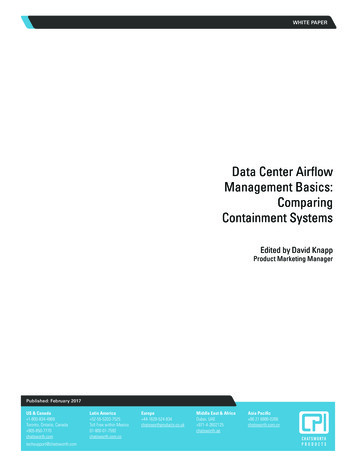
�𝑚𝑚,𝑡𝑡2 ̇ (𝑥𝑥𝑇𝑇 )𝑚𝑚𝑟𝑟 𝑉𝑉(19)𝑟𝑟𝑟𝑟̅Introducing equation (4) into (19) enables 𝐶𝐶𝑚𝑚𝑚𝑚𝑚𝑚,𝑡𝑡2to be determined as a function of IDU airflow in the caseof full room mixing (equation 20).̅𝐶𝐶𝑚𝑚𝑚𝑚𝑚𝑚,𝑡𝑡2 𝑥𝑥𝑏𝑏𝑉𝑉̇𝑜𝑜 𝑇𝑇𝐴𝐴𝑜𝑜𝑚𝑚𝑟𝑟 𝑉𝑉(20)𝑟𝑟𝑟𝑟̅By setting 𝐶𝐶𝑚𝑚𝑚𝑚𝑚𝑚,𝑡𝑡2 𝐿𝐿𝐿𝐿𝐿𝐿𝑚𝑚 and rearranging, plus with the introduction of a new dimensionless term (𝑅𝑅) toaccount for heterogeneity of the discharged refrigerant-air mixture (see section 3.1), equation (20) providesan explicit formula (equation 21) for determining minimum required airflow rate.𝑉𝑉𝑜𝑜̇ 𝑥𝑥𝑇𝑇𝑚𝑚𝑅𝑅𝑅𝑅 𝐿𝐿𝐿𝐿𝐿𝐿 𝑟𝑟 y, equation (11) or (12) can be inserted into equation (21) and combining constants (including 𝑅𝑅 1/3),yields equations (22) and (23), ��𝑚 𝑉𝑉̇𝑜𝑜,𝑚𝑚𝑚𝑚𝑚𝑚 5.6𝑚𝑚̇𝑙𝑙𝑙𝑙𝑙𝑙𝑙𝑙 𝐴𝐴𝑜𝑜1/4𝐴𝐴𝑟𝑟𝑟𝑟 𝐿𝐿𝐿𝐿𝐿𝐿 3/4(22)𝑚𝑚𝑟𝑟 �𝑙𝑙𝑙𝑙 𝐴𝐴𝑜𝑜1/8ℎ𝑜𝑜 𝐿𝐿𝐿𝐿𝐿𝐿 (23)𝑚𝑚𝑟𝑟 5/8 𝑉𝑉𝑟𝑟𝑟𝑟Under some situations, the jet will terminate on the opposite wall of the room, i.e., 𝑥𝑥𝑇𝑇 𝐴𝐴𝑟𝑟𝑟𝑟 , whereequation (22) is applicable. When lower leakage mass flow rates are assumed (which implicitly results inlower 𝑉𝑉̇𝑜𝑜,𝑚𝑚𝑚𝑚𝑚𝑚 ) and the IDU is closer to the floor, the trajectory of the negatively buoyant jet veers towards thefloor before reaching the opposite wall (𝑥𝑥𝑇𝑇 𝐴𝐴𝑟𝑟𝑟𝑟 ); in this case equation (23) needs to be applied. Throughextensive evaluation of all applicable variables, equation (23) need only be applied when the R290 leak massflow rate is less than, 𝑚𝑚̇𝑙𝑙𝑙𝑙𝑙𝑙𝑙𝑙 𝑚𝑚𝑟𝑟 /(145 ℎ0 180).Assessment of the approach was also carried out with CFD software (Simflow/OpenFOAM 1), evaluating arange of conditions typical for RACS (airflow rate, discharge area, release mass and mass flow, unit height,discharge direction and room size). On average (e.g., over a several second duration to smooth out the“flapping” phenomenon), the trajectory of the jet was mostly less pronounced than equation (11) inferred.The exception was with units close to the floor where the Coandă effect helps draw the jet closer to the floor.But in all cases the extent of the LFL boundary was further from the floor or wall as anticipated by themodel; examples are provided in Figure 2, Figure 3 and Figure 4.Figure 2: Contours* showingtrajectory, 𝐴𝐴𝑜𝑜 0.20 m2, 500 g at141 g min-1; 𝑥𝑥𝑇𝑇 5.5 mFigure 3:Contours* showingtrajectory, 𝐴𝐴𝑜𝑜 0.05 m2, 500 g at141 g min-1; 𝑥𝑥𝑇𝑇 5.5 m; nearlyall room air mixed within 70 sFigure 4: Contours* showingtrajectory, 𝐴𝐴𝑜𝑜 0.05 m2, 500 g at141 g min-1; 𝑥𝑥𝑇𝑇 4.1 m* Red contour is region above LFL; green is 0.5 LFL to LFL; pale blue is 5% of LFL; room length 4.5 m1https://sim-flow.com/; solver: rhoreactingbuoyantFOAM, turbulence model: RANS RNG κ-ε; mesh: 0.015 – 0.06 m13th IIR Gustav Lorentzen Conference, Valencia, 2018
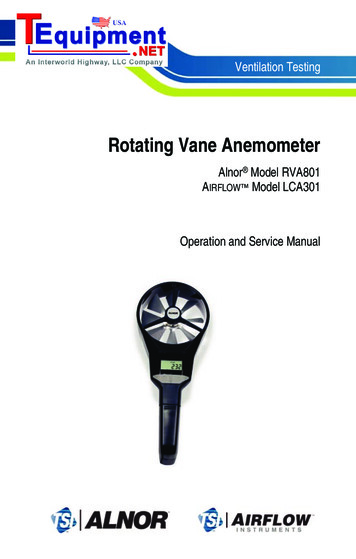
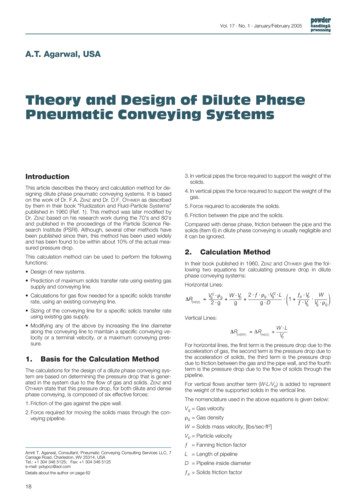
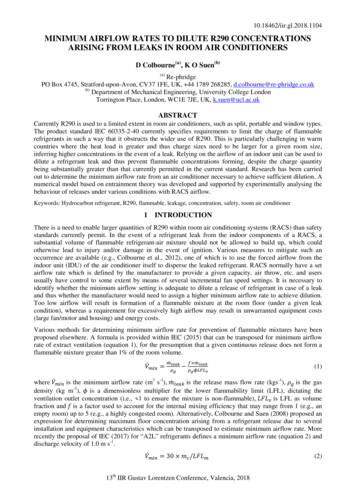
10.18462/iir.gl.2018.11043 MEASUREMENTSA series of measurements were conducted to clarify several aspects, such as understanding the heterogeneityof the mixture at IDU discharge, the lateral distribution within the room and also a variety of differentconditions to help validate the proposed formulae.3.1 IDU exit conditionAn initial assumption was that a release of refrigerant within an IDU is fully mixed within the airflow, beforebeing discharged. Experiments were carried out in order to examine the validity of this assumption. Twotypes of IDU’s were considered: three typical “wall” units and a “floor” unit. R290 releases of variousconstant mass flow rates were made from different positions within the IDUs over a range of airflow ratesettings.1200.19 m3/s0.24 m3/s100Mean concnetraton [g/m3]Mean concentration [g/m3]1200.31 m3/s8060402013 g/min47 g/min10078 g/min80100 g/min256 g/min604020000.00.20.40.60.8Distance along outlet [m]0.01.0Figure 5: Measurements of R290 concentrationwithin air discharged from an IDU at varyingairflow rates0.20.40.60.8Distance along outlet [m]1.0Figure 6: Measurements of R290 concentrationwithin air discharged from an IDU at varyingrelease mass flow ratesWith the floor IDU R290 concentrations were measured at six equidistant positions along the centreline ofthe air discharge outlet. Figure 5 shows results with a 100 g/min release simulated from the coil right handreturn bends and airflow rates of 0.19, 0.24 and 0.31 m3 s-1, whilst the results in Figure 6 used a fixed 0.19m3 s-1 airflow and release rates ranging from 13 to 256 g min-1. These indicate that irrespective of theconditions, refrigerant remains within about one-third of the discharged air, with the majority being within1/5th.Releases were simulated at four other locations, as indicated in Figure 7. Positioning and orientation of thereleases were intended to create as much pre-mixing within the IDU as possible before the R290 wasdischarged with the air. Whilst most of these alternative release positions did lead to a wider distribution ofrefrigerant across the discharged air (Figure 8), full homogeneity could not be achieved.60Stuffed into centre of coilMean concentration [g/m3]Into centreright faninto CR fanfrom R base horizto RS cornerRH return bendscentre coilRight hand return bendsFrom right basehorizontalInto right sidecornerFigure 7: Positions/direction of additional releasepoints and position of sampling points (red dots)504030201000.00.20.40.6Distance along outlet [m]0.81.0Figure 8: Average concentration at linear distancesalong air discharge arising from different releasepointsFurther measurements were carried out on wall IDUs in a similar fashion, but with a finer distribution ofsampling points (40 mm apart) and covering the width of the outlet at five angular locations relative to thehorizontal (270 ). Figure 9 and Figure 10 show local R290 concentrations for a low (480 m3 h-1) and high(1260 m3 h-1) IDU airflow rate arising from a 30 g min-1 release rate from the coil return. A similar tendency13th IIR Gustav Lorentzen Conference, Valencia, 2018
10.18462/iir.gl.2018.1104with the floor IDU is seen, where the majority of refrigerant is discharged from about half of the dischargeopening (about 225 to 270 ) and about one-quarter of the length. This pattern was replicated in both 2.5 kWand 8 kW IDUs and over several different leak positions and orientations about the right-hand return bends.Maximum local values along the length are given in Figure 11 for four different airflow rates. As with thefloor IDU, increasing airflow rate does not help homogenise the exit concentration. Comparing the peakconcentrations against the bulk mean concentration (as expressed in equation 10) Figure 12 indicates a largediscrepancy in the order of eight to 15, inherent in the assumption of homogenous mixing inside the IDU.Figure 9: Local R290 concentration at wall unitdischarge with 30 g/min and 480 m3/h airflowFigure 10: Local R290 concentration at wall unitdischarge with 30 g/min and 1260 m3/h airflowBased on these results, it is evident that the majority of the discharged air is not directly useful for dilution ofa release. An approximation from these data suggests that broadly two-thirds of the discharged volumeairflow may be neglected. Accordingly, the term applied to equation (21) was set at 𝑅𝑅 1/3.Figure 11: Maximum R290 concentration alongdischarge for different airflow ratesFigure 12: Comparison of maximum concentrationand bulk mean concentration3.2 Spatial distribution of discharged mixtureWhilst the measurements described above were made immediately after the IDU outlet, it may be possiblethat refrigerant mixing occurs across the entire jet prior to approaching the floor or opposite wall.Measurements were used to help provide confirmation of the validity of equation (11) for determining 𝑥𝑥𝑇𝑇and the usefulness of the term, 𝑅𝑅 . Two arrangements were prepared to investigate this further. Figure 13shows (a) incrementally spaced sampling points (purple) at floor level in order to indicate 𝑥𝑥𝑇𝑇 and (b) amatrix of sampling points arranged at the same height as the IDU outlet (“hH” in the graphs) and also at 0.15m below (“hL”) to indicate both vertical and lateral distribution of the refrigerant within the discharged air.Figure 14 plots local floor concentration (in line with the release position), with the respective colouredarrows indicating the result for 𝑥𝑥𝑇𝑇 from equation (11). There is fairly good agreement, especially whenconsidering the variability of the release conditions.13th IIR Gustav Lorentzen Conference, Valencia, 2018
10.18462/iir.gl.2018.110440100 g/m, 0.03 m2, 135 m3/h200 g/m, 0.03 m2, 400 m3/h50 g/m, 0.12 m2, 135 m3/hBenchConcentration [g/m3]Barrierrelease 0.6 mWall unit0m302010-0.6 m00.01.02.5 m1.50 m0.5 mFigure 13: Layout of test room (3.5 m 4 m) withsampling points indicated2.03.0Distance from IDU [m]4.0Figure 14: Floor concentrations during a release(g/min) within the IDU with outlet opening (m2) andairflow (m3 h-1) at different conditionsTwo sets of results are shown in Figure 15 and Figure 16, which are from identical test arrangements, exceptfor different airflow rates. (Note data for -0.6 m is not included since it matches that of 0 m.) Concentrationsalong the 0 m line are about the same, irrespective of height and distance from the IDU and approximatelycorrespond to mean room concentration. Concentrations directly in front of the release start at a high valueand then decrease towards the background concentration at the far end of the room. Crucially, concentrationsat 0.15 m below the plane of air discharge are found to be higher in the centre of the room, inferring adownward trajectory of the refrigerant-rich part of the jet. Results for the lower airflow rate suggest a steepertrajectory on account of the more pronounced decline in concentrations towards the far end of the room.0 m (h H)20200 m (h H)160 m (h L)0.6 m (h H)0 m (h L)0.6 m (h L)1284Concentration [g/m3]Concentration [g/m3]0.6 m (h H)160.6 m (h L)1284000.00.51.01.52.0Distance from IDU [m]2.53.0Figure 15: Local concentrations in front on airdischarge; 1260 m3 h-1, 120 g min-1 and 200 g0.00.51.01.52.0Distance from IDU [m]2.53.0Figure 16: Local concentrations in front on airdischarge; 480 m3 h-1, 120 g min-1 and 200 g3.3 Validation̅) were compared against maximum measuredEquations (22) and (23) (rearranged as a function of ations across a large number of experiments from our database, involving different RACS and alsocommercial refrigeration equipment (CRE). Across the database, tests used a wide range of variables, suchas airflow rates, outlet areas, unit height/positioning, released masses and mass flow rates, room sizes andalso density and distribution of sampling points. Figure 17 shows comparison between the measured andcalculated values with approximately 250 data-points, which shows that the equations under predict in mostcases. However, since the primary purpose of the task is to determine a minimum airflow rate to guaranteeagainst a flammable mixture forming, a positive adjustment factor of 1.2 was applied to minimise thenumber of data-points remaining to the left of parity (Figure 18).13th IIR Gustav Lorentzen Conference, Valencia, 2018
10.18462/iir.gl.2018.11040.060.06RACSCf,max measured [kg/m3]Cf,max measured [kg/m3]RACSCRE0.040.020.000.000.020.04Cf,max calculated [kg/m3]40.040.020.000.000.06Figure 17: Comparison of measured maximumconcentrations and unadjusted proposed formulaeCRE0.020.04Cf,max calculated [kg/m3]0.06Figure 18: Comparison of measured maximumconcentrations and proposed formulae adjusted to“catch all”FINAL REMARKSUsually, refrigerant charge amount for a RACS is determined according to the room size into which the IDUwill be installed and the LFL of the refrigerant:𝑚𝑚𝑚𝑚𝑚𝑚𝑚𝑚 𝐹𝐹 𝐿𝐿𝐿𝐿𝐿𝐿 𝐴𝐴𝑟𝑟𝑟𝑟 ℎ𝑟𝑟𝑟𝑟(24)where 𝑚𝑚𝑚𝑚𝑚𝑚𝑚𝑚 is the maximum charge (kg), ℎ𝑟𝑟𝑟𝑟 is the room height (m) usually assumed to be 2.2 m or 2.5 mand 𝐹𝐹 is a non-dimensional limit intended to avoid the entire room approaching LFL; with typical valuesranging from 0.1 to 0.5 according to how much refrigerant a given RACS requires.In order to make equations (22) and (23) more directly and practically applicable, equation (24) is substitutedin (and including the 1.2 adjustment factor), giving:1/46.8 𝐴𝐴 ���𝑚𝑚 1/4 𝑜𝑜 𝑙𝑙𝑙𝑙𝑙𝑙𝑙𝑙 1 𝐹𝐹 3/4𝑉𝑉̇𝑜𝑜,𝑚𝑚𝑚𝑚𝑚𝑚 𝑚𝑚𝑐𝑐 𝐿𝐿𝐿𝐿𝐿𝐿3/45 𝐴𝐴𝑜𝑜 ��𝑜 [𝐿𝐿𝐿𝐿𝐿𝐿(1 𝐹𝐹)]5/8(25)(26)Minimum airflow rate [m3/h]Using these formulae, some examples of minimum airflow rates according to the key variables are providedin Figure 19. It is seen that the minimum airflow ish 0 1 m, F 2500rather sensitive to the selected parameters, where0.5, t leak 4for example, high leak rates increase airflow aboutminIDUtypicalh 0 1 m, F 2000proportionally, doubling charge amount increaseshigh0.25, t leak 4airflow by a factor of three and increasing the outletandmin, 4 x A olowh 0 1 m, F 1500area by four (i.e., quartering discharge velocity)settings0.25, t leak 4doubles airflow, assuming the other factors are keptmin1000h 0 1 m, F constant. Also shown are typical values for high and0.5, t leak 15low airflow setting on IDUs, assuming a specificmin500h 0 0.5 m, F heat load of 200 W m-2 of room area. Evidently,0.25, t leak 30under some conditions IDU airflow may need to bemin0raised to the high setting to ensure flammable020406080mixtures are avoided and occasionally redesign ofRoom area [m2]the RACS may be necessary.Figure 19: Example of airflow rate requirementswith mean variablesCompared to the methods mentioned in theintroduction, use of equations (22) and (23) are attractive in several respects. In particular, the need to makejudgement on certain variables is eliminated, they account for discharge velocity of IDUs, absolute mass ofreleasable refrigerant charge and installation height of IDU (where applicable) as well as enabling the choiceof assumed leak rate. Moreover, they have been extensively validated against database of measurementsspecifically using RACS and CRE.13th IIR Gustav Lorentzen Conference, Valencia, 2018
10.18462/iir.gl.2018.1104ACKNOWLEDGEMENTSAuthors acknowledge the support of the German Ministry for Environment, Nature Conservation, Buildingand Nuclear Safety and the Deutsche Gesellschaft für Internationale Zusammenarbeit (GIZ) GmbH.REFERENCES1.2.3.4.5.Colbourne D., Hühren R., Vonsild A. 2012. Safety concept for hydrocarbon refrigerants in split air conditioner.Proc. 10th IIR-Gustav Lorentzen Conference on Natural Working Fluids, Delft, The Netherlands.Colbourne D., Suen K. O. 2008. Risk analysis of flammable refrigerants. 1. Correlations for concentrations fromleaks. Proc. 8th IIR-Gustav Lorentzen Conf. nat. Working Fluids, Copenhagen.Etheridge, D., Sandberg, M. 1996. Building ventilation: theory and measurement. British Gas Research andTechnology, John Wiley & Sons, UK.International Electrotechnical Commission (IEC). 2015. IEC 60079-10-1: Explosive atmospheres. Classification ofareas – Explosive gas atmospheres.International Electrotechnical Commission (IEC). 2017. 61D/386/FDIS. IEC 60335-2-40 ED6: Household andsimilar electrical appliances – Safety – Part 2-40: Particular requirements for electrical heat pumps, air-conditionersand dehumidifiers.13th IIR Gustav Lorentzen Conference, Valencia, 2018
suitably represent the case of a RACS in a closed room. Colbourne and Suen (2008) is based on a variety of highly pessimistic assumptions, such as the release originating from outside the unit housing and at low momentum and very high release mass flow ratesand the application of the formula itself is possibly too , unwieldly for use in a standard.