Transcription
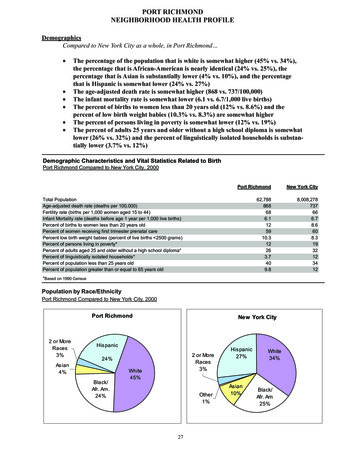
PORT RICHMONDNEIGHBORHOOD HEALTH PROFILEDemographicsCompared to New York City as a whole, in Port Richmond The percentage of the population that is white is somewhat higher (45% vs. 34%),the percentage that is African-American is nearly identical (24% vs. 25%), thepercentage that is Asian is substantially lower (4% vs. 10%), and the percentagethat is Hispanic is somewhat lower (24% vs. 27%)The age-adjusted death rate is somewhat higher (868 vs. 737/100,000)The infant mortality rate is somewhat lower (6.1 vs. 6.7/1,000 live births)The percent of births to women less than 20 years old (12% vs. 8.6%) and thepercent of low birth weight babies (10.3% vs. 8.3%) are somewhat higherThe percent of persons living in poverty is somewhat lower (12% vs. 19%)The percent of adults 25 years and older without a high school diploma is somewhatlower (26% vs. 32%) and the percent of linguistically isolated households is substantially lower (3.7% vs. 12%)Demographic Characteristics and Vital Statistics Related to BirthPort Richmond Compared to New York City, 2000Port RichmondNew York 666.78.6608.31932123412Total PopulationAge-adjusted death rate (deaths per 100,000)Fertility rate (births per 1,000 women aged 15 to 44)Infant Mortality rate (deaths before age 1 year per 1,000 live births)Percent of births to women less than 20 years oldPercent of women receiving first trimester prenatal carePercent low birth weight babies (percent of live births 2500 grams)Percent of persons living in poverty*Percent of adults aged 25 and older without a high school diploma*Percent of linguistically isolated households*Percent of population less than 25 years oldPercent of population greater than or equal to 65 years old*Based on 1990 CensusPopulation by Race/EthnicityPort Richmond Compared to New York City, 2000Port Richmond2 or MoreRaces3%New York CityHis panic2 or MoreRaces3%24%As ian4%Black/Afr. Black/Afr. Am25%
Port RichmondSelected Reportable ConditionsCompared to New York City as a whole, in Port Richmond the rate of Gonorrhea is substantially lower (68 vs. 146/100,000)Hepatitis A is substantially lower (3.2 vs. 6.7/100,000)Salmonellosis is substantially lower (6.4 vs. 15/100,000)Shigellosis is substantially lower (1.6/100,000 vs. 12/100,000)Selected Reportable Conditions for Port Richmond, 2000NeighborhoodNeighborhoodRate/100,000No. of CasesLead poisoning*New York poridiosis00.02.1Giardiasis0022Hepatitis A23.26.7Hepatitis B46.47.1Lyme gellosis11.612Typhoid ing Selected Reportable ConditionsRatio of Rate in Port Richmond to Rate of New York City, 2000Lead epatitis AHepatitis BLyme diseaseMalariaSalmonellosisShigellosisTyphoid fever00.20.40.60.8Ratio* Children ages 0 - 5 years old. This rate may differ from rates previously reportedif the total count of children in the population was not used as a denominator.** Female cases only; rate per 100,000 women.2811.2
Port RichmondSelected Cancer StatisticsCompared to New York City as a whole, in Port Richmond The rate of lung cancer in adults aged 45 to 64 is substantially higher (129 vs. 82/100,000) and the rate in adults aged 65 and older is somewhat higher (395 vs. 280/100,000)The rate of colorectal cancer in adults aged 65 and older is somewhat higher (395 vs.313/100,000)The rate of breast cancer in women aged 65 and older is somewhat higher (435 vs.373/100,000)The rate of prostate cancer in men aged 45 to 64 is somewhat lower (85 vs. 130/100,000)Selected Cancers by Sex and Age for Port Richmond, 1992-1996NeighborhoodNo. of CasesNeighborhoodAvg. Yearly Rate/100,000New York CityAvg. Yearly Rate/100,000Lung CancerAdults aged 45 to 64Adults aged 65 and OlderColorectal CancerAdults aged 45 to 64Adults aged 65 and 73Breast CancerWomen aged 45 to 64Women aged 65 and OlderProstate CancerMen aged 45 to 642585130Men aged 65 and Older95792805Comparing Selected Cancers, by Sex and AgeRatio of Rate in Port Richmond to Rate of New York City, 1992-1996Lung CancerAdults aged 45 to 64Adults aged 65 and OlderColorectal CancerAdults aged 45 to 64Adults aged 65 and OlderBreast CancerWomen aged 45 to 64Women aged 65 and OlderProstate CancerMen aged 45 to 64Men aged 65 and Older00.20.40.60.811.2Ratio291.41.61.8
Port RichmondLeading Causes of HospitalizationCompared to New York City as a whole, in Port Richmond The rate of hospitalization for asthma among children aged 9 and younger is somewhat lower (417 vs. 720/100,000)The rate of hospitalization for mental disorders among adolescents aged 10 to 17 issubstantially higher (756 vs. 367/100,000)The rate of hospitalization for diabetes among adolescents aged 10 to 17 is substantially higher (130 vs. 61/100,000)The rates of hospitalization for injuries and poisonings among adolescents aged 10to 17 (709 vs. 449/100,000) and adults aged 18 to 24 (938 vs. 550/100,000) are substantially higherThe rates of hospitalization for ischemic heart disease among adults aged 25 to 64(812 vs. 442/100,000) and adults aged 65 and older (4,114 vs. 2,599/100,000) aresubstantially higherThe rate of hospitalization for alcohol dependence syndrome among adults aged 25to 64 is substantially higher (670 vs. 261/100,000)Leading Causes of Hospitalizations by Age for Port Richmond, 2000No. of 00New York CityInjuries and poisonings58538411Pneumonia and influenza56519439Acute bronchitis and bronchiolitis54501408Asthma45417720Maternal cause of perinatal morbidity and mortality20185173Pregnancy and related conditions*461,1261,070Mental disorders64756367Injuries and e/100,000Children Aged 0-9Adolescents Aged 10-17Adults Aged 18-24Pregnancy and related conditions*37113,0869,055Mental disorders661,147775Injuries and poisonings54938550Drug abuse/dependence101741638139117Pregnancy and related conditions*7414,4473,782Mental disorders3591,1341,127Injuries and poisonings293926652Ischemic heart disease257812442Alcohol dependence syndrome212670261Ischemic heart disease2524,1142,599Other heart diseases2173,5423,375Pneumonia and influenza1562,5471,828AsthmaAdults Aged 25-64Adults Aged 65 and olderInjuries and poisonings1502,4492,148Cerebrovascular diseases1332,1711,539* Rate per 100,000 women.30
Port RichmondComparing Leading Causes of Hospitalization by AgeRatio of Rate in Port Richmond to Rate of New York City, 2000Children aged 9 and youngerInjuries and poisoningsPneumonia and influenzaAcute bronchitis and bronchiolitisAsthmaMaternal cause of perinatal morbid. & mort.Adolescents aged 10 to 17Pregnancy and related conditions*Mental disordersInjuries and poisoningsAsthmaDiabetesAdults aged 18 to 24Pregnancy and related conditions*Mental disordersInjuries and poisoningsDrug abuse/dependenceAsthmaAdults aged 25 to 64Pregnancy and related conditions*Mental disordersInjuries and poisoningsIschemic heart diseaseAlcohol dependence syndromeAdults aged 65 and olderIschemic heart diseaseOther heart diseasesPneumonia and influenzaInjuries and poisoningsCerebrovascular diseases00.20.40.60.8* Rate per 100,000 women.3111.21.41.6Ratio1.822.22.42.62.8
Port RichmondLeading Causes of DeathCompared to New York City as a whole, in Port Richmond The death rate from heart disease among adults aged 25 to 64 is substantially higher(123 vs. 77/100,000)The death rate from cerebrovascular diseases among adults aged 25 to 64 is substantially higher (16 vs. 10.5/100,000)The death rate from influenza and pneumonia among adults aged 65 and older issubstantially higher (424 vs. 201/100,000) (death rates from influenza and pneumonia can vary from year to year, depending on the incidence of influenza)The death rate from chronic lower respiratory diseases among adults aged 65 andolder is substantially higher (245 vs. 133/100,000)The death rate from nephritis, nephrotic syndrome and nephrosis among adultsaged 65 and older is substantially higher (131 vs. 66/100,000)Leading Causes of Death by Age for Port Richmond, 2000NeighborhoodNeighborhoodNew York CityNo. of DeathsRate/100,000Rate/100,000Malignant neoplasms4213391Diseases of heart3912377Human immunodeficiency virus (HIV) disease92841Cerebrovascular diseases51610.5Diabetes mellitus516112,152Adults Aged 25-64Adults Aged 65 and OlderDiseases of heart1422,318Malignant neoplasms741,208908Influenza and pneumonia26424201Chronic lower respiratory diseases13315245Cerebrovascular diseases8131146Diabetes mellitus8131137Nephritis, nephrotic syndrome and nephrosis813166Comparing Leading Causes of Death by AgeRatio of Rate in Port Richmond to Rate of New York City, 2000Adults aged 25 to 64Malignant neoplasmsDiseases of heartHuman immunodeficiency virus (HIV) diseaseCerebrovascular diseasesDiabetes mellitusAdults aged 65 and olderDiseases of heartMalignant neoplasmsInfluenza and pneumoniaChronic lower respiratory diseasesCerebrovascular diseasesDiabetes mellitusNephritis, nephrotic syndrome and nephrosis00.20.40.60.811.2Ratio321.41.61.822.2
32 Port Richmond Leading Causes of Death Compared to New York City as a whole, in Port Richmond The death rate from heart disease among adults aged 25 to 64 is substantially higher The death rate from cerebrovascular diseases among adults aged 25 to 64 is sub- The death rate from influenza and pneumonia among adults aged 65 and older is nia can vary from year to year, depending .