Transcription
September 2004 NREL/MP-560-36734Summary of ElectrolyticHydrogen ProductionMilestone Completion ReportJohanna IvyNational Renewable Energy Laboratory1617 Cole Boulevard, Golden, Colorado 80401-3393303-275-3000 www.nrel.govOperated for the U.S. Department of EnergyOffice of Energy Efficiency and Renewable Energyby Midwest Research Institute BattelleContract No. DE-AC36-99-GO10337
NOTICEThis report was prepared as an account of work sponsored by an agency of the United Statesgovernment. Neither the United States government nor any agency thereof, nor any of their employees,makes any warranty, express or implied, or assumes any legal liability or responsibility for the accuracy,completeness, or usefulness of any information, apparatus, product, or process disclosed, or representsthat its use would not infringe privately owned rights. Reference herein to any specific commercialproduct, process, or service by trade name, trademark, manufacturer, or otherwise does not necessarilyconstitute or imply its endorsement, recommendation, or favoring by the United States government or anyagency thereof. The views and opinions of authors expressed herein do not necessarily state or reflectthose of the United States government or any agency thereof.Available electronically at http://www.osti.gov/bridgeAvailable for a processing fee to U.S. Department of Energyand its contractors, in paper, from:U.S. Department of EnergyOffice of Scientific and Technical InformationP.O. Box 62Oak Ridge, TN 37831-0062phone: 865.576.8401fax: 865.576.5728email: mailto:reports@adonis.osti.govAvailable for sale to the public, in paper, from:U.S. Department of CommerceNational Technical Information Service5285 Port Royal RoadSpringfield, VA 22161phone: 800.553.6847fax: 703.605.6900email: orders@ntis.fedworld.govonline ordering: http://www.ntis.gov/ordering.htmPrinted on paper containing at least 50% wastepaper, including 20% postconsumer waste
1.0Executive SummaryThis report provides a technical and economic overview of the electrolytic hydrogenproduction systems commercially available as of December 2003. The technical analysisfocuses on five companies’ electrolysis units: Stuart IMET; Teledyne HM and EC;Proton HOGEN; Norsk Hydro HPE and Atmospheric; and Avalence Hydrofiller. Costinformation was obtained for three different systems, and the economics of theseprocesses were analyzed.The technical analysis found that currently, the largest electrolyzer unit sold producesonly 380,000 kg H2/year. There are two limitations for electrolyzers of this size. If thesystem were to be used for forecourt production, fueling approximately 1,900 cars, 2.3MW of electricity would be required. This electricity demand would likely preclude thepurchase of cheaper industrial electricity in the forecourt scenario, thus raising the priceof hydrogen. If the system were to be used in a large hydrogen generation plant, thelimited hydrogen production capacity means that a significant number of electrolyzerunits would be required. For example, a 500,000 kg/day hydrogen generation plant usingnuclear power and electrolysis would require 500 of the largest electrolyzer unitsavailable today. In this scenario, electrolyzers 10 to 100 times the size of today’s unitscould be utilized.An initial cost boundary analysis was completed to determine the effects of electricityprice on hydrogen costs. For each electrolyzer, the specific system energy requirementwas used to determine how much electricity is needed to produce hydrogen; no capital,operating or maintenance costs are included in the calculation. At current electrolyzerefficiencies, in order to produce hydrogen at lower than 3.00/kg, electricity costs mustbe lower than 4 and 5.5 cents per kWh. For an ideal system operating at 100%efficiency, electricity costs must be less then 7.5 cents per kWh to produce hydrogen atlower than 3.00/kg. This analysis demonstrates that regardless of any additional costelements, electricity costs will be a major price contributor.The detailed economic analyses are based on three distinct systems for which cost andeconomic data were available. These data may or may not be representative of the costsand systems within each category. These three systems represent a small neighborhood( 20 kg/day), a small forecourt ( 100 kg/day), and a forecourt size ( 1000 kg/day). Inthis analysis, the hydrogen selling prices were 19.01/kg H2 for the small neighborhoodsize, 8.09/kg H2 for the small forecourt size, and 4.15/kg H2 for the forecourt size. Theanalysis was performed using year 2000 dollars, which were escalated to 2005 dollars.For the forecourt case, electricity represents 58% of the cost of the hydrogen, and thecapital costs only 32%. For the small forecourt case, the electricity contribution drops to35% while the capital costs become the major cost factor at 55%. In the neighborhoodcase, the capital costs increase to 73%, but electricity costs are not insignificant at 17%.This analysis demonstrated that for all systems electricity price is a contributor tohydrogen price, but for small-sized electrolyzers, capital costs are more significant.1
2.0IntroductionThe purpose of this report is to give an overview of the current state of electrolytichydrogen production technologies, and to provide an economic analysis of the processes.The study focuses on five companies’ current electrolyzer lines: Stuart IMET; TeledyneHM and EC; Proton HOGEN; Norsk Hydro HPE and Atmospheric; and AvalenceHydrofiller. The report details the state of technology as of December 2003 for all fivecompanies’ electrolysis units, and then analyzes the economics of three standard sizedelectrolysis processes.3.0Analysis MethodologyThe technical details for each company’s electrolysis systems were obtained fromresearch on the Internet, and from personal conversations with industry representatives.The data presented are representative of systems available in December 2003. A detailedsummary of each electrolysis model included in this study can be found in Appendix A.For purposes of the analysis, the available electrolysis systems were categorized into fivedifferent size ranges: home, small neighborhood, neighborhood, small forecourt andforecourt. The term forecourt refers to a refueling station. The number of cars servedand hydrogen production rate for each size are as follows: The home size will serve the fuel needs of 1- 5 cars with a hydrogen productionrate of 200-1000 kg H2/year.The small neighborhood size will serve the fuel needs of 5-50 cars with ahydrogen production rate of 1000-10,000 kg H2/year.The neighborhood size will serve the fuel needs of 50-150 cars with a hydrogenproduction rate of 10,000 – 30,000 kg H2/year.The small forecourt size, which could be a single hydrogen pump at an existingstation, will serve 150 – 500 cars with a hydrogen production rate of 30,000 –100,000 kg H2/year.A full hydrogen forecourt will serve more then 500 cars per year with a hydrogenproduction rate of greater then 100,000 kg H2/year.The number of cars served was determined by calculating that a car requiresapproximately 200 kg of hydrogen per year. This 200 kg requirement assumes that onaverage a car travels 12,000 miles per year, and that a vehicle will travel 60 miles/kg ofhydrogen.Table 1 below illustrates where each manufacture’s electrolysis models fit into thesecategories.2
Table 1: Hydrogen Station SizeManufacturer ModelAvalence Hydrofiller 15Proton HOGEN 20Proton HOGEN 40Avalence Hydrofiller 50Teledyne HM-50Stuart IMET 300, 1 cell stack, 300 cm3Avalence Hydrofiller 175Stuart IMET 1000, 1 cell stack, 1000 cm3Teledyne HM-100Teledyne HM-125Teledyne HM-150Proton HOGEN 3801Norsk HPE 10Teledyne HM-200Norsk HPE 12Norsk HPE 16Norsk HPE 20Norsk HPE 24Teledyne EC-500Stuart IMET 1000, 2 cell stack, 1000 cm3Norsk HPE 30Teledyne EC-600Norsk HPE 40Teledyne EC-750Stuart IMET 1000, 3 cell stack, 1000 cm3Norsk Atmospheric Type No.5010 (4000 Amp DC)Norsk Atmospheric Type No.5010 (5150 Amp DC)Norsk HPE 50Stuart IMET 1000, 4 cell stack, 1000 cm3Norsk HPW 60Stuart IMET 1000, 4 cell stack, 1000 cm3Norsk Atmospheric Type No.5020 (4000 Amp DC)Norsk Atmospheric Type No.5020 (5150 Amp DC)Norsk Atmospheric Type No.5030 (4000 Amp DC)Norsk Atmospheric Type No.5030 (5150 Amp DC)Norsk Atmospheric Type No.5040 (4000 Amp DC)Norsk Atmospheric Type No.5040 (5150 Amp DC)1HydrogenProduction Ratekg/day 8321046381864# of carsservedStation 909HomeHomeHomeSmall NeighborhoodSmall NeighborhoodSmall NeighborhoodSmall NeighborhoodSmall NeighborhoodSmall NeighborhoodSmall NeighborhoodSmall NeighborhoodSmall NeighborhoodSmall NeighborhoodSmall NeighborhoodSmall l ForecourtSmall ForecourtSmall ForecourtSmall ForecourtSmall ForecourtSmall ForecourtSmall ForecourtSmall ForecourtSmall ourtForecourtProton’s HOGEN 380 has now been replaced by the HOGEN H Series. The HOGEN 380 pre-productionunit was used because data on Proton’s H Series Electrolyzers were not available in December 2003, whichis the cutoff time for this report.3
The table illustrates the production rates of current electrolysis units. Today, only NorskHydro makes an electrolyzer large enough to be considered a forecourt-sized system.Alkaline producers Teledyne and Stuart manufacture systems in the small neighborhood,neighborhood and small forecourt range, and Avalence’s small unipolar alkalineelectrolyzers are currently only sized for the home and small neighborhood. In contrast,Proton Exchange Membrane (PEM) electrolysis units, produced by Proton, are only sizedfor the home or small neighborhood system. This is a typical trend in the industry todayas the high capital costs of PEM units limit their current viability in the large hydrogenproduction market, while alkaline units, with their lower capital costs, can produce acrossa range of hydrogen capacities.Additionally, the categories were used to allow cost data to be generalized by systemsize. The economic analyses are based on three distinct systems for which cost andeconomic data were available. These data may or may not be representative of the costsand systems within each category. The three systems represent a small neighborhood( 20 kg/day), a small forecourt ( 100 kg/day), and a forecourt size ( 1000 kg/day). Thespecific manufacturer and model analyzed is not presented as it was agreed that specificcost data would remain confidential.The initial version of this analysis, published March 19, 2004, used a beta version of theH2A model to calculate the discounted cash flow for the electrolysis process. In thisversion of the analysis, an updated version of the H2A model was used.4.0Technology DescriptionHydrogen is produced via electrolysis by passing electricity through two electrodes inwater. The water molecule is split and produces oxygen at the anode and hydrogen at thecathode.Three types of industrial electrolysis units are being produced today. Two involve anaqueous solution of potassium hydroxide (KOH), which is used because of its highconductivity, and are referred to as alkaline electrolyzers. These units can be eitherunipolar or bipolar. The unipolar electrolyzer resembles a tank and has electrodesconnected in parallel. A membrane is placed between the cathode and anode, whichseparate the hydrogen and oxygen as the gasses are produced, but allows the transfer ofions. The bipolar design resembles a filter press. Electrolysis cells are connected inseries, and hydrogen is produced on one side of the cell, oxygen on the other. Again, amembrane separates the electrodes.The third type of electrolysis unit is a Solid Polymer Electrolyte (SPE) electrolyzer.These systems are also referred to as PEM or Proton Exchange Membrane electrolyzers.In this unit the electrolyte is a solid ion conducting membrane as opposed to the aqueoussolution in the alkaline electrolyzers. The membrane allows the H ion to transfer fromthe anode side of the membrane to the cathode side, where it forms hydrogen. The SPEmembrane also serves to separate the hydrogen and oxygen gasses, as oxygen is produced4
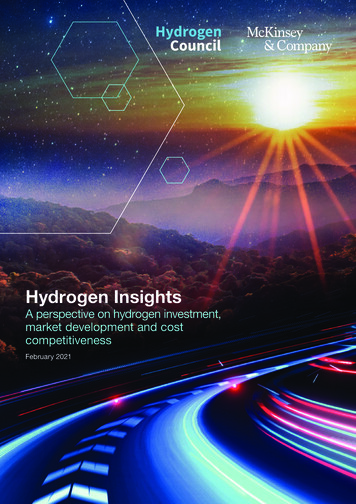
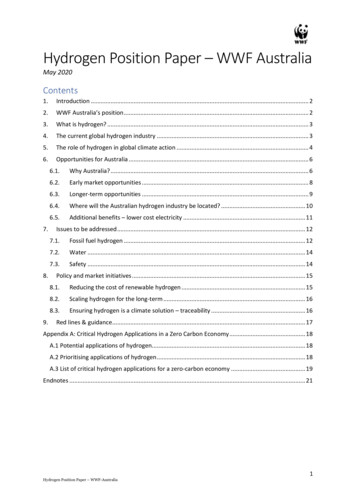
at the anode on one side of the membrane and hydrogen is produced on the opposite sideof the membrane.The Avalence Hydrofiller is the only unipolar electrolyzer discussed in this study. NorskHydro, Stuart, and Teledyne all produce bipolar electrolysis units. These units arecurrently capable of producing the largest amounts of hydrogen, and today are in useworldwide. The PEM electrolysis unit is the newest of the technologies discussed in thisreport, and Proton is the only PEM electrolyzer discussed in this study.Regardless of the technology, the overall electrolysis reaction is the same:H2O ½ O2 H2However, reaction at each electrode differs between PEM and alkaline systems. In aPEM system the reactions at the electrodes are:PEM Hydrogen Production at the Cathode2 H 2e- H2PEM Oxygen Production at the AnodeH2O ½ O2 2 H 2eIn an alkaline system the reaction at each electrode are:Alkaline Hydrogen Production at the Cathode2 H2O 2e- H2 2OHAlkaline Oxygen Production at the Anode2OH- ½ O2 2 H2O 2e5.0 Process DesignA typical electrolysis process diagram is shown in Figure 1 below. Note that differentprocesses will use different pieces of equipment. For example, PEM units will notrequire the KOH mixing tank, as no electrolytic solution is needed for these electrolyzers.Another example involves water purification equipment. Water quality requirementsdiffer across electrolyzers. Some units include water purification inside their hydrogengeneration unit, while others require an external deionizer or reverse osmosis unit beforewater is fed to the cell stacks. For systems that do not include a water purifier, one isadded in the process flow. A water storage tank may be included to ensure that theprocess has adequate water in storage in case the water system is interrupted. Eachsystem has a hydrogen generation unit that integrates the electrolysis stack, gaspurification and dryer, and heat removal. Electrolyte circulation is also included in the5
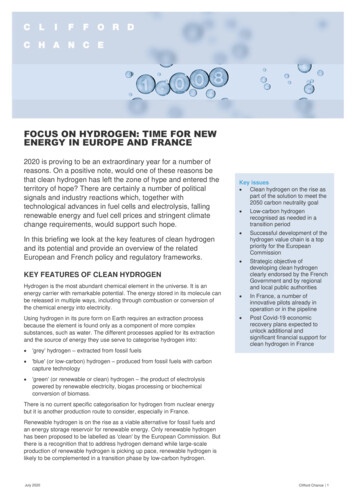
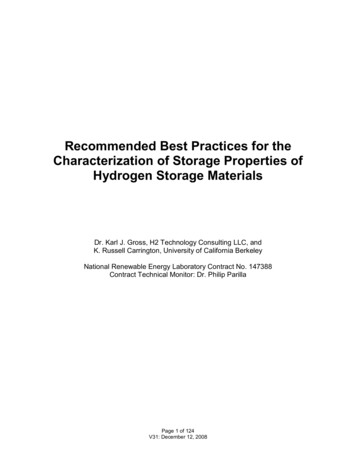
hydrogen generation unit in alkaline systems. The integrated system is usually enclosedin a container or is installed as a complete package. Oxygen and purified hydrogen areproduced from the hydrogen generation unit. If desired, a compressor and hydrogenstorage can be added to the system. Although hydrogen storage and compression areincluded in the process diagram below, for purposes of this analysis, hydrogen storage isnot included. It is assumed that as the hydrogen is produced it is fed directly into apipeline or truck. In addition, note that there is no oxygen compression and storage. Forthe purposes of this analysis, oxygen production is not considered.Typical utilities that the electrolysis systems need include electricity for electrolysis andother peripheral equipment; cooling water for the hydrogen generation unit; prepressurization gas; and inert gas.Process H2OHigh Purity H2OUtilitiesHigh Purity H2OWater PurifierFeed Water Storage TankCoolingWaterPrepressurization InstrumentAirGasElectrolyte SolutionKOH Mixing TankHydrogenGenerationUnitPower Supplyyyy 99% Pure H2Electrolysis moduleElectrolyte circulationHydrogen Gas Dryer/PurifierH2Hydrogen StorageCompressorFigure 1: Process Flow Diagram5.1. Mass Balance ResultsA simplified process flow is displayed in Figure 2 below to help illustrate the massbalance of the electrolysis system. The mass balance data provided are based on each ofthe manufacturers’ largest electrolysis system: the Stuart IMET 1000, the Teledyne EC750, the Proton Hogen 380, the Norsk Hydro Atmospheric Type No.5040 (5150 AmpDC) and the Avalence Hydrofiller 175.6
Water (4)Hyd ro g e nWater (1)Hydrogen (2)O xyge nElectrolyzerO xygen (3)Gas PurificationHydrogen Generation UnitStream (1)Stream (2)Stream (3)Stream (4)WaterHydrogen ProductOxygen ProductWater Removall/hrkg/hrkmole/hr Nm3/hrkg/hrkmole/hr Nm3/hrkg/hrkmole/hr l/hrkg/hrkmole/hrStuart 5921.6242.5346.5110.894.8294.825.3Avalance **4.54.50.250.450.22.53.570.10.480.480.03* Assumes stoichiometric production of oxygen** Assumes stoichiometric production of oxygen and 1 L of water input per kg of hydrogen produced.Figure 2: Mass BalanceThe product streams are assumed to be 100% oxygen or hydrogen because typically theamount of contaminant in the product streams is so small as to be considered negligible.The hydrogen purities for the above systems range from 99.9 - 99.9998%, and the oxygenpurities, where provided, range from 99.2-99.9993%. The difference in gas puritiesdepend on the gas purification technology used in each system.5.2. Energy Balance ResultsThe energy balance in Table 2 details the energy required for hydrogen production byeach manufacturer’s largest hydrogen generation system. Note that only Stuart andNorsk Hydro provide the actual energy requirement of the electrolyzer. Stuart alsoprovided the energy requirement of the entire system, while Norsk Hydro’s systemenergy requirement was calculated by using the power requirements of the system andthe hydrogen generation rate. Avalence’s system energy requirement was calculated inthe same manner. Proton and Teledyne both provide energy requirement data based onthe entire hydrogen production system. Only Norsk Hydro’s system energy requirementsinclude compression: one water injected screw compressor followed by a reciprocatingcompressor to bring the gas to 33bar (480 psi).7
Table 2: Energy BalanceEnergy Required:SystemManufacturerkWh/Nm3ModelStuart: IMET4.81000Teledyne: EC5.6750Proton: HOGEN6.3380Norsk Hydro:AtmosphericType No.50404.8(5150 Amp DC)Avalence:Hydrofiller 1755.4EnergySystemRequired: HydrogenPowerElectrolyzer Production 2235.270.1-106353.54.3485233060.5-4.6256.0 Efficiency ResultsEfficient conversion of water and electricity to hydrogen is critical to the electrolytichydrogen production technology.6.1. Conversion EfficiencyThe conversion efficiency of water to hydrogen is shown in Table 3. Overall, theconversion efficiency is high, ranging from 80-95%.Table 3: Conversion EfficiencyStuart: IMET 1000Teledyne: EC-750Proton: HOGEN 380Norsk Hydro: Atmospheric Type No.5040 (5150Amp DC)Avalence: Hydrofiller 54.54340.453473.680%89%6.2. Energy efficiencyEnergy efficiency is defined as the higher heating value (HHV) of hydrogen divided bythe energy consumed by the electrolysis system per kilogram of hydrogen produced. Thejustification for using HHV can be seen in Appendix B. The energy efficiency of theelectrolysis process is shown in Table 4. The energy efficiency ranges from 56-73%.Proton’s PEM process has the lowest efficiency at 56% and both Stuart’s and NorskHydro’s bipolar alkaline efficiencies are the highest at 73%. An efficiency goal forelectrolyzers in the future has been reported to be in the 50 kWh/kg range, or a systemefficiency of 78%. However, this 78% includes compression of the hydrogen gas to 60008
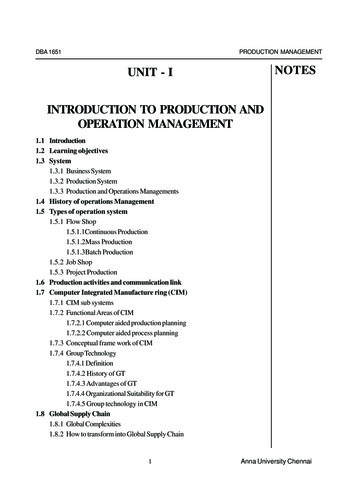
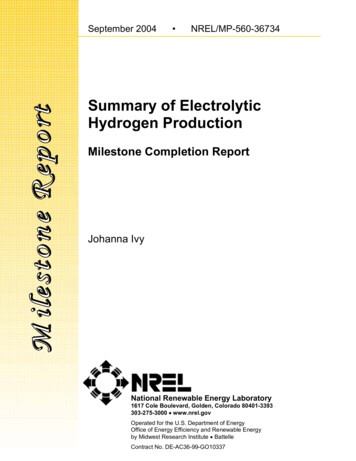
psi. Currently, these electrolyzers, other then Avalence’s, reach a pressure ranging from60-435 psig for the power requirements presented. These efficiencies would decrease ifadditional compression up to 6000 psig were included. Only Avalence’s energyrequirement of 60.5 kWh/kg includes reaching hydrogen pressures in the 6000 psigrange.Note that in this study the energy requirement of the entire electrolysis system is used tocalculate the efficiency, not just the efficiency of the electrolyzer. As an example, theelectrolyzer alone for the Stuart IMET 1000 requires 46.8 kWh/kg (4.2 kWh/Nm3), whichcorresponds to 83% efficiency when you divide the HHV of hydrogen by the electrolyzerpower requirement. However, when you include the rectifier and auxiliaries the energyrequirement becomes 53.5 kWh/kg or 73% efficient. As a result, when referring to the“System Energy Required” in this study, the value refers to the entire electrolysis system,not just the electrolyzer itself.Table 4: Energy EfficiencyStuart: IMET 1000Teledyne: EC-750Proton: HOGEN 380Norsk Hydro: AtmosphericType No.5040 (5150 AmpDC)Avalence: Hydrofiller 175EnergyRequiredSystemkWh/kg53.462.370.1HHV of Hydrogen(equivalent to 142 MJ/kg)kWh/kg39393953.5397360.53964System ProductionEfficiency Pressure%psig733606360-11556200435up to10,0007.0 Capital and Operating Cost ResultsAn initial boundary analysis was completed to determine the effects of electricity priceon hydrogen costs, and the results are shown in Figure 3. For each electrolyzer, thespecific system energy requirement is used to determine how much electricity is neededto produce hydrogen; no capital, operating or maintenance costs are included in thecalculation. The system energy requirement used is the lowest energy requirementreported for each manufacturer. This graph shows that, at current electrolyzerefficiencies, in order to produce hydrogen at lower than 3.00/kg, electricity costs mustbe between 4 and 5.5 /kWh. In order to produce hydrogen for less than 3.00/kg with asystem that is 100% efficient, electricity prices must be less than 7.5 /kWh. The U.S.Department of Energy’s Energy Information Administration (EIA) reports 2002industrial, commercial, and residential electricity prices at 4.83, 7.89, and 8.45 /kWh,respectively. Thus, if only electricity costs were incurred, current electrolyzers couldproduce hydrogen for 3.00/kg at industrial electricity prices; an ideal system couldproduce hydrogen for 3.00/kg at slightly lower then commercial prices. This analysis9
shows that regardless of any additional cost elements, electricity costs will be a majorprice contributor.Hydrogen costs via electrolysis with electricity costs only 8.00Commercial System Efficiencies (54-67 kWh/kg) 7.00H2 cost /kg 6.00Ideal System (HHV of Hydrogen 39 kWh/kg) 5.00 4.00 3.00 2.00 1.00 .0900.100Electricity costs /kWhFigure 328.0 Discounted Cash Flow ResultsThe discounted cash flow analysis was completed using the H2A model. The specificsfor each of the three systems analyzed will not be presented here, as each vendorrequested that the detailed economic data they provided remain confidential. Nonconfidential data and parameters are provided in Table 5, and show the cost assumptionsthat were used in the analysis which are common between all three systems analyzed.These parameters are included to help provide transparency in the analysis.Table 5: DCF ParametersParameterProcess ParametersPrimary FeedstockElectricity UsedConversion TechnologyAssumptionElectricity and WaterIndustrial ElectricityElectrolysisFinancial ParametersStart-up YearAfter-Tax Real IRR (%)Depreciation Type200510MACRS2The Proton efficiency is based on the HOGEN 380 series, which is no longer available. Currentefficiencies of Proton systems are in the 62-70 kWh/kg range10
ParameterAssumptionDepreciation Schedule Length (No. of Years)7Analysis Period (years)40Plant Life (years)40Assumed Inflation Rate (%)1.9State Income Taxes (%)6Federal Income Taxes (%)35Effective Tax Rate (%)38.9Operating Capacity Factor (%)97% Equity Financing100Length of Construction Period (years)1% of Capital Spent in 1st Year of Construction100Start-up Time (years)1% of Revenues During Start-up (%)75% of Variable Operating Costs During Start-up (%)75% of Fixed Operating Costs During Start-up (%)100Salvage Value of Capital (% of Total Capital Investment)10Decommissioning Costs (% of Total Capital Investment)10Replacement Capital ParametersElectrolyzer cell stack lifetime (years)5-15Indirect Depreciable Capital ParametersBuildings (% of fixed capital investment)14Yard Improvements (% of fixed capital investment)3.5Construction (% of fixed capital investment)9Engineering and design (% of fixed capital investment)8Contingency (% of fixed capital investment)25-30Non Depreciable Capital ParametersLand ( /acre)5,000O&M ParametersBurdened Labor ( /hour)50Overhead and G&A (% of labor cost)20Property Tax (% of depreciable capital costs)1Insurance Rate (% of depreciable capital costs)12005 was chosen as the startup year for this analysis because the study focuses oncurrently available technology. Presently, the electrolysis industry meets a smallermarket demand then would exist if hydrogen were in use as a transportation fuel. As thedemand for hydrogen increases, capital costs will come down due to mass production.The economic results of this study should be considered representative of the electrolysismarket as it stands today and in the near future, but not representative of long term costsand prices.The three systems represented in the discount cash flow (DCF) analysis were the onlythree systems for which cost and economic data were available. These data may or maynot be representative of the costs and systems within each category.11
Electricity prices for this analysis come from the H2A model, which projects electricityprices through 2070. The projections from 2001 through 2025 come from the latestAnnual Energy Outlook (AEO 2004) recently published by EIA. The projectionsbetween 2025 and 2035 are extrapolations of the EIA projections. The projections past2035 are derived from growth rates that came from a Pacific Northwest NationalLaboratory long-term energy model called Climate Assessment Model (M-CAM).Industrial electricity prices, reported as 4.83 /kWh for 2002 by EIA, were used for allbase case economic analyses. While electrolyzers may be too small to obtain the cheaperelectricity prices usually available to industrial users, using such prices in this analysissets the boundary for research goals on other parameters such as capital costs andefficiency. Additionally, sensitivity analyses were run to determine the impact of higherelectricity prices on the hydrogen selling price results.The results of the base case discounted cash flow analyses are shown in Table 6. Thehydrogen selling price ranges from 19.01/kg for the small neighborhood size to 4.15/kgfor the forecourt size. The analysis was performed using year 2000 dollars, which wereescalated to 2005 dollars. The after-tax real IRR was fixed at 10% and the hydrogenselling price was varied until the NPV equaled zero.Table 6: DCF OutputsDCF CALCULATION OUTPUTS:Small NeighborhoodSmall ForecourtForecourt 19.01 8.09 4.15 20.8810.0%13.0%12.1%15.1% 8.8910.0%12.5%12.1%14.6% 4.5610.0%12.7%12.1%14.9%Required Hydrogen Selling Price (Year2000 Real Dollars)Required Hydrogen Selling Price(Nominal Startup Year Dollars)After-Tax Real IRRPre-Tax Real IRRAfter-Tax Nominal IRRPre-Tax Nominal IRRThe above DCF calculations yielded the specific item costs for each of the systems, andare shown in Table 7. The feedstock cost contribution includes only the cost ofelectricity for the system. Although it can be argued that electricity is not a feedstock, itwas entered as such so that the electricity cost contribution can be easily distinguishedfrom other utilities such as the process water, cooling water and inert gas contribution,which can be seen in the variable O&M cost contribution row. As anticipated, the cost ofelectricity is a factor in all three of the cases.12
Table 7: DCF Item CostsSpecific Item ostCostItem 13.90 3.15 0.00 1.93 0.01 0.02 0.00Capital Cost ContributionFeedstock Cost ContributionOther Raw Material Cost ContributionFixed O&M (labor etc.) Cost ContributionVariable O&M Cost ContributionDecommissioning CostsByproduct Credit Cost Contribution 4.43 2.80 0.00 0.80 0.05 0.01 0.00 1.32 /kg of H2 2.41 /kg of H2 0.02 /kg of H2 0.37 /kg of H2 0.03 /kg of H2 0.00 /kg of H2 0.00 /kg of H2Note that a few factors differ between electrolysis cases, which will vary the costnumbers. First, each system has different electrolyzer system efficiencies. As a result,the systems will need different amount of electricity to make the same amount ofhydrogen. Second, different electrolyzers have different system lives. This analysis hadan analysis period and plant life of 40 years. This time was chosen to be consistent withthe H2A guidelines. However, electrolyzers have a stack life of 5-15 years, so differentmanufacturers stacks will need to be replaced at different intervals. The systems with theshorter system life will have higher capital costs.The graph in Figure 4 better illustrates the different cost contributions for all three cases,along with the difference in cost contributions across the cases. For all three cases, theother raw material cost contribution, decommissioning cost contribution, and variableO&M cost contribution are negligible. The other raw material cost contribution includesthe KOH electrolyte, when applicable. The variable O&M costs include utility costs:process or de-mineralized water, cooling water and inert gas. The inert gas is needed forinstruments and initial system pressurization. For all electrolysis units, capital costs andfeedstock costs are the two largest cost contributors, and fixed O&M costs are the thirdlargest contributor.13Units
Hydrogen Selling PriceIndustrial Electricity 20.00 /kg Hydrogen (2000 dollars) 18.00 16.00 14.00 12.00 10.00Decommissioning CostsOther Raw Material CostsOther Variable Costs (including utilities)Fixed O&MCapital CostsFeedst
Avalence Hydrofiller 15 0.9 315 1.6 Home Proton HOGEN 20 1 396 2.0 Home Proton HOGEN 40 2 789 3.9 Home Avalence Hydrofiller 50 3 1182 6 Small Neighborhood Teledyne HM-50 6 2205 11 Small Neighborhood Stuart IMET 300, 1 cell stack, 300 cm3 6 2364 12 Small Neighborhood Avalence Hydrofiller 175 10 3622 18 Small Neighborhood